DUSK Q3 2025 PLAN 🚀 $DUSK double-bottoming at 0.060-0.067 — the same demand that kick-started 200-300 % rallies before. 📉→📈
Catalyst stack for 2025:
• Mainnet live + privacy-first RWAs
• Phoenix 2.0 upgrade (lower fees, easier dev)
• MiCA-ready Dusk Pay & EURQ digital-euro launch
• 21X EU pilot regime RWA exchange p

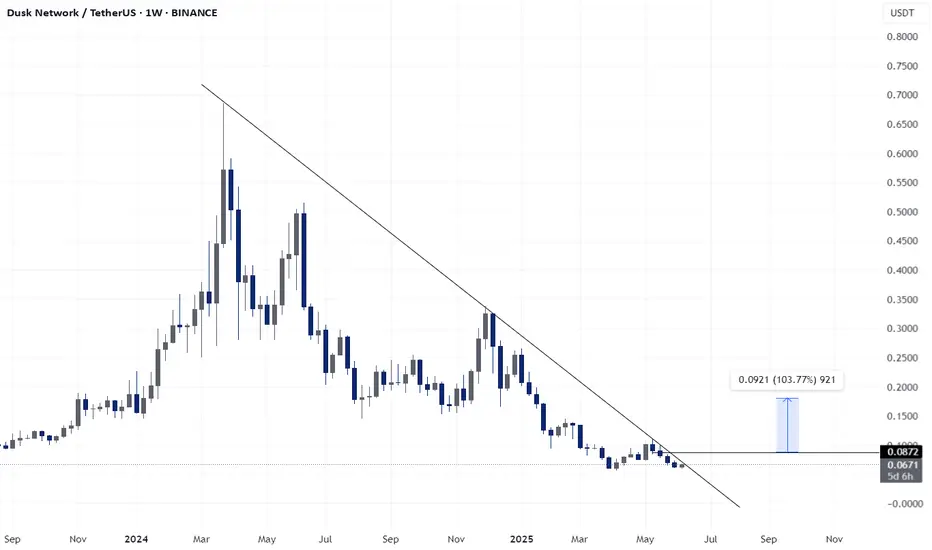
DUSK - LONG SET-UP 2x Target.BINANCE:DUSKUSDT
𝐃𝐔𝐒𝐊/𝐔𝐒𝐃𝐓
Dusk is breaking out of a long-term downtrend on the weekly chart. A potential move of +103.77% is projected, signaling a bullish reversal if the breakout holds
DUSK ShortLike & Follow me for more details
DUSK Short,
BTC will break upward trend soon.
Will reach 103k
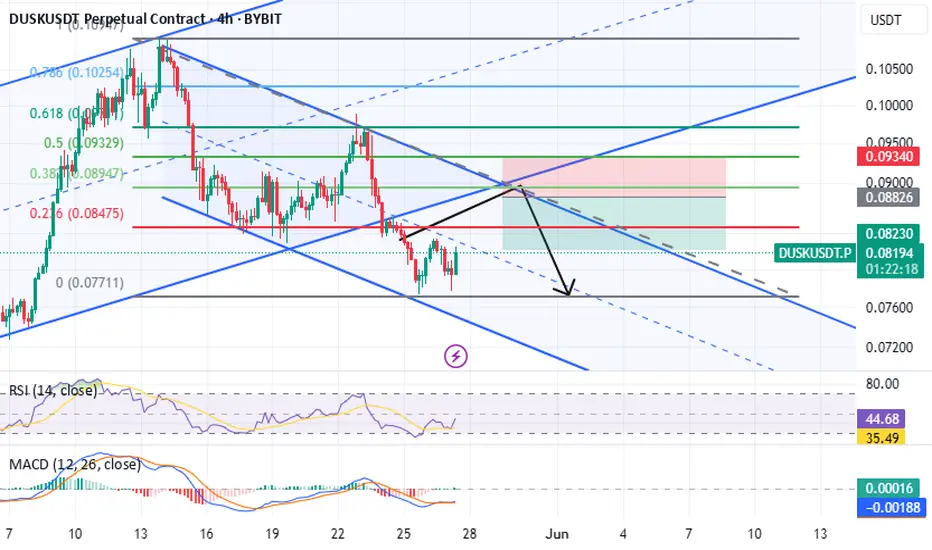
DUSKUSDT | Buyers Are Stepping In, But Not There YetI’ve had my eye on DUSKUSDT and this is the first serious resistance it’s facing. Buyers are becoming active , and that’s a good sign, but it’s not enough yet .
We need to see more strength, ideally a clean breakout above the red zone followed by a retest , before considering any long setups.

DUSKUSDTThis is a long-term analysis for the weekly time frame. Our guess is that the price will return from around 0.012 to 0.015 and even higher (completion of wave 4) and then complete its wave 5 at around 0.053 to 0.041.
If this happens, buying it spot is quite low-risk and we can even look at it for a
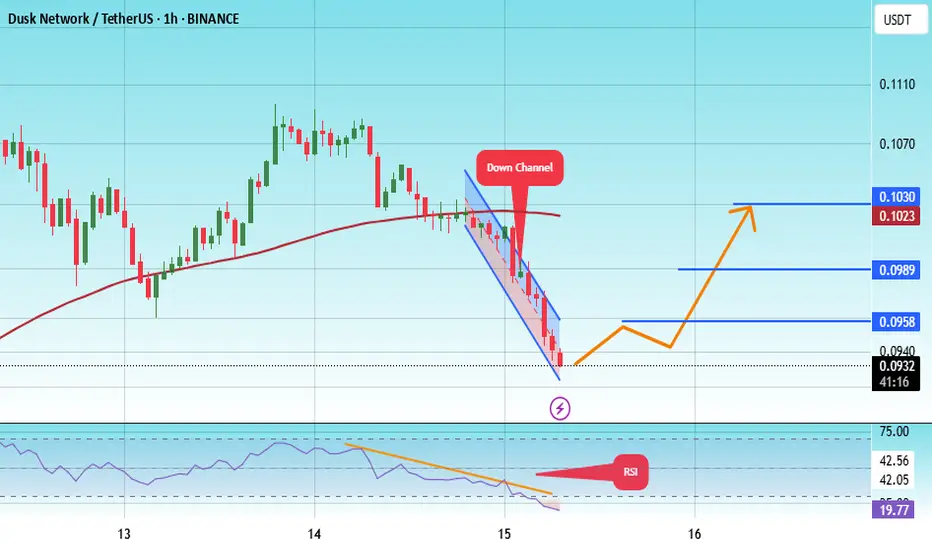
#DUSK/USDT#DUSK
The price is moving within a descending channel on the 1-hour frame, adhering well to it, and is heading for a strong breakout and retest.
We are seeing a bounce from the lower boundary of the descending channel, which is support at 0.0926.
We have a downtrend on the RSI indicator that is ab
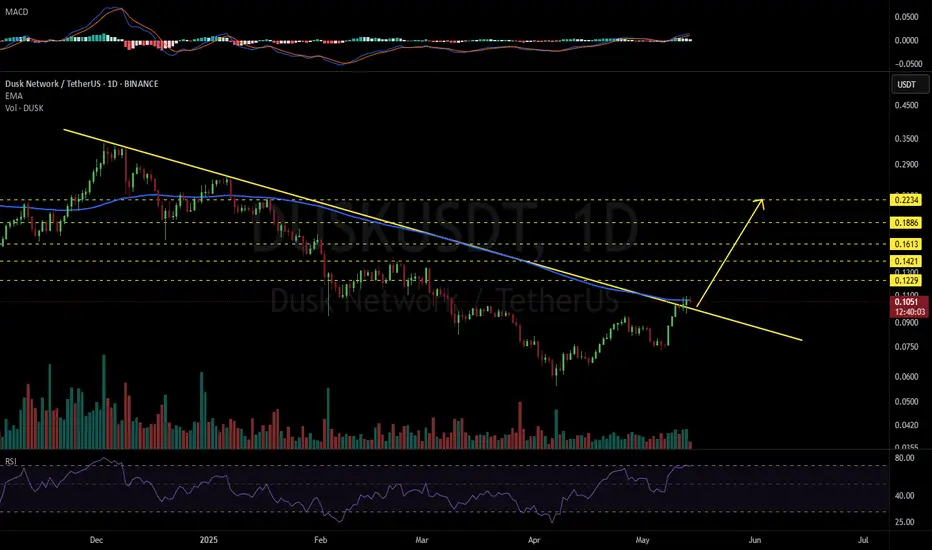
DUSKUSDT 1D#DUSK has broken above the descending resistance on the daily chart and is now facing the EMA100. In case of a successful retest of the trend line and breakout above the EMA100, the targets are:
🎯 $0.1229
🎯 $0.1421
🎯 $0.1613
🎯 $0.1886
🎯 $0.2234
⚠️ Use a tight stop-loss.
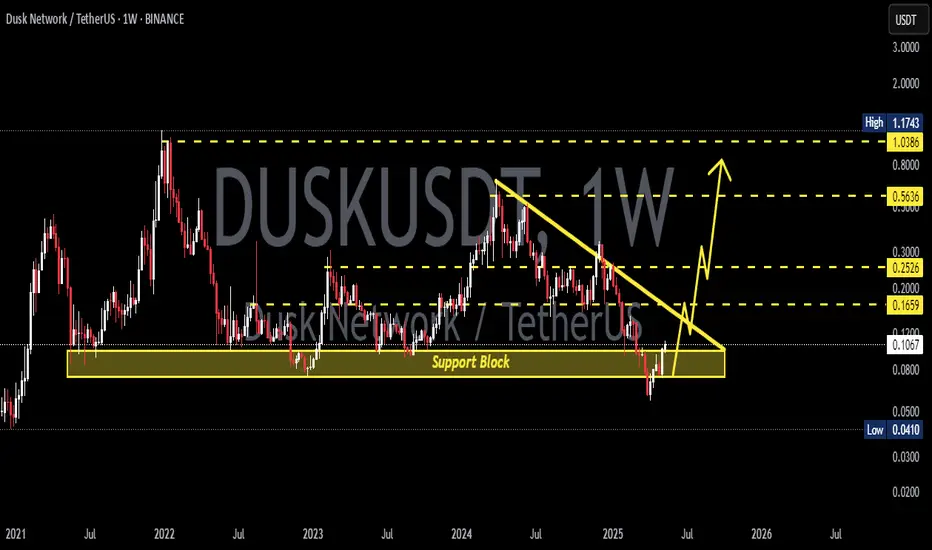
DUSKUSDT 1W Analysis DUSK ~ 1W Analysis
#DUSK Buy gradually from here if you still have confidence in this coin with a short term target of at least 20%+
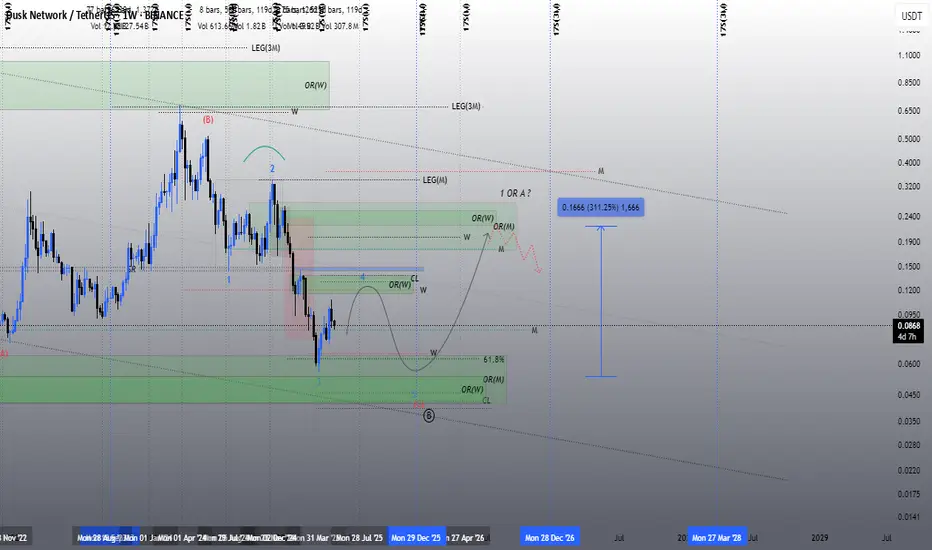
Dusk still not bottomed, but future is brightDusk has more down, up to -70% to 0.01$ (max pain)
but soon we are going to have a bottom in altcoins
and until Mid 2026, Dusk is going to go to a new All Time High
(time based fib was taken on weekly chart, before transforming the chart to daily)
**not financial advice, just newbie charting**

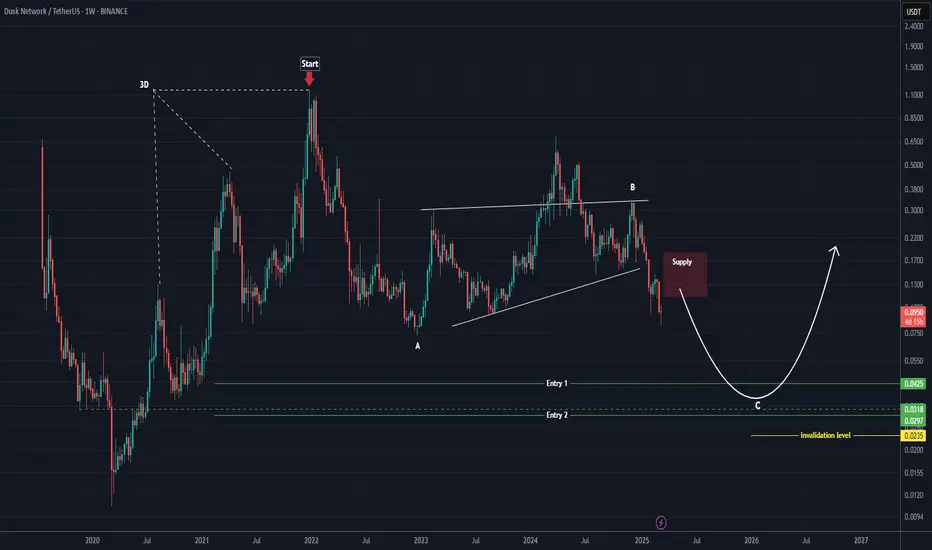
DUSK ANALYSIS (1W)It seems that after forming the 3D structure, the price has entered a corrective ABC pattern or a more complex one.
It appears that wave B has now ended, and the price has entered wave C.
Wave C has a long correction ahead in terms of time, and in terms of price, the best area for the end of wave
See all ideas
Summarizing what the indicators are suggesting.
Oscillators
Neutral
SellBuy
Strong sellStrong buy
Strong sellSellNeutralBuyStrong buy
Oscillators
Neutral
SellBuy
Strong sellStrong buy
Strong sellSellNeutralBuyStrong buy
Summary
Neutral
SellBuy
Strong sellStrong buy
Strong sellSellNeutralBuyStrong buy
Summary
Neutral
SellBuy
Strong sellStrong buy
Strong sellSellNeutralBuyStrong buy
Summary
Neutral
SellBuy
Strong sellStrong buy
Strong sellSellNeutralBuyStrong buy
Moving Averages
Neutral
SellBuy
Strong sellStrong buy
Strong sellSellNeutralBuyStrong buy
Moving Averages
Neutral
SellBuy
Strong sellStrong buy
Strong sellSellNeutralBuyStrong buy
Displays a symbol's price movements over previous years to identify recurring trends.