What if...What if instead of a 6-12 months long bull market instead we see a 2-3 years long bull market? What if...
Instead of one big extended bullish wave we see slow and steady growth long-term, with no more huge crashes as the market evolves. This already happened in the past leading to the 2017 cycle to
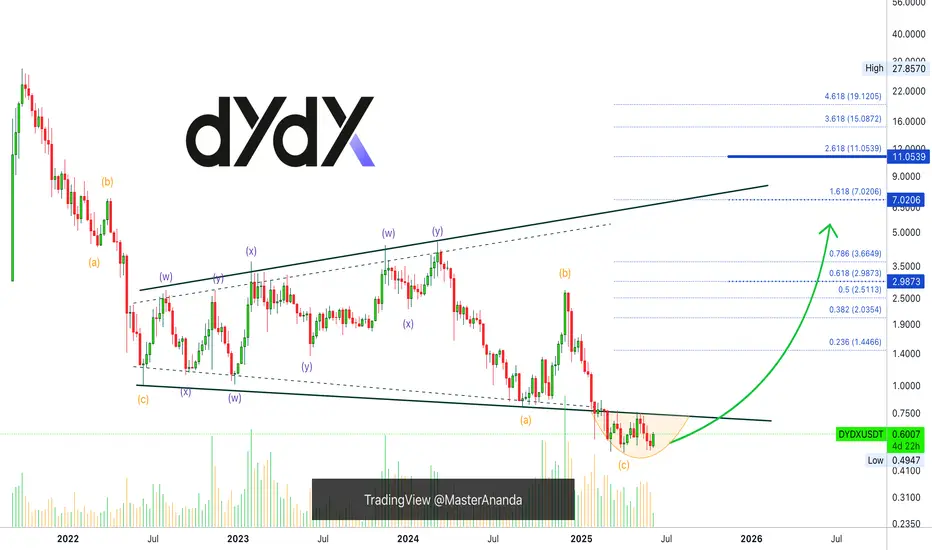

dydx sell midterm "🌟 Welcome to Golden Candle! 🌟
We're a team of 📈 passionate traders 📉 who love sharing our 🔍 technical analysis insights 🔎 with the TradingView community. 🌎
Our goal is to provide 💡 valuable perspectives 💡 on market trends and patterns, but 🚫 please note that our analyses are not intended as buy o

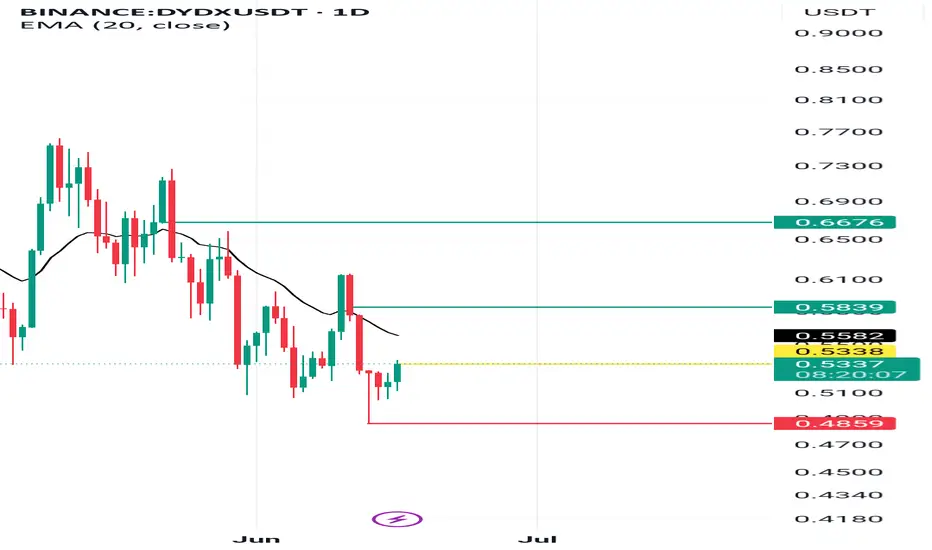
DYDXUSDT 1D AnalysisDYDX ~ 1D Analysis
#DYDX Buy gradually from here with a short term target of at least 15%+.
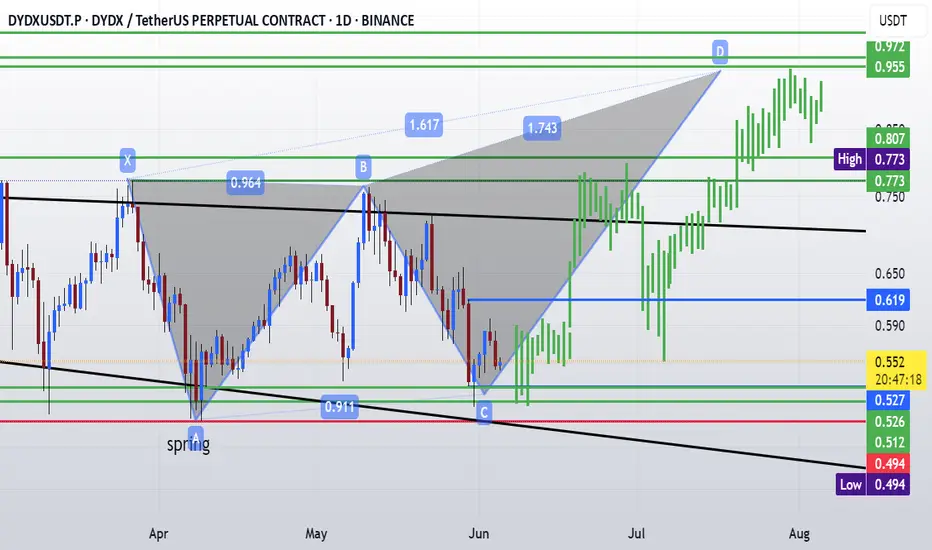
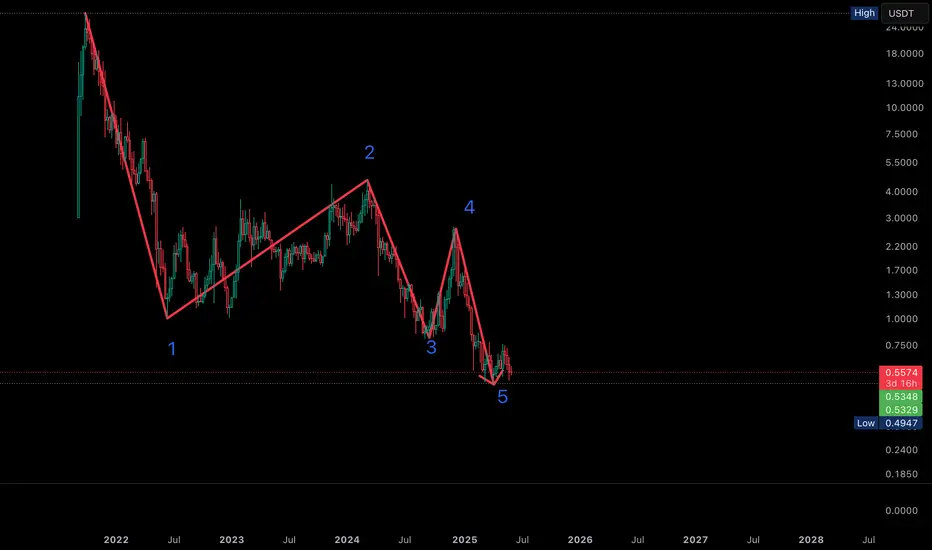
dydxusdtdydx usdt may be in the formation of deep crab .it seem ithas completed accumulation phase . never trad ewithout a sl .
DYDX LOOKS LOOOOOOOOONGAccording waves analysis the most high volume dex exchange token looks crazy for long I’m in 🤑🤑🤑🤑🤑🤑
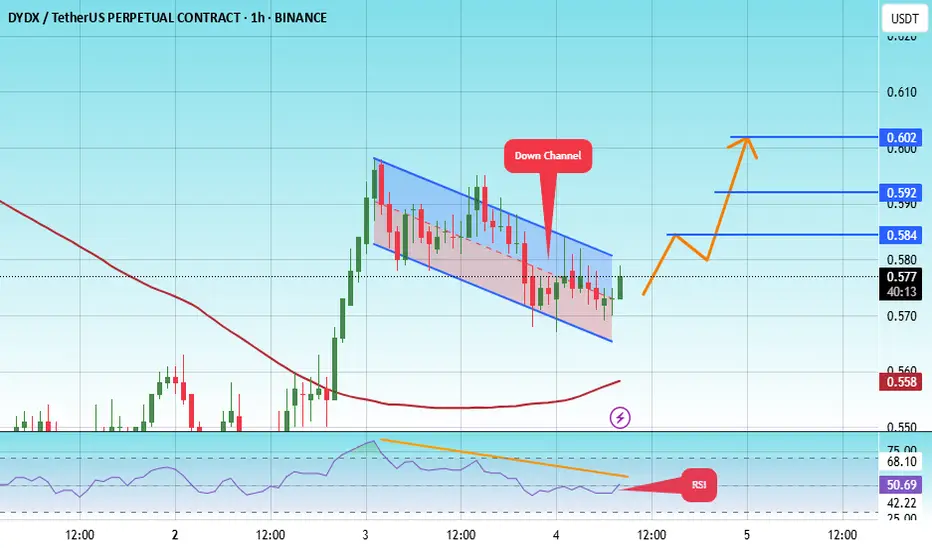
#DYDX/USDT#DYDX
The price is moving within a descending channel on the 1-hour frame, adhering well to it, and is heading towards a strong breakout and retest.
We are experiencing a rebound from the lower boundary of the descending channel. This support is at 0.566
We are experiencing a downtrend on the RSI
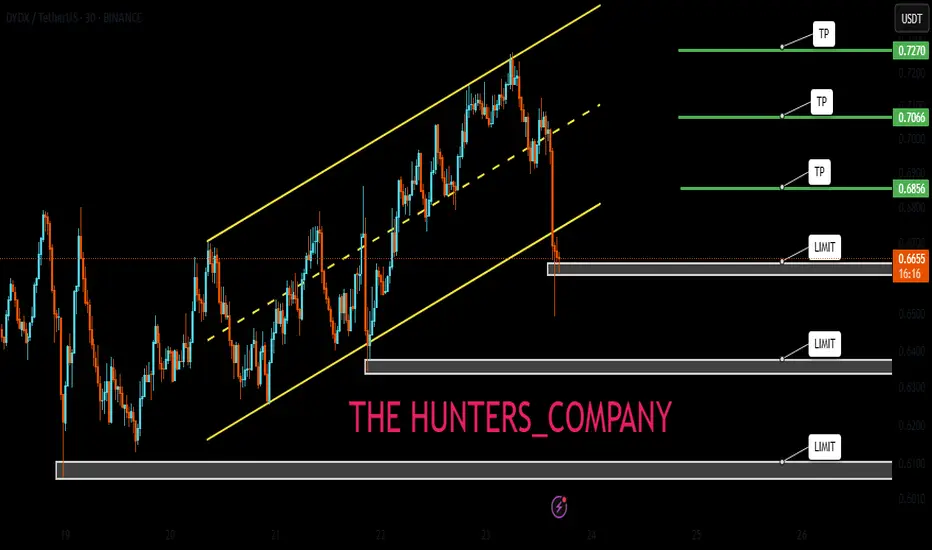
Free signal todayHello friends
Given the good growth, now the price is correcting and we can buy within the support ranges with capital and risk management and move with it to the specified targets.
*Trade safely with us*
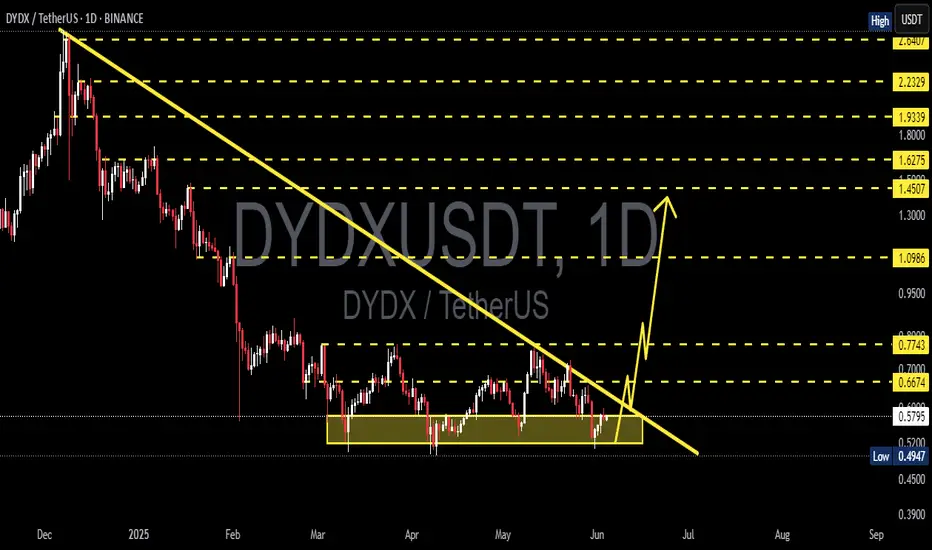
DYDX ANALYSIS📊 #DYDX Analysis
✅There is a formation of Falling Wedge Pattern on daily chart and currently trading around its support zone🧐
Pattern signals potential bullish movement incoming after the confirmation of retest
👀Current Price: $0.6344
🚀 Target Price: $0.7580
⚡️What to do ?
👀Keep an eye on #

See all ideas
Summarizing what the indicators are suggesting.
Oscillators
Neutral
SellBuy
Strong sellStrong buy
Strong sellSellNeutralBuyStrong buy
Oscillators
Neutral
SellBuy
Strong sellStrong buy
Strong sellSellNeutralBuyStrong buy
Summary
Neutral
SellBuy
Strong sellStrong buy
Strong sellSellNeutralBuyStrong buy
Summary
Neutral
SellBuy
Strong sellStrong buy
Strong sellSellNeutralBuyStrong buy
Summary
Neutral
SellBuy
Strong sellStrong buy
Strong sellSellNeutralBuyStrong buy
Moving Averages
Neutral
SellBuy
Strong sellStrong buy
Strong sellSellNeutralBuyStrong buy
Moving Averages
Neutral
SellBuy
Strong sellStrong buy
Strong sellSellNeutralBuyStrong buy
Displays a symbol's price movements over previous years to identify recurring trends.