DYDXUSDT.P trade ideas
#DyDx Superb opportunity#DYDX
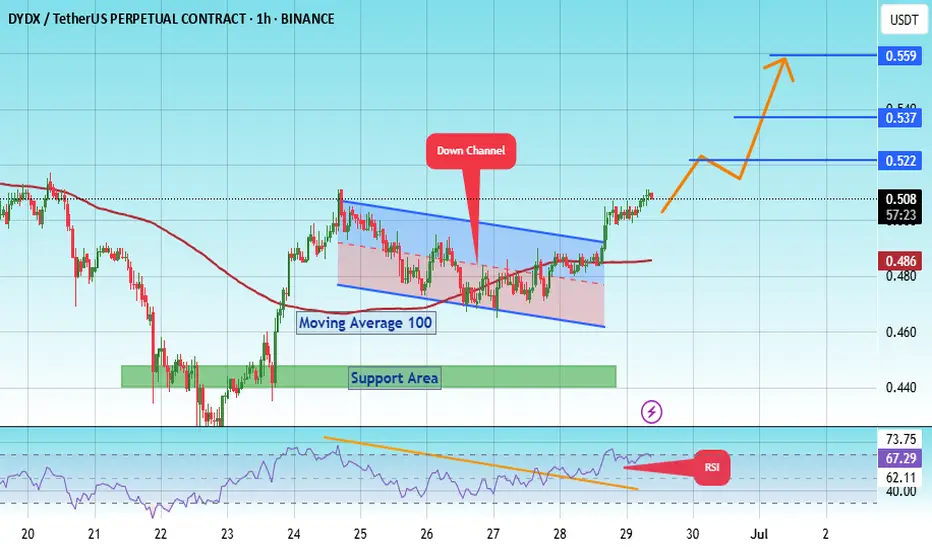
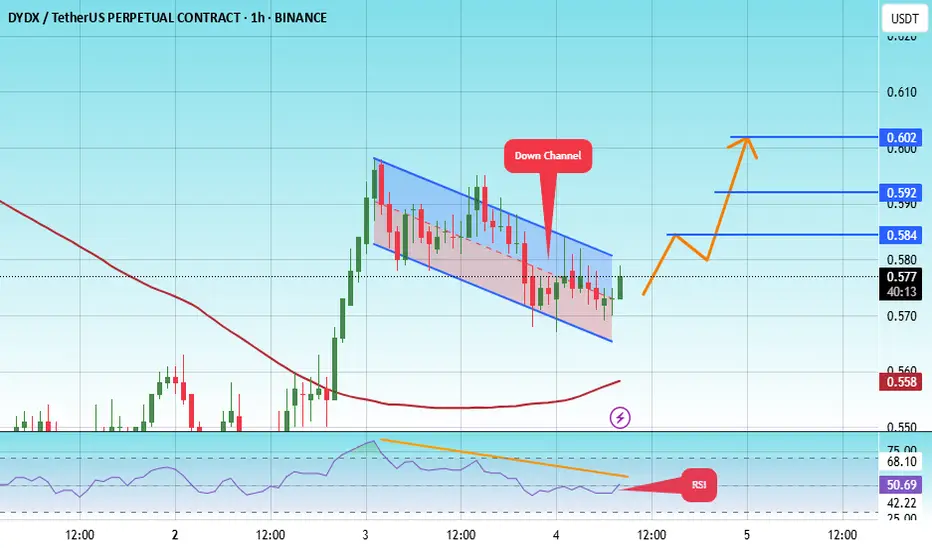
The price is moving within a descending channel on the 1-hour frame, adhering well to it, and is on its way to breaking it strongly upwards and retesting it.
We have a bounce from the lower boundary of the descending channel. This support is at 0.470.
We have a downtrend on the RSI indicator that is about to be broken and retested, supporting the upside.
There is a major support area in green at 0.445, which represents a strong basis for the upside.
Don't forget a simple thing: ease and capital.
When you reach the first target, save some money and then change your stop-loss order to an entry order.
For inquiries, please leave a comment.
We have a trend to hold above the 100 Moving Average.
Entry price: 0.500.
First target: 0.522.
Second target: 0.537.
Third target: 0.559.
Don't forget a simple thing: ease and capital.
When you reach your first target, save some money and then change your stop-loss order to an entry order.
For inquiries, please leave a comment.
Thank you.

What if...What if instead of a 6-12 months long bull market instead we see a 2-3 years long bull market? What if...
Instead of one big extended bullish wave we see slow and steady growth long-term, with no more huge crashes as the market evolves. This already happened in the past leading to the 2017 cycle top. The market grew in 2015, 2016, 2017...
Here we have DYDX producing lower lows. Maybe supply is expanding, maybe something with the way the token works, I don't know, the chart is showing lower lows, but this is still a transition period, other charts are producing higher highs and higher lows.
The recent drop below the lower trendline is called an "excess," a market excess and this type of move tends to be corrected almost right away. The action will move back above the trendline and then produce strong growth.
What if instead of a super fast and strong bull market we get a long-term drawn out one. The latter scenario would be the best. What if... I am open to seeing it happen, what about you?
Thank you for reading.
Namaste.
dydx sell midterm "🌟 Welcome to Golden Candle! 🌟
We're a team of 📈 passionate traders 📉 who love sharing our 🔍 technical analysis insights 🔎 with the TradingView community. 🌎
Our goal is to provide 💡 valuable perspectives 💡 on market trends and patterns, but 🚫 please note that our analyses are not intended as buy or sell recommendations. 🚫
Instead, they reflect our own 💭 personal attitudes and thoughts. 💭
Follow along and 📚 learn 📚 from our analyses! 📊💡"

DYDX LOOKS LOOOOOOOOONGAccording waves analysis the most high volume dex exchange token looks crazy for long I’m in 🤑🤑🤑🤑🤑🤑
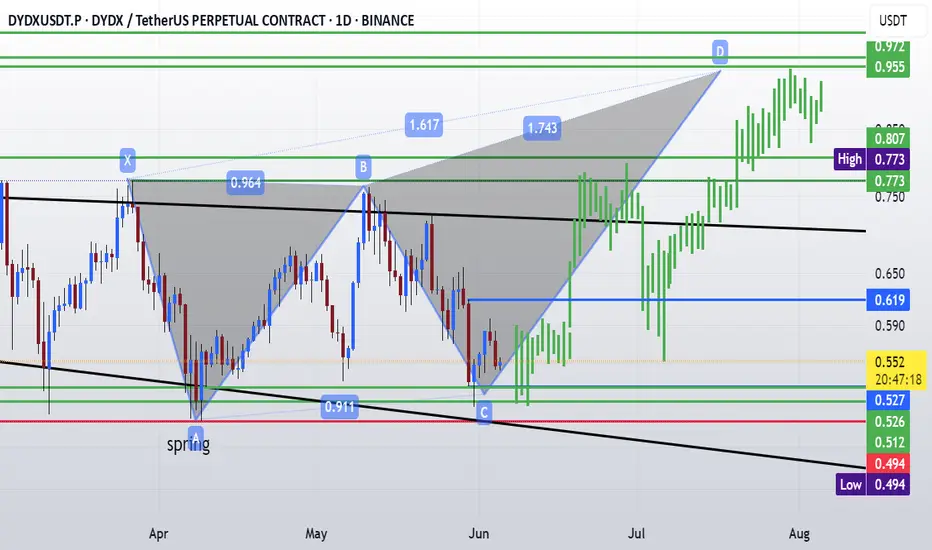
dydxusdtdydx usdt may be in the formation of deep crab .it seem ithas completed accumulation phase . never trad ewithout a sl .
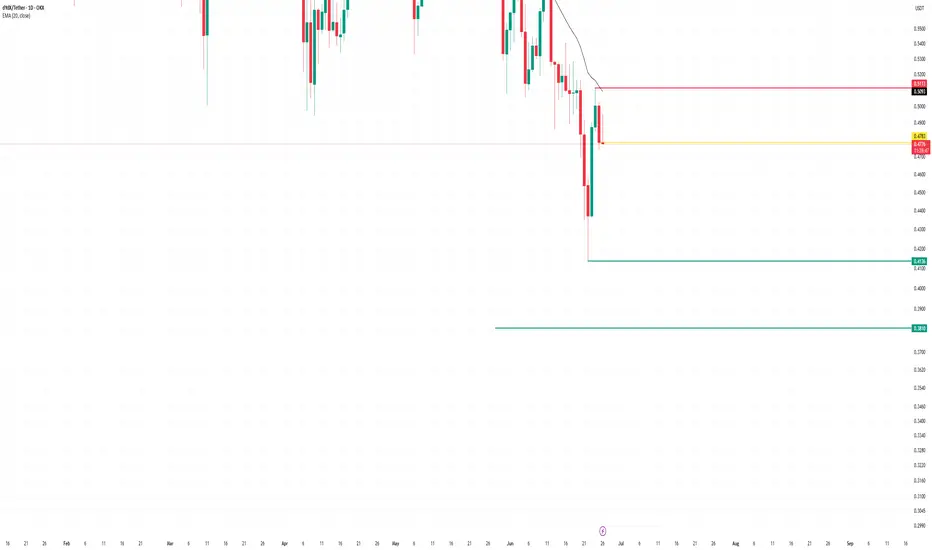
#DYDX/USDT#DYDX
The price is moving within a descending channel on the 1-hour frame, adhering well to it, and is heading towards a strong breakout and retest.
We are experiencing a rebound from the lower boundary of the descending channel. This support is at 0.566
We are experiencing a downtrend on the RSI indicator, which is about to break and retest, supporting the upward trend.
We are heading towards stability above the 100 moving average.
Entry price: 0.575
First target: 0.584
Second target: 0.592
Third target: 0.602
DYDXUSDT 1D AnalysisDYDX ~ 1D Analysis
#DYDX Buy gradually from here with a short term target of at least 15%+.
Free signal todayHello friends
Given the good growth, now the price is correcting and we can buy within the support ranges with capital and risk management and move with it to the specified targets.
*Trade safely with us*
DYDX ANALYSIS📊 #DYDX Analysis
✅There is a formation of Falling Wedge Pattern on daily chart and currently trading around its support zone🧐
Pattern signals potential bullish movement incoming after the confirmation of retest
👀Current Price: $0.6344
🚀 Target Price: $0.7580
⚡️What to do ?
👀Keep an eye on #DYDX price action and volume. We can trade according to the chart and make some profits⚡️⚡️
#DYDX #Cryptocurrency #TechnicalAnalysis #DYOR

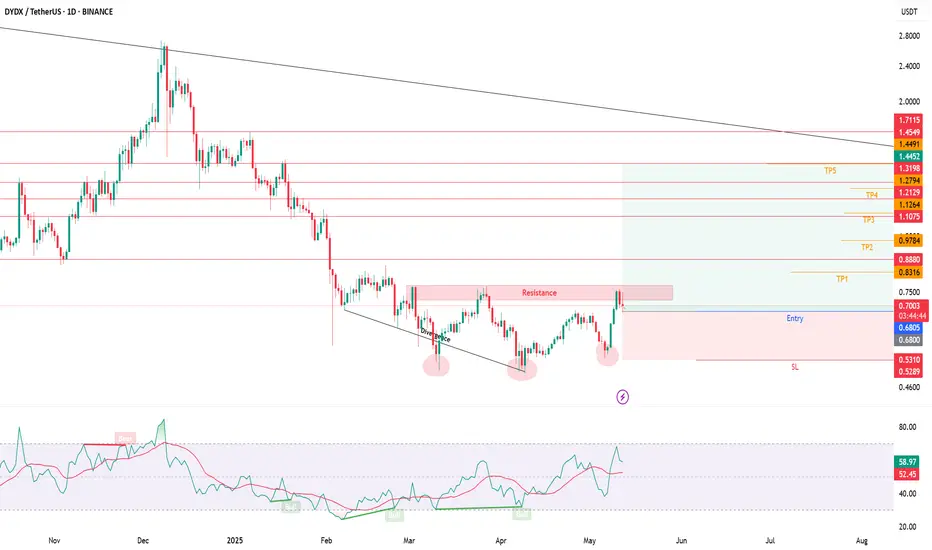
Dydx bullish Divergence Daily Time FrameFalling Wedge - Bullish Reversal
Bullish Divergence
Pull from falling wedge.

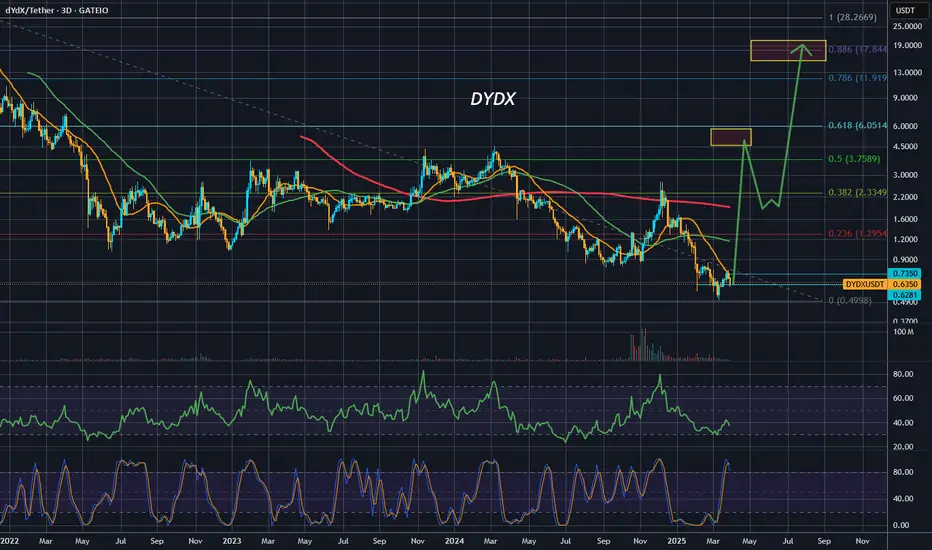
DyDx is reversing. Superb opportunityDyDx chart is looking good.
On 3D timeframe StochRSI is high - good momentum is building up
RSI started to make higher low
Price is testing 21MA and should break it soon
Also bullish divergence on RSI
1st impulse could be to 4-6$ region with huge correction afterwards.
Later in summer probably will see rise to 17$+
DYDX has shown bullish DivergenceDyDx has shown bullish Divergence on the daily timeframe.
DyDX is the L1 token for the dYdX Chain.
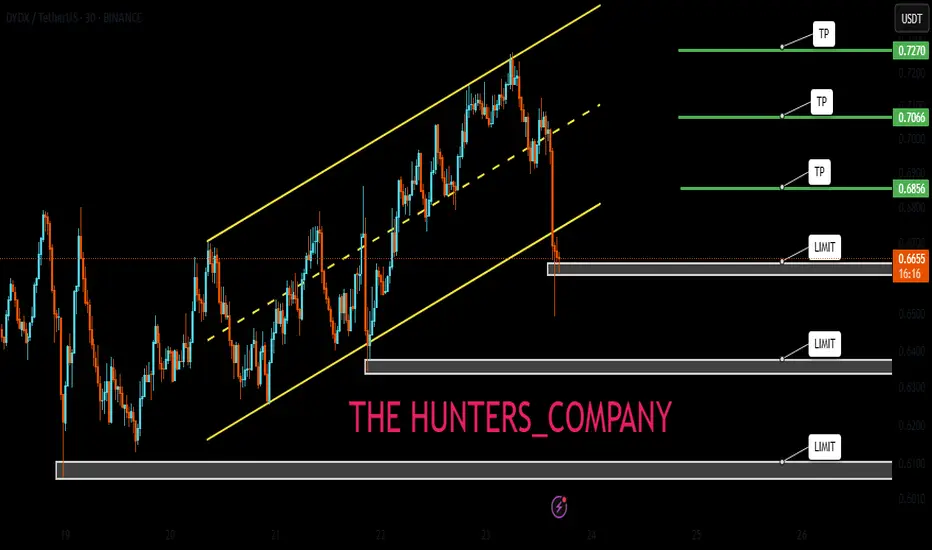
#DYDX#DYDX
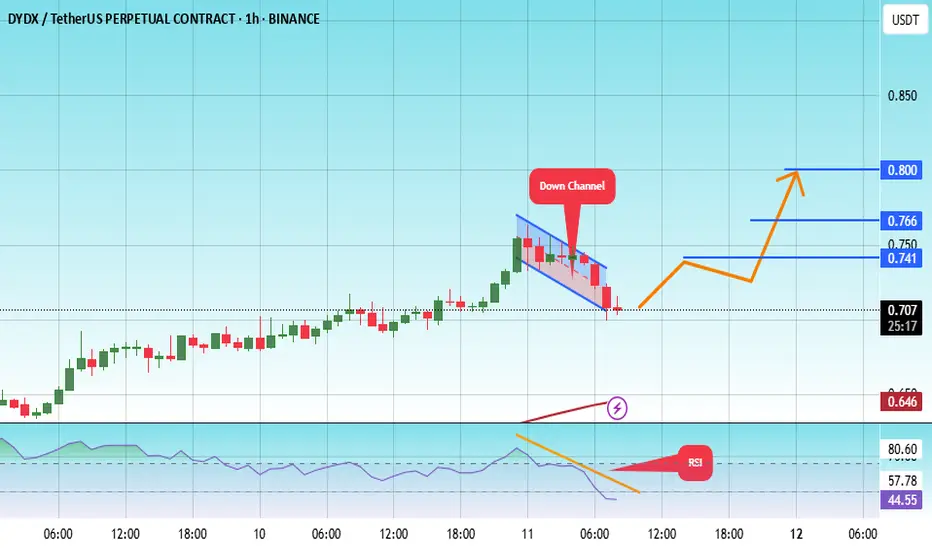
The price is moving within a descending channel on the 1-hour frame, adhering well to it, and is heading for a strong breakout and retest.
We are seeing a bounce from the lower boundary of the descending channel, which is support at 0.
We have a downtrend on the RSI indicator that is about to break and retest, supporting the upside.
We are looking for stability above the 100 moving average.
Entry price: 0.706
First target: 0.741
Second target: 0.766
Third target: 0.800
dydx sell midterm"🌟 Welcome to Golden Candle! 🌟
We're a team of 📈 passionate traders 📉 who love sharing our 🔍 technical analysis insights 🔎 with the TradingView community. 🌎
Our goal is to provide 💡 valuable perspectives 💡 on market trends and patterns, but 🚫 please note that our analyses are not intended as buy or sell recommendations. 🚫
Instead, they reflect our own 💭 personal attitudes and thoughts. 💭
Follow along and 📚 learn 📚 from our analyses! 📊💡"

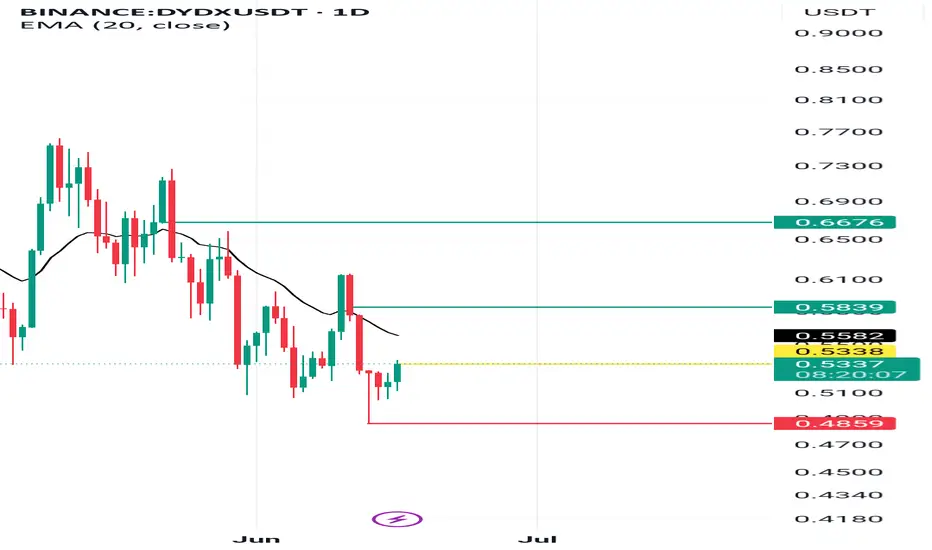
#DYDX/USDT#DYDX
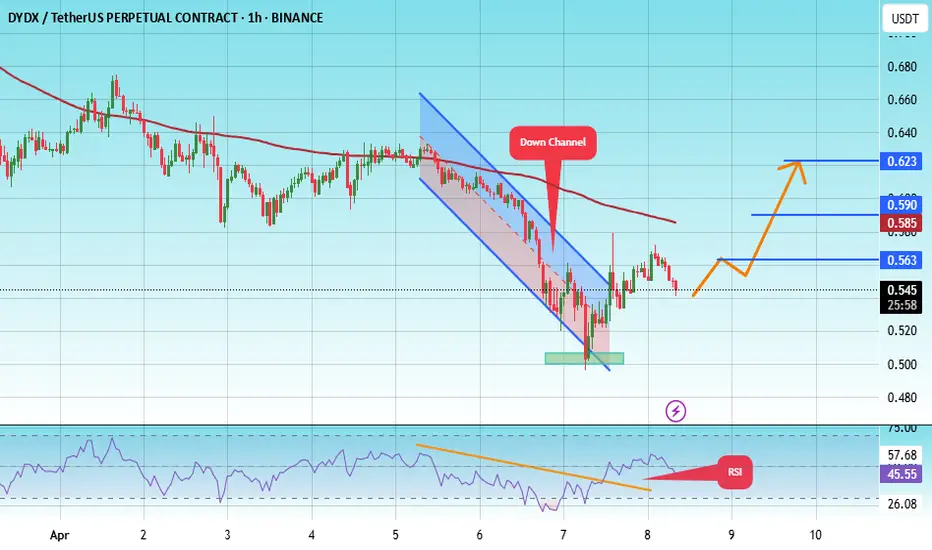
The price is moving within a descending channel on the 1-hour frame, adhering well to it, and is on its way to breaking it strongly upwards and retesting it.
We are seeing a bounce from the lower boundary of the descending channel, which is support at 0.5000.
We have a downtrend on the RSI indicator that is about to break and retest, supporting the upward trend.
We are looking for stability above the 100 moving average.
Entry price: 0.543
First target: 0.563
Second target: 0.590
Third target: 0.623
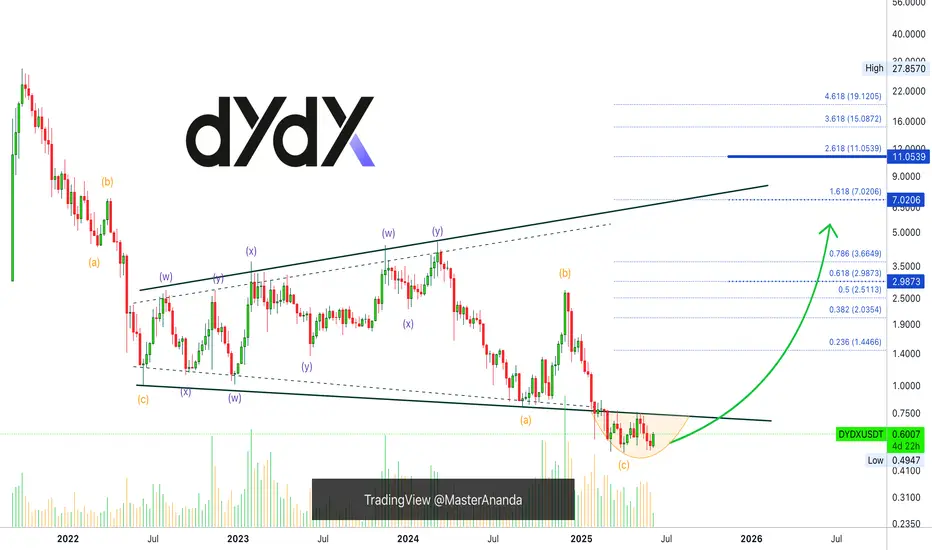
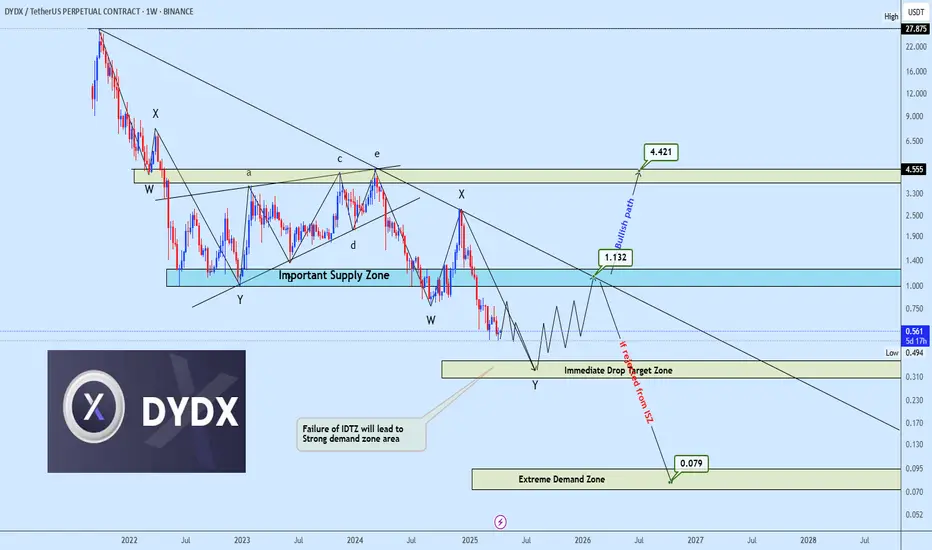
DYDX Approaching Make-or-Break Pivot for Major ReversalThe DYDX/USDT weekly chart outlines a complex corrective WXY structure with price currently approaching the Immediate Drop Target Zone (IDTZ) near $0.50. A failure here could lead to a drop toward the Extreme Demand Zone around $0.079. However, reclaiming $1.132 and breaking above the descending trendline could trigger a bullish reversal toward the Important Supply Zone ($4.42–$4.55).
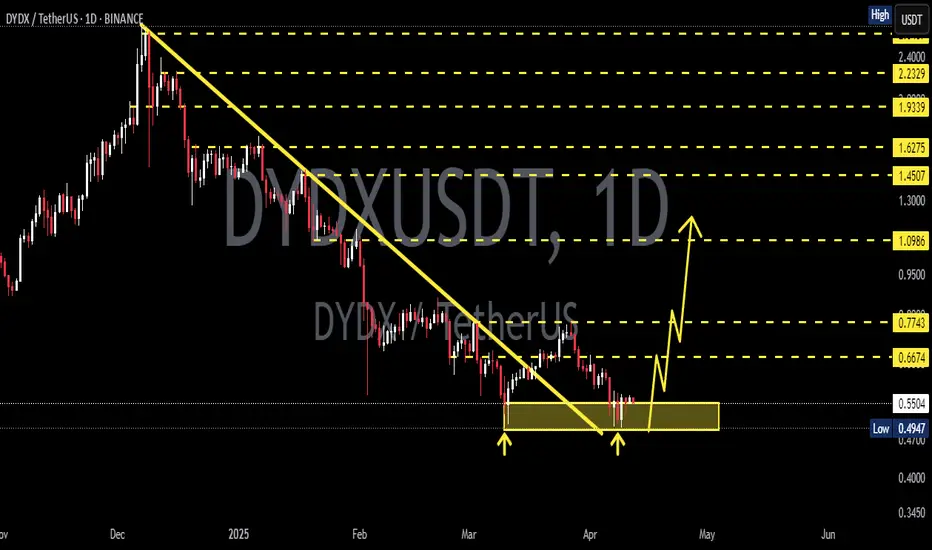
DYDXUSDT 1DDYDX ~ 1D Analysis
#DYDX If this is valid. This will be a double bottom. Buy gradually from here with a short -term target of at least 15%+.
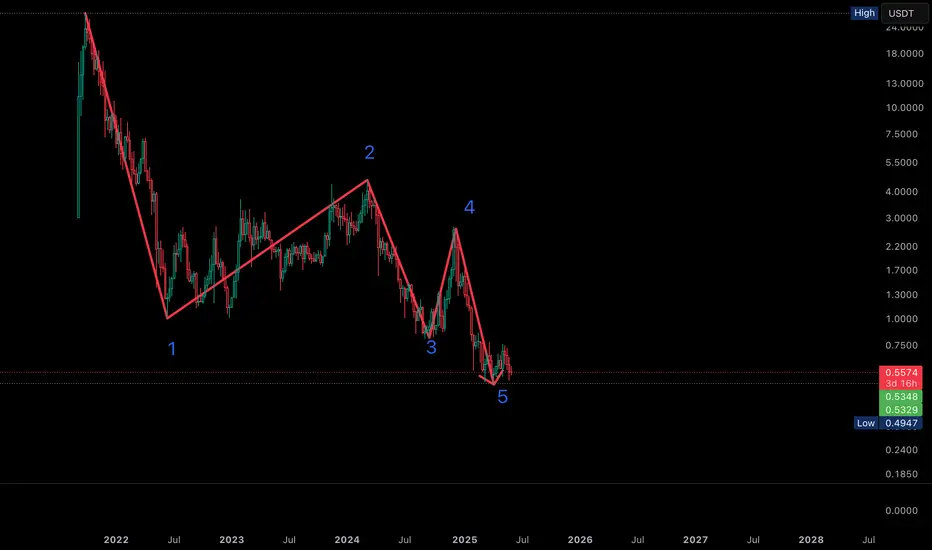
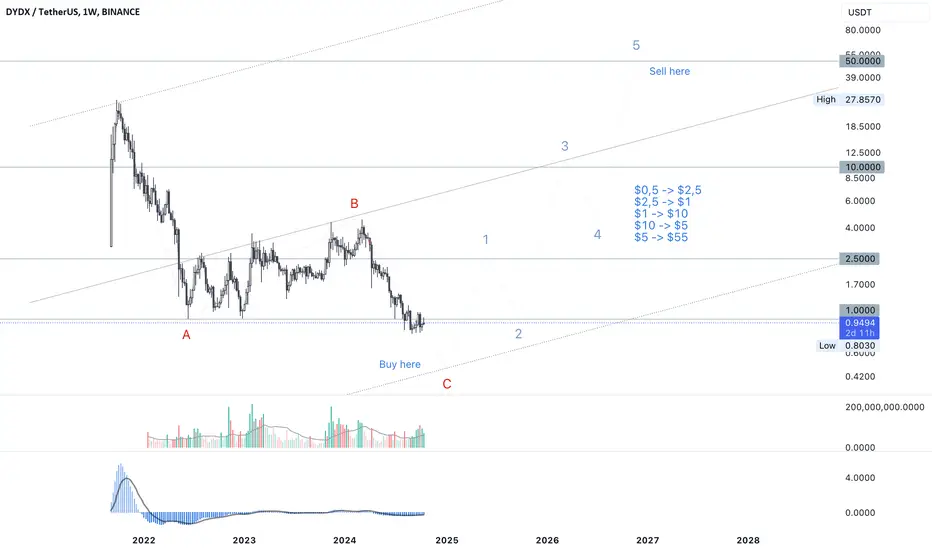
DYDX USDT – 100x soon Yes, it is dull to make predictions, so I will make one.
DYDX USDT
First the last drop of the cycle -50%
Then moon
Something like this
Start $0,5 -> $2,5
Reversal $2,5 -> $1
Extension $1 -> $10
Reversal $10 -> $5
End $5 -> $55
This post is for entertainment only.
The information provided here is for general informational purposes only and does not constitute financial, investment, or other professional advice. Always seek the guidance of a qualified financial advisor before making any financial decisions. Past performance does not guarantee future results, and any investment involves risks. We are not responsible for any actions taken based on this information."
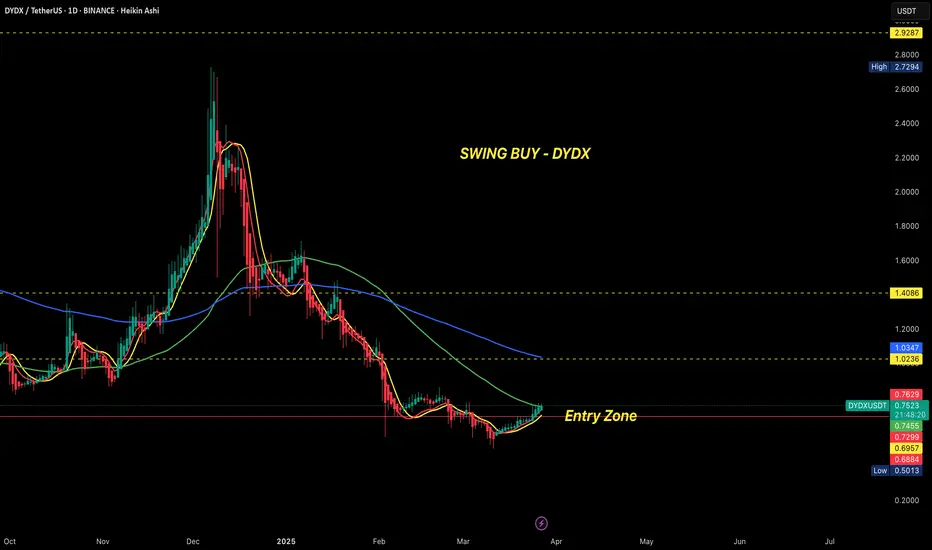
SWING BUY DYDX - 2025SWING BUY DYDX - 2025
Today, we’ve got a spot buy signal:
Signal: DYDX
Entry: Around $0.7
Targets: $1.2 - $1.4 - $2.9
Style: Swing Buy or Scalping—works with either strategy.
Good luck out there!
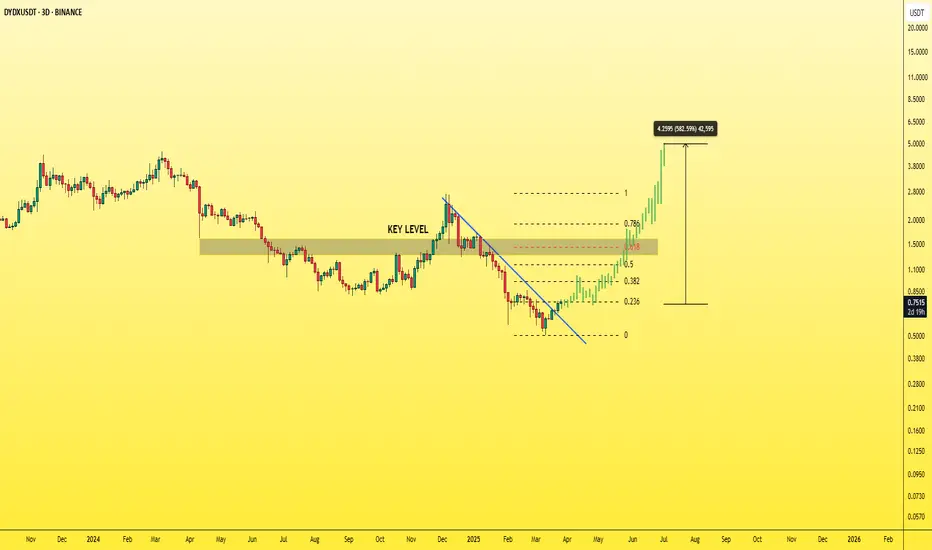
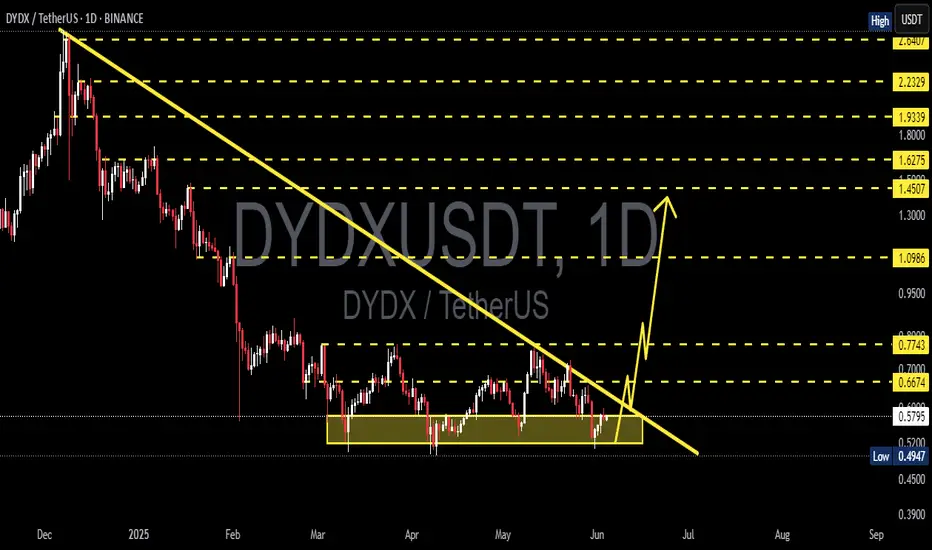
DYDXUSDT - a real oppurtunity!the coin is currently in a deep bottom compared to its December peak, having dropped over 80%.
Buying now is a rare opportunity that may not come again in the future.
On the 3-day chart there is a nicly breakout of a 4 months downtrend ...
the most important resistance is at the key level—once it breaks, the price will pump insanely.
best regards Ceciliones🎯