DYDX - Make or breakI've been suggesting further upside on BYBIT:DYDXUSDT.P and for alts in general for a long time, but dydx has been one of assets I traded best, feel free to check the charts below for how HTF ideas played out since march/january.
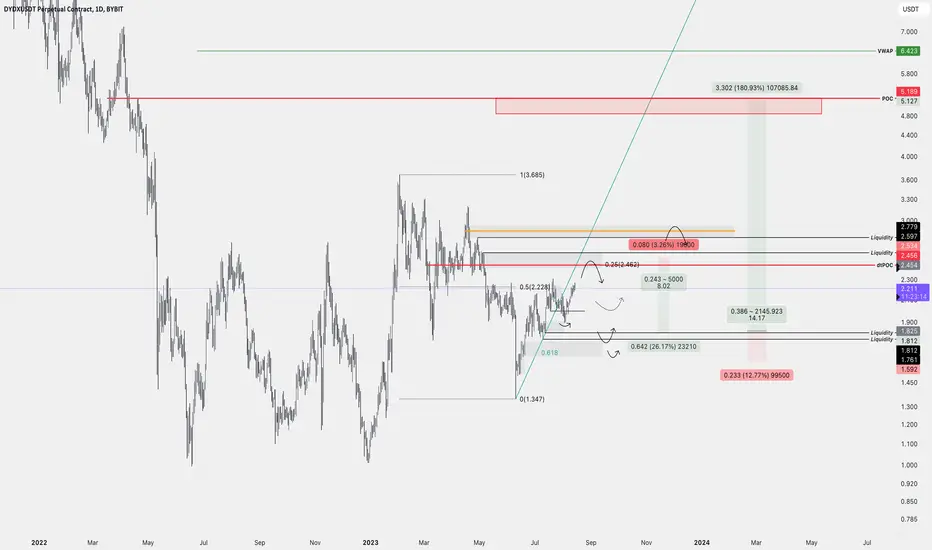
At the moment it's approaching to a big resistance area I highlighted before and already looks like a deviation of the range (at least at the time of this analysis) even before clearing some of those OBs. It still makes more sense to me for another push up into 2.59-2.78 before a 20-30% pullback. Unlike almost every market participant right now, some charts (including dydx) makes me think it may not be a good idea to buy those pullbacks - but the analysis has been spot on so far, so if it looks ready for a bounce, I'll take that long.
DYDXUSDT.P trade ideas

DYDX - PrimaryOk, we nailed the bottom for BYBIT:DYDXUSDT.P with the HTF idea.
I'll add my EW counts as a comment to keep the chart as clean as I can. PA wise, my main idea is to go a bit higher, pullback, then run towards 5$.
Disclaimer: The setups given aren't the way i'll play it. I don't like using stops in areas like this where I'm confident we'll reverse eventually. I scale in slowly until a break of structure on LTF (so that I don't have a liquidation level).
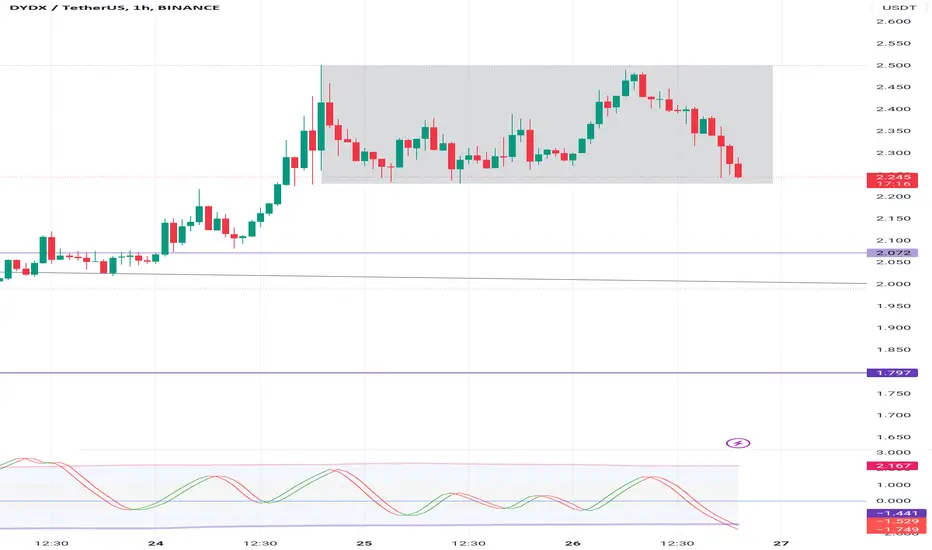
DYDXDYDX rectangle box range
Clear enough for trading, right?
It's not a financial advise
Always DYOR
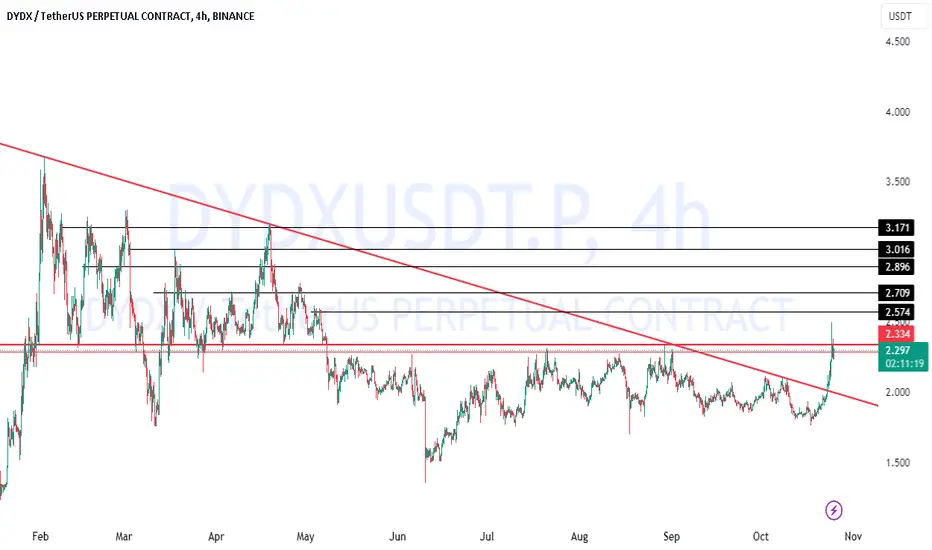
DYDX Facing major resistanceDYDX UPDATE: DYDX doing good move so far on 4hrs TF but currently facing 4hrs TF major and if DYDX can flip 2.334 to support will actually trigger good move and the target to consider taking profit are indicated on the chart…. Keep your eyes on it......
Follow for more market update
DYDX is bullishHi, dear traders. how are you ? Today we have a viewpoint to BUY/LONG the DYDX symbol.
For risk management, please don't forget stop loss and capital management
When we reach the first target, save some profit and then change the stop to entry
Comment if you have any questions
Thank You
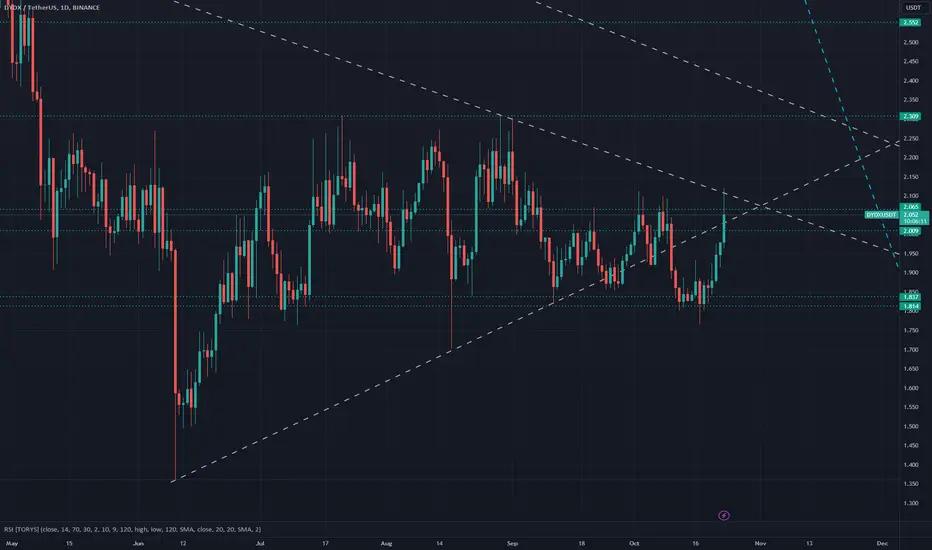
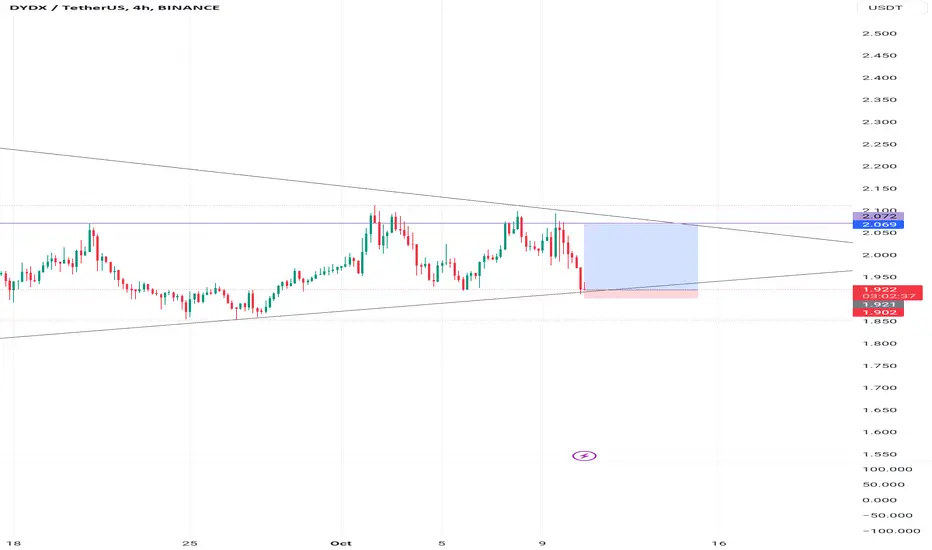
DYDX/USDT Data Check from Oct/23 - Nov/01Overall, DYDX is tryinng to break through its nearest resistance at 2.09x to 2.11x zone and seems succesfully retest at 2.04x zone. If nothing changes it we move forward when its have enough momentum. On week TF its still in bearish channel. So the best thing I am looking forward is DYDX will fake out at this time and continue to keep it bearish.
On h4 TF, its successfully brak the channel and moving to retest nearest resistance zone. So it can be keep increase in about 2 -> 4 days! one thing to make me doubt about this is this is totally matched to BTC data, he will reveal his true trend on about 3 -> 8 days and the I am significantly feeling that it can be crushing down any time when reach to 31k8xx zone. So stay focus and careful with your long positions. I was pre-warning about this alt wave and keep watching the market on next 3 -> 8 days.
stay safe and stay gold!
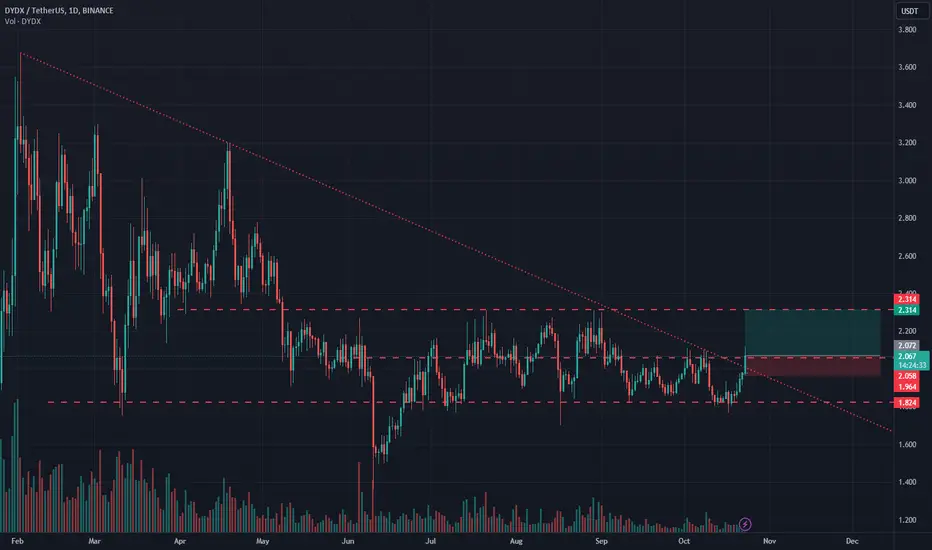
long DYDXCRYPTOCAP:DYDX broke through the resistance level and the major descending trendline. Bullish movement to resistance level at $2.31 is expected to happen.
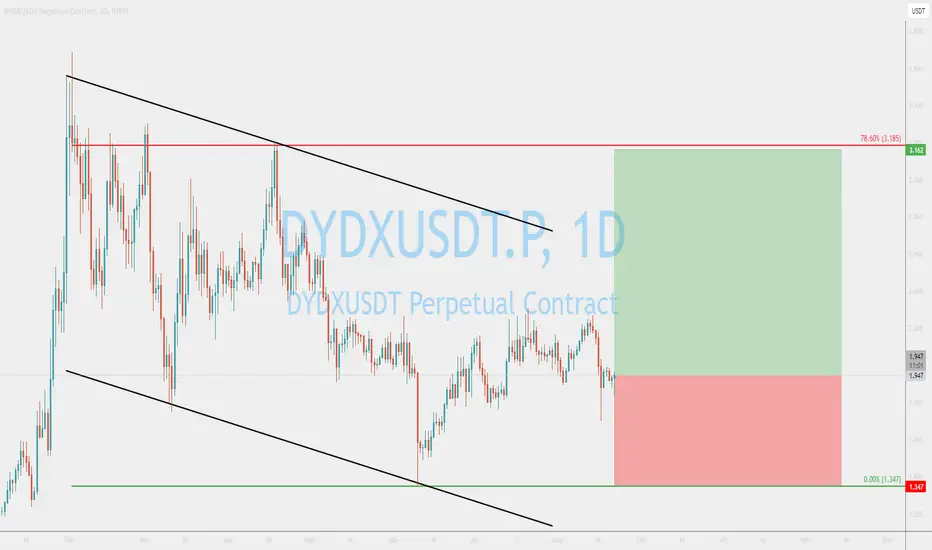
DYDXUSDT buying nowDYDX found support at the bottom of the descending channel. We are going long, and aiming for the supply zone, which goes inline with the 78.6% Fibonacci resistance.
DydxSome alts are flying
Some are lagging
This ones lagging...
25% to old range high and support zone from dex perp hypewave earlier this year
Still the highest volume dex perp on eth I think so its a blue chip
DYDX UPDATE (1D)
In the previous analysis, we identified a red area in the upper part of the chart.
Due to the fact that the price did not reject strongly towards the lower side, it seems that it will climb up to the upper red zone and then reject towards the lower targets.

Dydx main targetsBINANCE:DYDXUSDT
Visualisation for DYDX potential targets before or after unlocks in December
Possible Targets and explanation idea
➡️Over 500 days in -0.27 accumulation zone.
➡️Based on ADZ indicator whales mostly accumulated in red zone
➡️Only 1 M gap will be like a trigger for algorithm deliver the price to this target
➡️Before 15% unlocks in December we can see hype around DYDX chain
➡️Testnet will end soon and its will be also trigger for uptrend
➡️2B market cap with current supply more than real, 17$ main target
Hope you enjoyed the content I created, You can support with your likes and comments this idea so more people can watch!
✅Disclaimer: Please be aware of the risks involved in trading. This idea was made for educational purposes only not for financial Investment Purposes.
---
• Look at my ideas about interesting altcoins in the related section down below ↓
• For more ideas please hit "Like" and "Follow"!

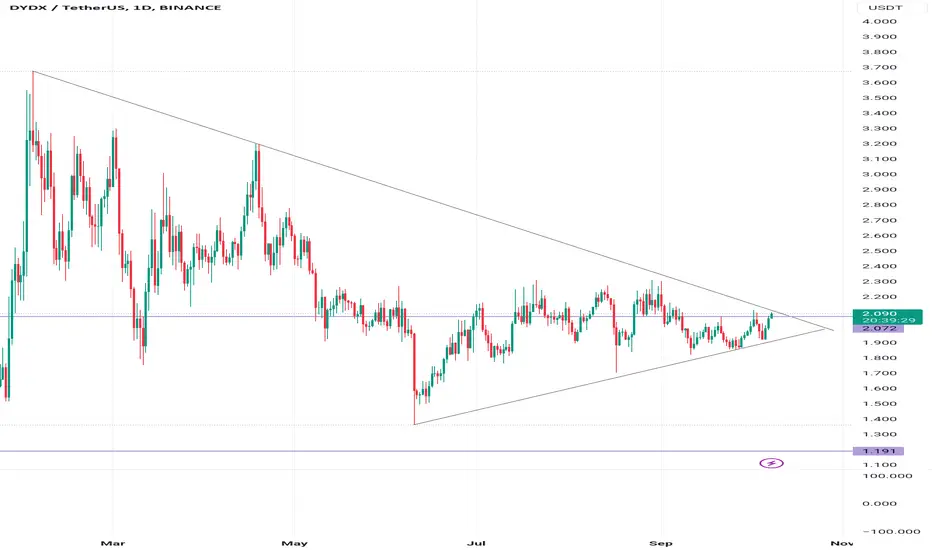
DYDXWatch DYDX chart
Playing more inside the triangle or breaking up/down it
It's not a financial advise
Always DYOR
DYDXUSDT IdeaBINANCE:DYDXUSDT
⚠️ Disclaimer: The following insights reflect my personal perspective on the market, relying on publicly available information and historical data. While some opinions stem from my actual trades, others do not. I am not a financial advisor, and I bear no responsibility for your trading choices.
✅ Feel free to reach me out with any questions or recommendations. I am more than willing to assess and analyze any currency pair or index that piques your interest.
dydxits my opinion on dydx just take a look on it
and if the market is well then it will go as the given target and sl is must and put sl below the given resistance.
DYDX Analysis: What's Ahead for DYDX after a Crucial Price Surge💎 DYDX is experiencing a significant uptick in price and has successfully breached the MA 200, consistent with previous anticipations.
💎At the moment, DYDX is advancing towards the resistance found at its former high. A definitive breakthrough above this resistance would confirm the potential for the continuation of the bullish trend. The RSI is currently in the overbought zone, indicating there is still room for more upward progression.
💎Even with a bullish stance, anticipating a period of corrective consolidation in the near term would be reasonable for DYDX.
💎The pivotal resistance to monitor is located in the $2.3 area. Stay alert to the evolving market dynamics and remain updated!

DYDXUSDTBINANCE:DYDXUSDT short idea
⛔"Daily crypto market analyses I provide are personal opinions & not financial advice. Trading carries risks, so do your own research & seek advisor's help.#DYOR"
Don't forget to like and comment
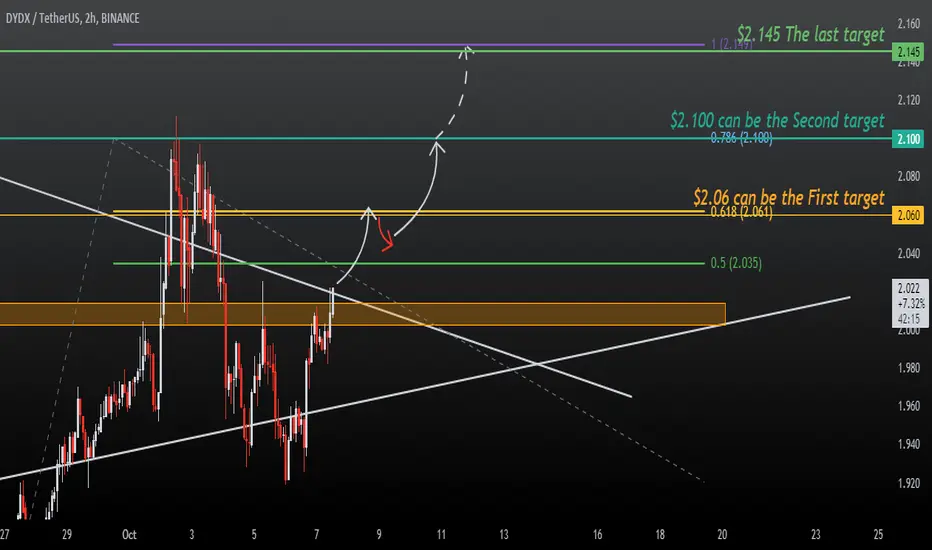
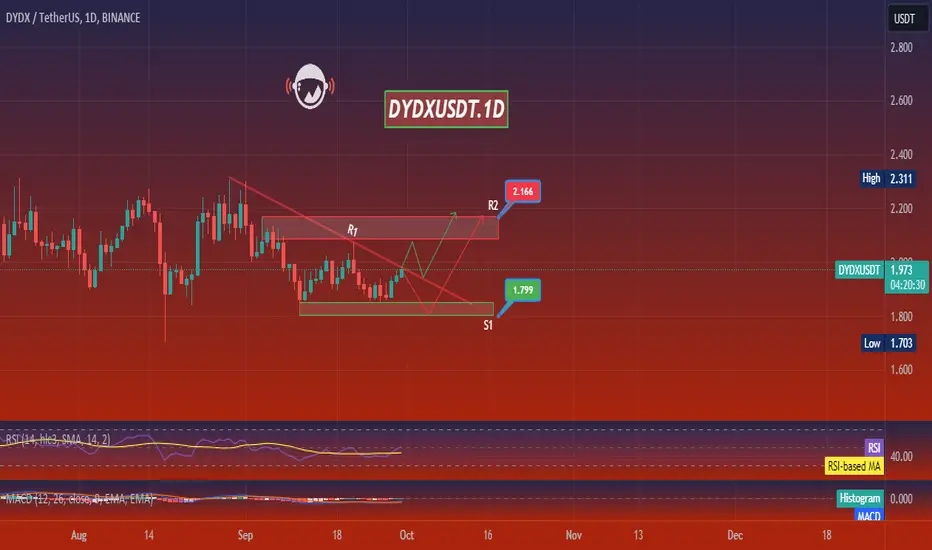
DYDXUSDTThis is a 1D frame analysis for DYDXUSDT As you can see, the price is approaching a resistance area and its supply. If it cannot break above our first resistance line, it will be doomed to our support area, and if it can break above our first resistance line, it can start its move towards our second resistance area.
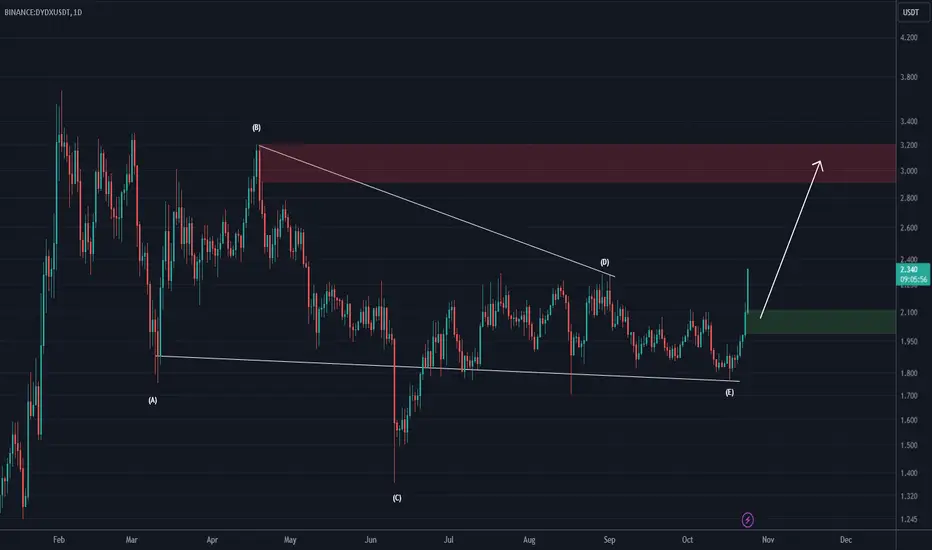
DYDX(based on NEo wave) there is a scenario for triangle and it has 22% stop loss! but is has a good risk to reward for first target, there are some other scenarios for this and maybe its a little risky!

DYDXI've shared idea about DYDX , now it's time to see where technical analysis shows
It's not a financial advise
Always DYOR

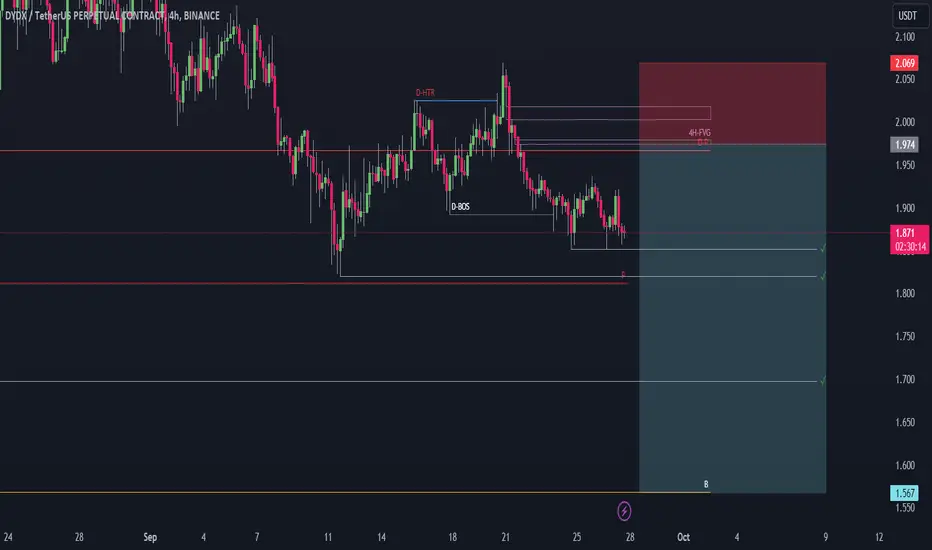
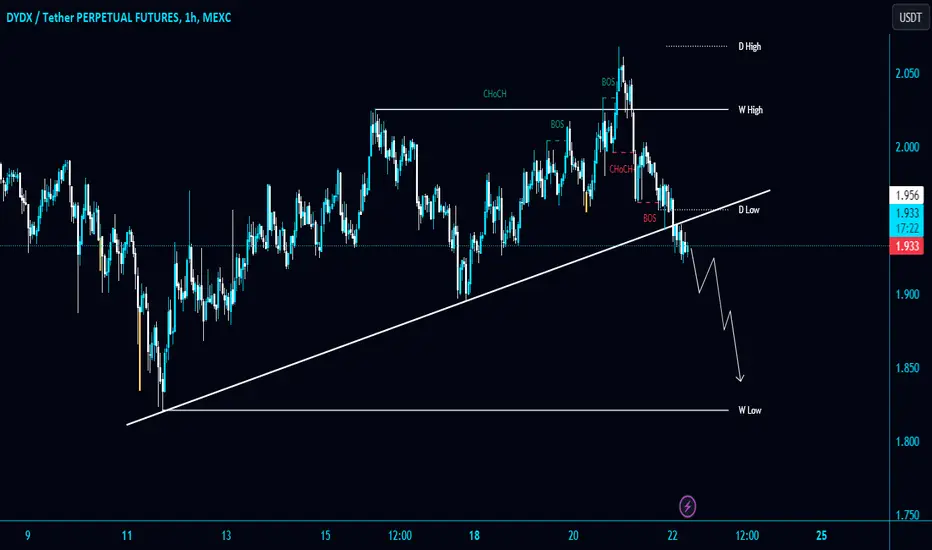
#DYDX/USDT break and retested the Diagonal Trendline in 1-Hour T#DYDX/USDT break and retested the Diagonal Trendline in 1-Hour TF!
CRYPTOCAP:DYDX is looking heavy. I am in Short. Expecting PWL $1.82 retest.
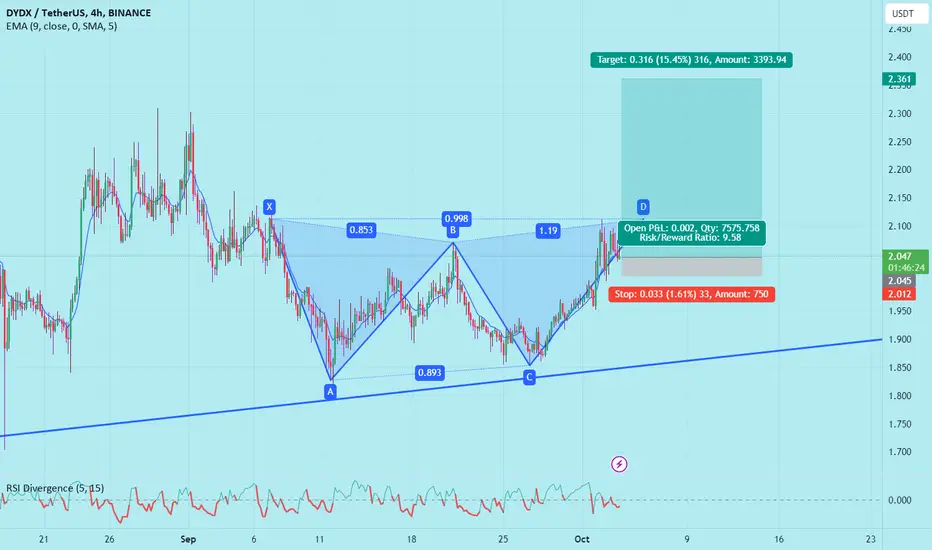
DYDXusdtDYDX long entry.
Disclaimer: The trading signals provided are for informational purposes only and should not be considered as financial advice. Trading in financial markets involves substantial risk and is not suitable for all investors. Past performance is not indicative of future results. The sender of these signals is not responsible for any losses incurred due to trading decisions based on the provided signals. Traders are advised to conduct their own research and seek advice from qualified financial professionals before making any trading decisions.
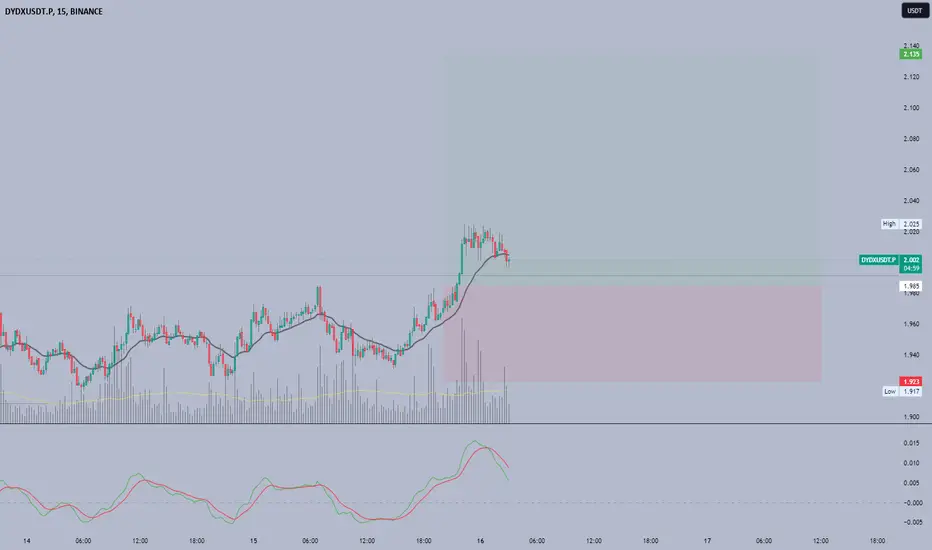
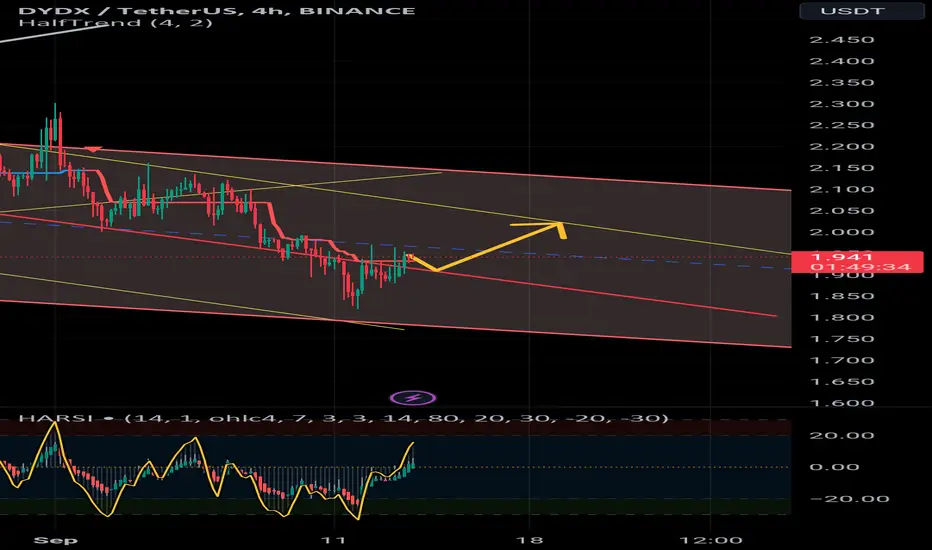
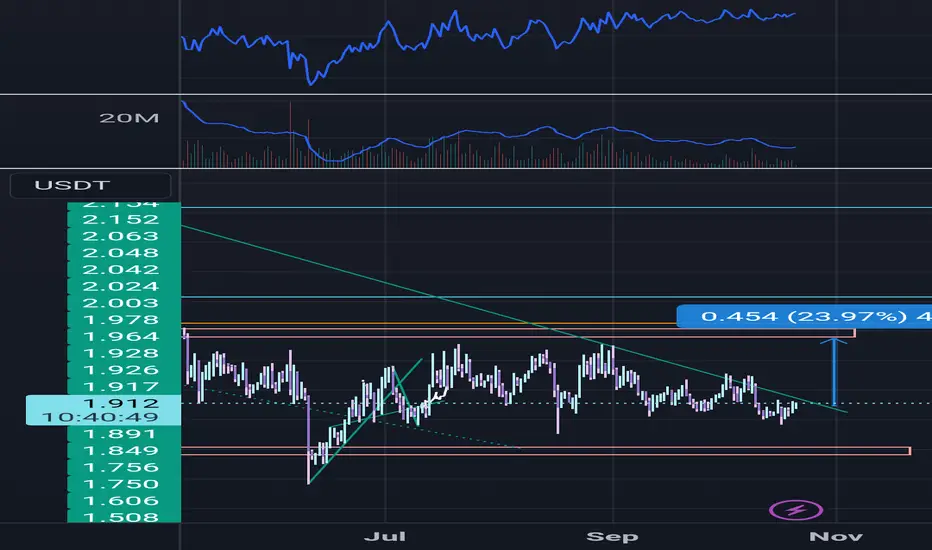
DYDXUSDT LONGI think the dydx will retest the red Trendline around 1.917 (where I have limit buy order) and continue upwards up to 2. TP at 1.98