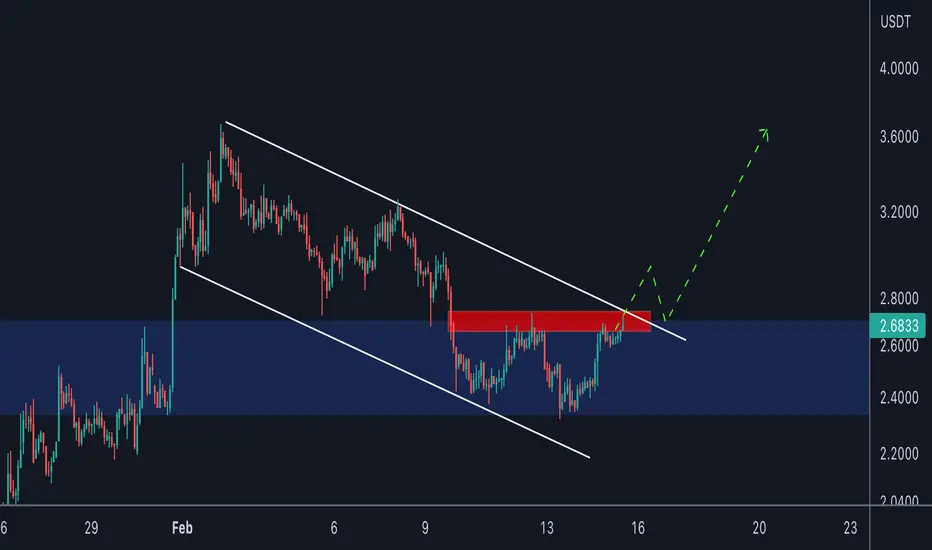
DYDX new potential rise soonDYDX / USDT
Price is forming descending channel on weekly support
If breakout is confirmed …it will be ready to fly again
Keep an eye
Also check our longterm view on attachments below
DYDXUSDT.PS trade ideas
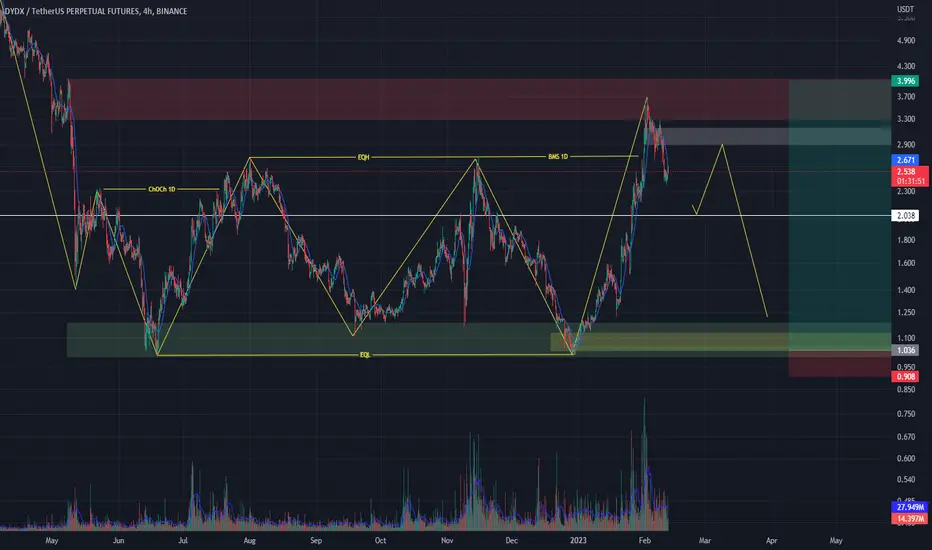
DYDX / TetherUS PERPETUAL FUTURESIn my opinion i think we will see DYDX goes down if you see my analysis and you like it put like to share more analysis

DYDX / TetherUS PERPETUAL FUTURESIn my opinion i think we will see DYDX goes down if you see my analysis and you like it put like to share more analysis

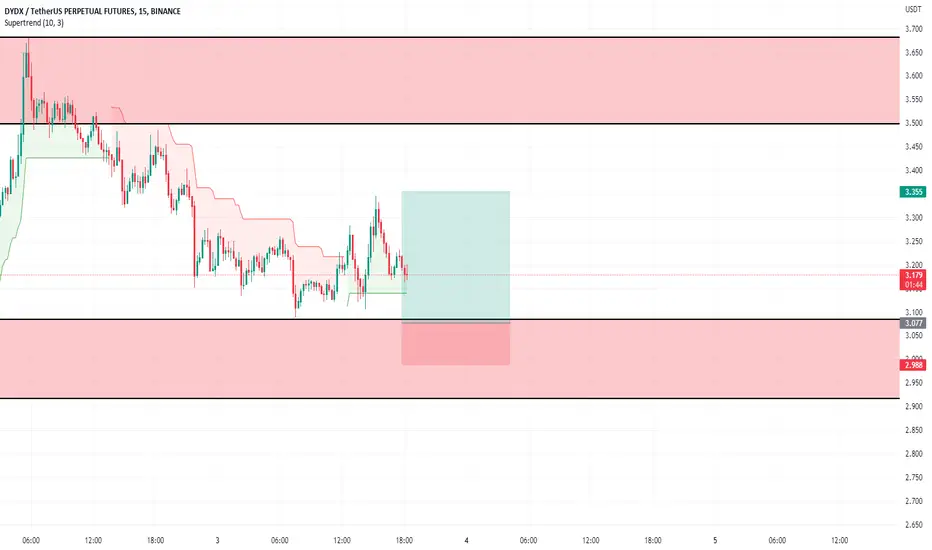
DyDx is printing a nice Local Zone DyDx with FIB pulled on Local Zone bouncing off the .5
Keeping an eye on this one.
DeFi looks to be the "Go To" since regulation is unclear and more peeps will flock off Centralized while the dust settles.
There is alot of other DeFi coins out there, I will be posting more soon.
Good Luck Out There!
DYDX buy/longDYDX buy/long swing trade idea
Entry zone = 1.036-1.06
Stop loss = 0.908
Take profit = 2.038, 3.996
SMC + Price Action
DYDX Short AnalysisDYDX is currently facing daily resistance at 2.726, will look for short after analysing bearish candlesticks about to form next 2 3 days, if it retests the resistance line, will take short

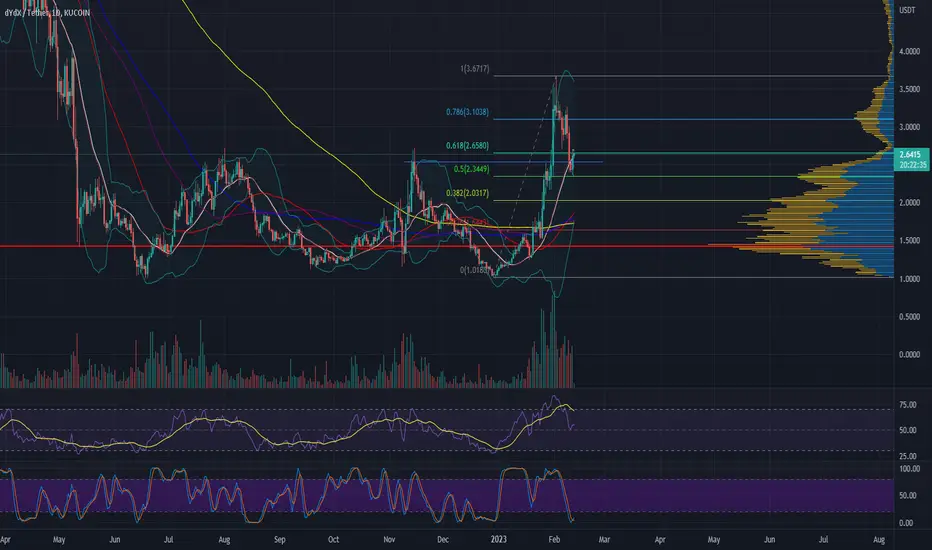
DYDX longterm potential DYDX / USDT
This is my own thought about DYDX in long term If the resistance zone (above accumulation) will hold in next weeks
There’s no guarantee - not a financial advice
Invalidation: closing back inside range (by weekly candle)
Note : we made over 170% profit in last few days in DYDX after price reached full setup target
check previous idea here : ⬇️
Best of wishes

DYDX BULLISH?DYDX is currently consolidating within a descending price channel. Or in what some others call it, a "bull flag"
Testing its last high from Nov 15, 2022 as support.
Will this signal a breakout of this formation towards higher targets?
If you think you've gotten awesome content from my TA, please smash that like (boost) button!
It keeps me motivated to continue hitting the charts for y'all!!
I'd also love to see requests on any chart you'd like me to look at!
So please leave a comment on what Analysis you'd like me to do next! <333333

DYDX - Video Top-Down Analysis!Hello TradingView Family / Fellow Traders. This is Richard, as known as theSignalyst.
Here is a detailed update top-down analysis for DYDX .
Which scenario do you think is more likely to happen? and Why?
Always follow your trading plan regarding entry, risk management, and trade management.
Good Luck!.
All Strategies Are Good; If Managed Properly!
~Rich

DYDXUSDT | BULLS IN CONTROLDYDX has been trading in a bullish trend .
The price on shorter time has broken above the falling resistance.
The price now hold an important strong horizontal resistance.
The price can pull back to the resistance levels.
The bulls are in control.
Manage your trades accordingly.


DYDX/USDT SignalDYDX Coins' price of $3.075 may experience a slowdown. It is important to note that the cryptocurrency market can be highly volatile and prices can fluctuate rapidly. It is recommended to conduct thorough research and seek financial advice before making any investment decisions.
It is possible that the price of DYDX Coin, currently at $3.357, may decrease in the future. As with any investment, it is important to consider the potential risks and to conduct thorough research before making a decision.
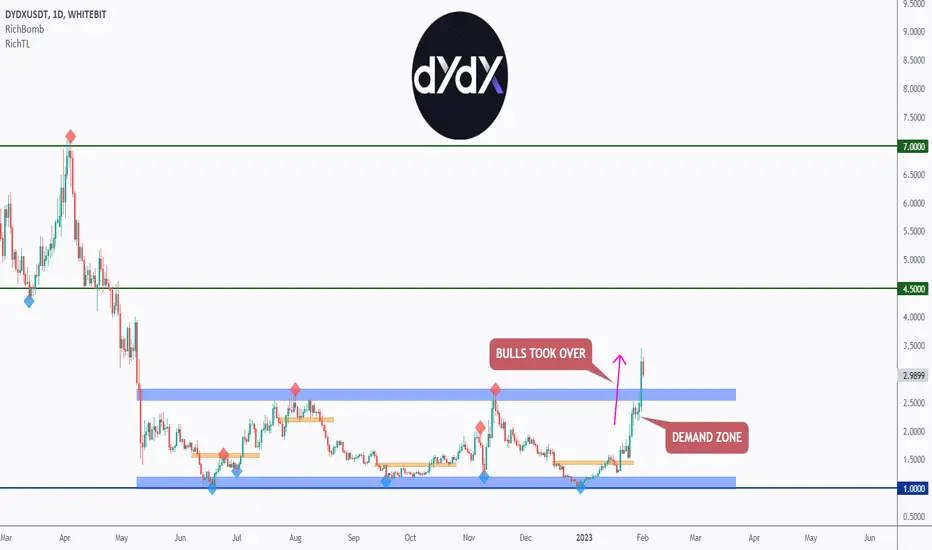
DYDX - Double Bottom's Neckline Broken 👌Hello TradingView Family / Fellow Traders. This is Richard, as known as theSignalyst.
DYDX has been one of the most gainers throughout January with over 200% move.
DYDX broke a yearly range in the shape of a double bottom in blue, confirming a long-term shift in momentum to bullish.
🏹 The bulls already took over by breaking above the upper blue neckline.
As per my trading plan, as DYDX retests the zone, I will be looking for buy setups on lower timeframes to catch the next impulse movement upward.
📚 Always follow your trading plan regarding entry, risk management, and trade management.
Good luck!
All Strategies Are Good; If Managed Properly!
~Rich
DYDX 127% profits after my call.. what next?#DYDX / USDT
DYDX the only coin i posted its signal in public this season
Finally it reached the full setup profits and made 127% profits (spot) in almost 2 weeks !
Congratulations if you followed my bottom entry (1.3$)
Here is my previous setup check here : ⬇️
WHAT NEXT?
First we secured some of our profits here
Second look at HTF charts of DYDX
It tries to breakout the accumulation phase and it looks it just started
After current resistance we have 3.5$ - 4.3$ - 7$ - 10$ are possible next LONG TERM targets
Dont forget to like and follow for more
Best of wishes

DYDX ascending channelDYDX / USDT
DYDX is trading inside tight range forming ascending channel
If Bulls continue to prove their strength… we can see a new rise soon
Before trading / investing calculate your risk first
Best of wishes

DYDX/USDT Chart DYDX/USDT Chart
Entry Point: $2.957
Stop Loss: $3.125
Target 1: $2.806
Target 2: $2.598
Target 3: $2.302

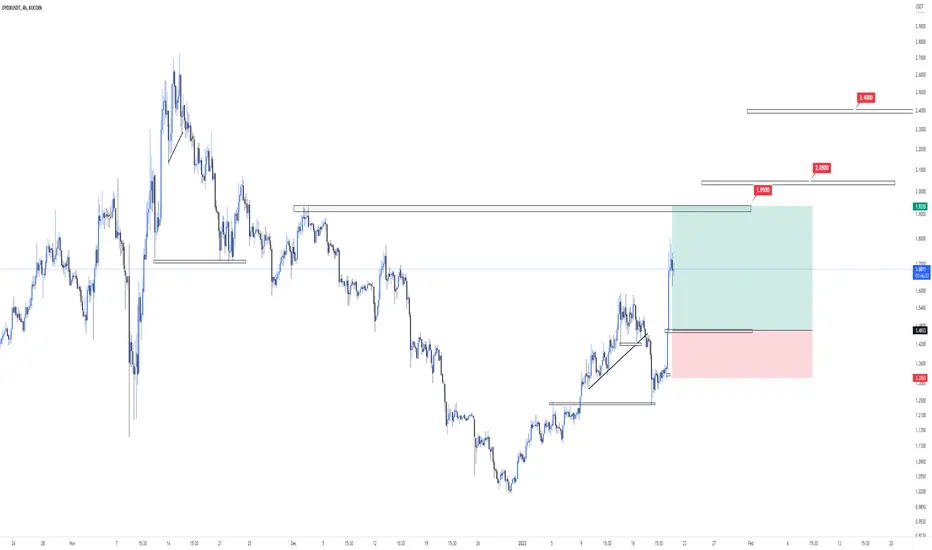
DYDXUSDT LONG
Hi everyone, DYDXUSDT has a significant potential for the long position at this psychological level to reach 1.95 $, 2.05 $, and 2.40$ with 30, 40, and 65 percent profit respectively.
Analyse will be updated as time goes by.
Good luck.
DYDX USDT SHORT DYDX Trading in uptrend for few days now breaking down uptrend in 4 hour's time frame clear move for correction or retest to 200MA
DYOR
HAPPY TRADING

DYDX to break a major resistance from pattern (The Global Market Reversal Pattern) DYDX to break a major resistance from pattern, NFA.
Most stocks look the same as well. Inverse head & shoulders / reversal pattern

DYDX price at a critical point, then "make it or break it"The DYDX price is now at a critical point
On the one hand, the DYDXUSDT price is at the bottom of the trade that lasts for the last 6 months
This price gives a good entry point for a medium-term trade +130% to $2.72 or a long-term trade +480% to $6.84
Stop for both positions below $1. The profit/loss ratio is more than adequate.
What part of the deposit to buy DYDX, for the medium or long term and whether it is worth buying at all depends only on you and a little more on the market)
This was the positive side of our analysis .
On the other hand , the trend of DYDXUSDT will change only after the price consolidates above $2.72. And this may not happen, because on 17.01.23, 5.7 million coins are to be sold, which will be 0.57% of the maximum possible supply of DYDX and +4% to the current number of coins in circulation.
And from February 2023, investors, consultants, and other early participants of the project will acquire ownership of DYDX, and we are talking about 100+ million coins
The increased supply of coins on the market, according to the law of supply and demand , can significantly push the price down.
The closer the DYDXUSDT price will approach $1, the higher will be the chance that the fall to $0.58 will not be avoided, and with it the development of the red scenario.
For some, this will sound like a total negative, and for others as a chance to buy at a more favorable price.
Earlier, in early November 2022, the price of DYDXUSDT showed a sharp increase from $1.20 to $2.72 in a week. During this period, there was a lot of negativity around the FTX exchange and its subsequent bankruptcy. It is very likely that then crypto users transferred assets from centralized crypto exchanges to decentralized DYDX.
It is difficult to predict what will happen this time, but the only thing we can control in the crypto market is the risks we are willing to take on a personal deposit.
_____________________
Did you like our analysis? Leave a comment, like, and follow to get more

DYDX and the value areaWHAT IS THE VALUE AREA?
The value area in trading is a range of prices where the majority of trading activity occurred during a specific period, typically during a trading session. It is used in market profile analysis to identify areas of fair value and potential areas of support and resistance. The value area is often represented by a bell-shaped curve, with the majority of trading activity concentrated around the point of equilibrium or fair value. This information can be used by traders to inform their trading decisions, such as setting stop-loss and take-profit levels or determining where to enter or exit a trade.
On the DYDX price chart a big resistance is visible.
To anaylse history on the DYDX chart, we could say first that every topping is happening,
when the RSI is in the level 70 area.
$2 Area is the highest volume value area, and the most possible point at the moment, where the price can reverse from.
If the price could break above the mentioned resistance, the next possible point where it is smart to place bets is the $2.7 area.
RISK-REWARD
By the Risk and the Reward standpoint, this trade is not recommended, only from the higher zone, where the price exits the value area.
To trade this setup the safest way possible, it is recommended to wait for the price to get back to the value area and start shorting.
IMPORTANT
Remember:
The FED is still hiking rates, and most of the times it causes a crash on the market, when it is about to end.
Investing long term has the highest return potential, when the hiking cycle is over.
The fundamentals still not looking great and the crypto market is still speculative, so never FOMO into a trade.
I am so grateful for the support and engagement of my readers. Thank you for taking the time to read my analysis and for providing valuable feedback and insights. Your support means a lot to me and it's an honor to be able to share my knowledge and experience with you. I am constantly inspired by the community on TradingView and I look forward to continuing to learn and grow together. Thank you again for your support and for making this journey so enjoyable!
Have a profitable 2023!

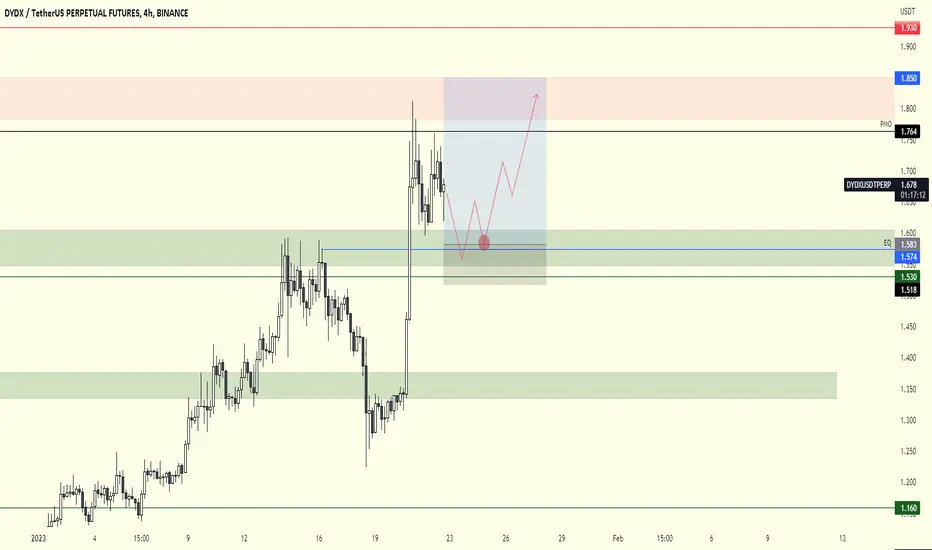
$DYDX #DYDX | LTF LONGGreen box and EQ might be worked as a support level .
The bottom of the red box, liquidity zone and around 1.93 will be the points I will observe as resistance.
With the loss of 1.53 (1H) , the first bounce of the price will be around 1.38 .
I wish everyone a good week.
DYDX forming a double bottom patternDYDX forming a double bottom pattern
Here is a short position for you guys:
Buy: 1.41-1.42
Tp1: 1.35
Tp2: 1.32
Sl: 1.45
