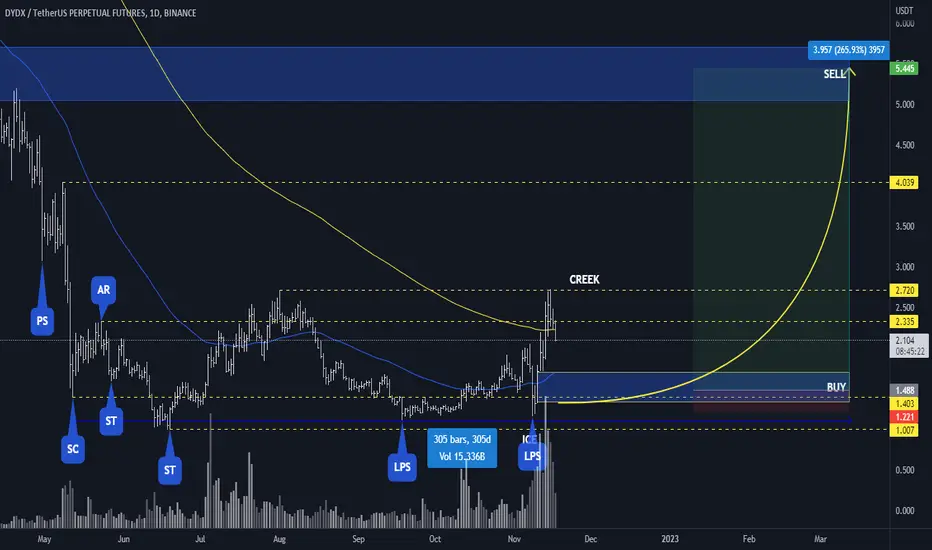
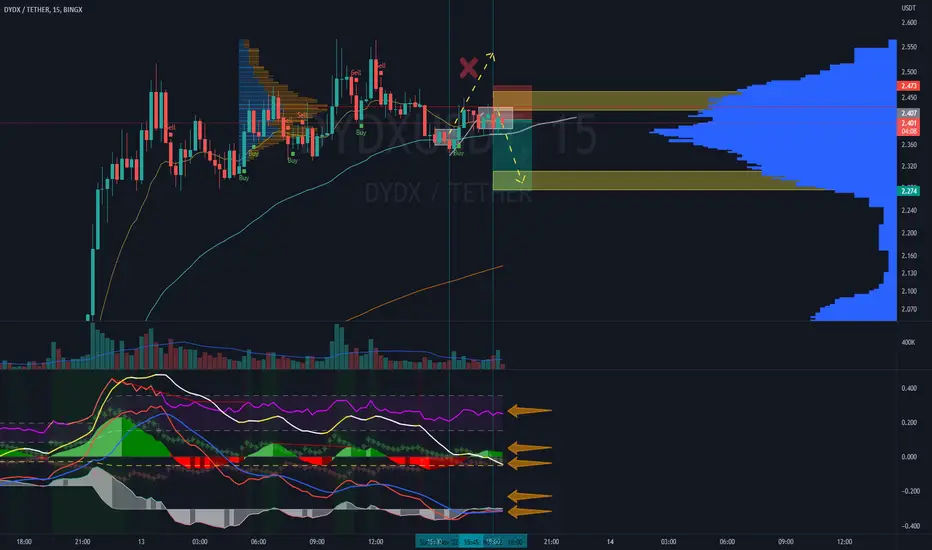
DYDXUSDTPERP - Tool review.A trading range is formed on the chart with the boundaries 1.007 - 2.72.
When the price repeatedly approached the upper boundary, the breakout of the local maximum did not take place. For the given period of time accumulation is in the final phase. In this phase for the transition to the impulsive upward movement it is necessary that the price would break the local maximum and consolidate above it. In the presence of the SOS signal and BU/LPS will be a confirmation of a successful accumulation. In the absence of these signals we expect a further decline in price, to the middle of the range the second target is the lower boundary of support.
If you liked the idea, please like it. That's the best "Thank you!" for the author 😊
P.S. Always do your own analysis before a trade. Put a stop loss. Fix profits in installments. Withdraw profits in fiat and please yourself and your
your friends.
DYDXUSDT.PS trade ideas
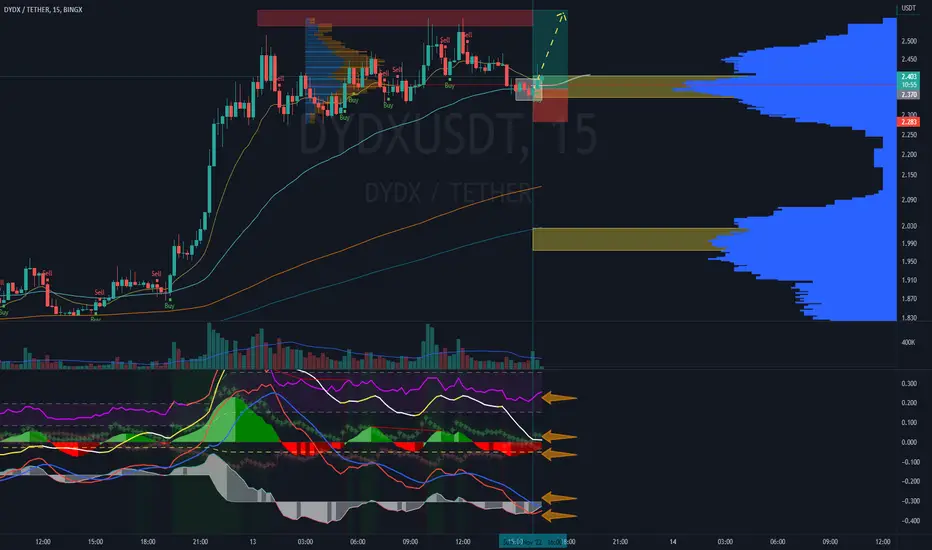
DYDX BREAKS OUT OF DOWNTREND.We see here that DYDX has broken out of its historic downtrend, retraced to test it local bottom of 1.18.
Is this a confirmed reversal for DYDX?
considering the sad news of FTX crumbling to pieces, monies will move from one dying exchange to another.
Only time will tell whether DYDX will succeed in becoming the next leading exchange, behind Binance...
So far, the chart is showing strong signs of an upwards movement.
Don't blink 😉
If you think you've gotten awesome content from my TA, please smash that like (boost) button!
It keeps me motivated to continue hitting the charts for y'all!!
I'd also love to see requests on any chart you'd like me to look at!
So please leave a comment on what Analysis you'd like me to do next! <333333

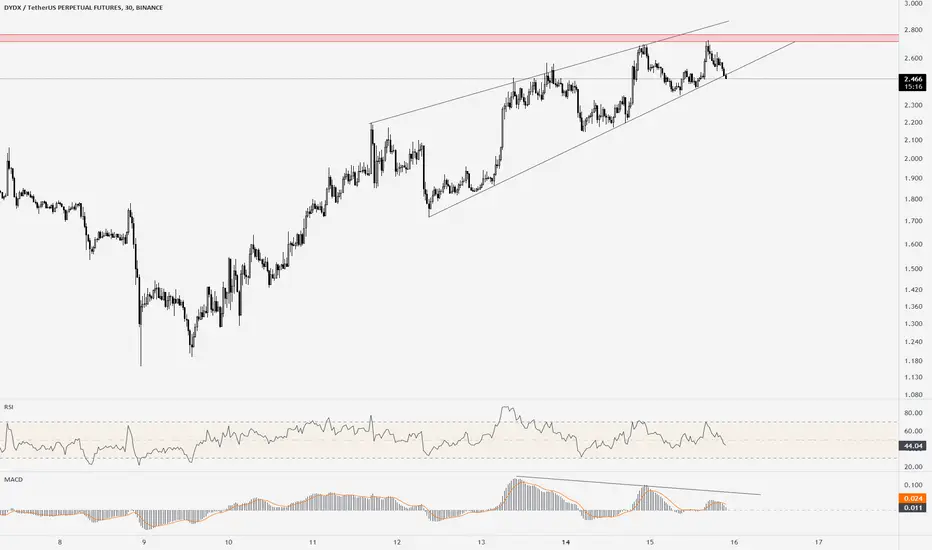
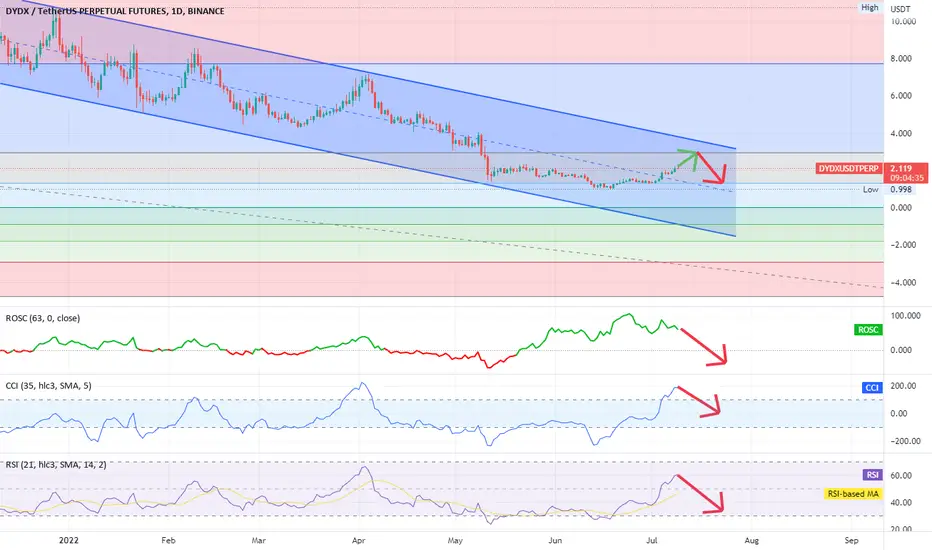
DYDX SHORTThe price near the static resistance range forms an ending pattern and decreases from the height of the impulses, and this is a sign of weakness in the trend.
I expect the price to break the upward trend line and use it downwards
#TOBTC #LQR DYDX , its look like there's Important Reistance ZOne which is Confrm level for Long ( 0.88 ) Cluster with Trading ZOne Reistance
between 2.640 - 2.527 this resistance need to break! otherwise . first support Zone gona be on 1.725

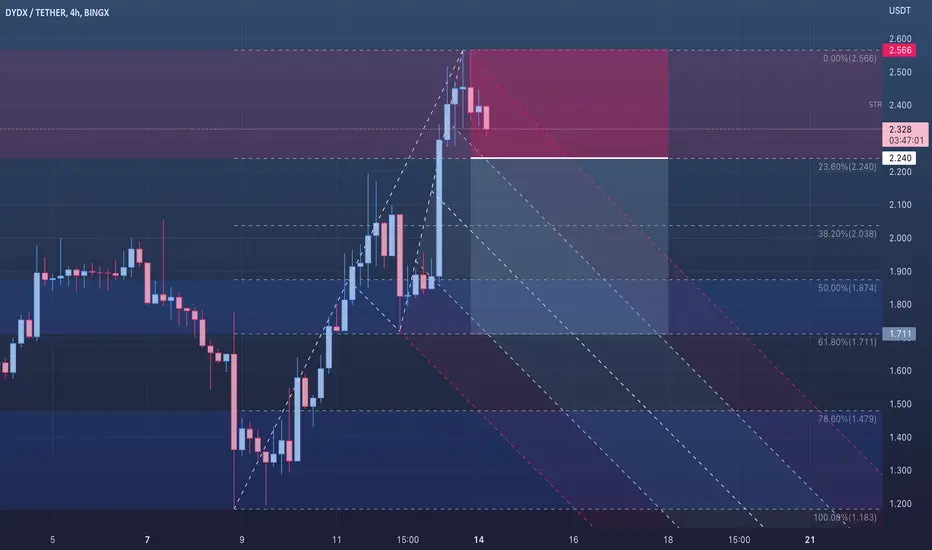
🔴 DYDXUSDT - 4H (14.11.2022)🔴 DYDX USDT
TF: 4H
Side: Short
Entry: $2.393
SL: $2.566
TP 1 - $2.240
TP 2 - $2.038
TP 3 - $1.874
DYDXUSDT is due for a correction on the 4 hour time frame.
dydxusdt - 2022/11/14Hello, I have an idea short for Dydxusdt because it has reached an important supply area
DYDXUSD SHORTPossible bearish movement of the pair. The price is currently in a trading zone with significant volume , with rejections at the top of the price right at the 55 period EMA , which is essential in my strategy for analysis of possible trend continuations. We also see significant development in the Squeeze momentum indicator and macd histogram monitors, with directionality changes to bearish confirmed. We see the attached ADX indicator entering below the 23 level line (0 point of the MACD histogram), indicating the weakness of the previous move higher as it bounced towards the 55 period EMA , to continue falling as the moves have indicated. previous; along with a possible sell signal pattern coming soon on the MACD lines. There could be a continuation of the downtrend.
If you are going to take my opinion into account, please respect the projection time, this is extremely important. If it is not fulfilled in the foreseen time and it makes a range, it will be better to close the operation in case it is possible.
DYDXUSD LONGPossible upward movement of the pair. Price is currently in a lower bound trading zone with significant volume making stops and holding rejections at the bottom of the price near the 55 period EMA , essential in my strategy for analysis of potential trend continuations. Indicators like Squeeze Momentum and the MACD histogram have turned bullish after their red valley; accompanied by the loss of bearish strength indicated by the ADX rebounding towards the EMA . The MACD lines would be giving a possible buy signal soon. I think you could go looking for the previous high price zone when you see indications of a bounce move higher on the 4-hour chart. In 1 hour timeframes we see that it has broken the bearish structure, forming higher lows than the previous ones.
If you are going to take my opinion into account, please respect the projection time, this is extremely important. If it is not fulfilled in the foreseen time and makes a range, it will be better to close the operation in case it is possible.
DYDX SHORT TERM BULLISH ON BEARISH RANGEBEARISH BIAS HTF WEEKLY
-Waiting to takeout the buy side liquidity on weekly TF
-Smooth Retracement on FVG @ 4HR
-Entry @ order block on 4HR TF FOR Swing trade position
-tp:@ 2.835
-WAITING TO MATERIALIZED THIS ENTRY ;-)

DYDX can continue rise hard next daysDYDX / USDT
This coins seems to bottomed out
We have published bullish ideas since 1.5$ (53% pump already)
Thanks to the fall of FTX (Centralized Exchange)
DYDX (One of Decentralized Exchange token) can rise hard In next days
DEX coins could be the future in next years so keep your eye on them
Best of wishes

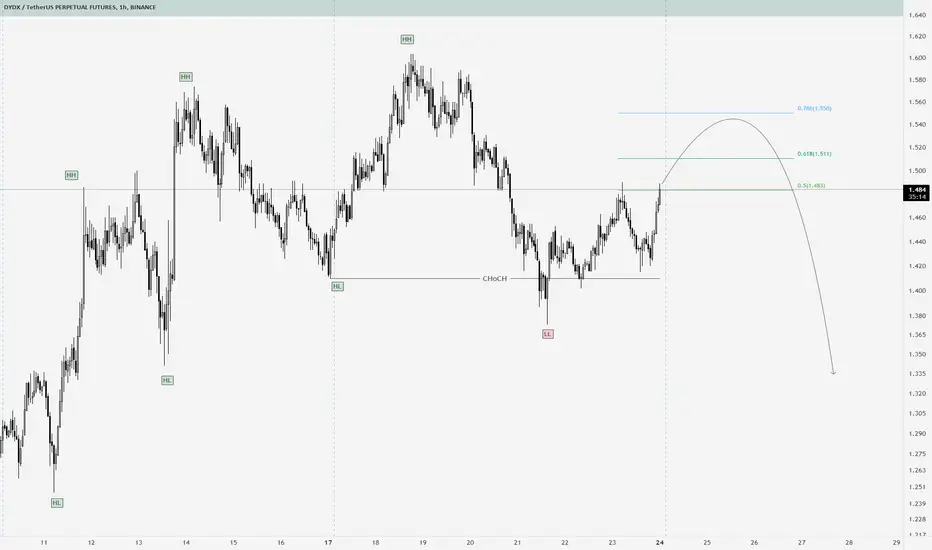
SHORT - DYDX dump to 1.34SHORT -DYDX dump to 1.34 with technical analysis and fibo
look at to chart...
DYDX chance for double bottomDYDX /USDT
Price in downtrend since 1 year inside massive descending broadening wedge
We also notice a possible double bottom in the chart
Keep it simple :
1- If price could break and sustain above trendline resistance we can see strong bullish wave in next days
2- incase of breakdown of Local support it will continue in downward direction
What do you think about DYDX ?
Could this time be a different time or not ?

DYDX UPDATE : start of new cycle ?DYDX/USDT
since listing of this coin in major exchanges it kept dumping for almost 1 year
Finally we got the first clear breakout from descending broadening wedge pattern after 3 major bearish waves
This breakout could be a shift of trend and new bullish cycle for this coin
The most important support here is marked as blue color rectangle which should hold to remain bullish otherwise i would consider it to be a scam coin if broken down too
What do you think about DYDX ?
Share me in comment section below ⬇️

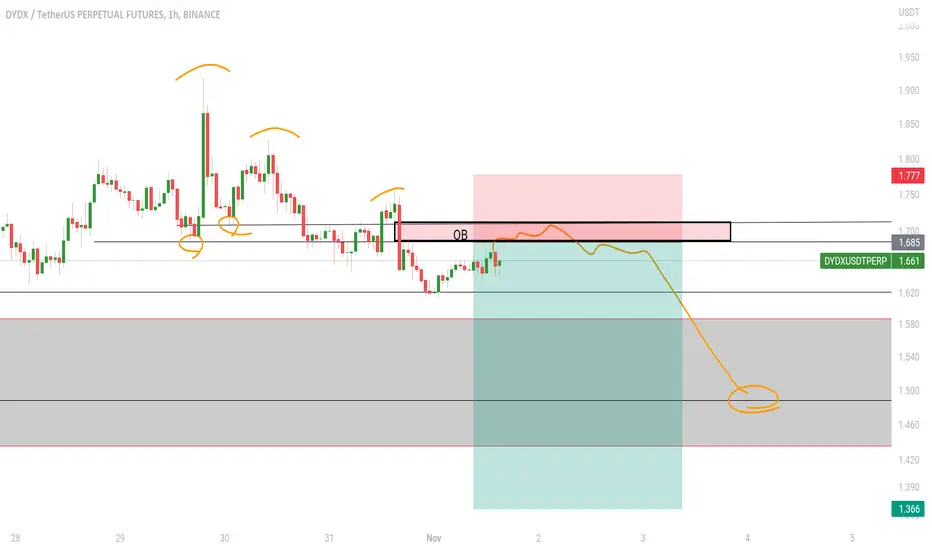
Dydx short ideaThere is obvious bearish msb, i need to try. Market structure broken this will be nice trade for me.
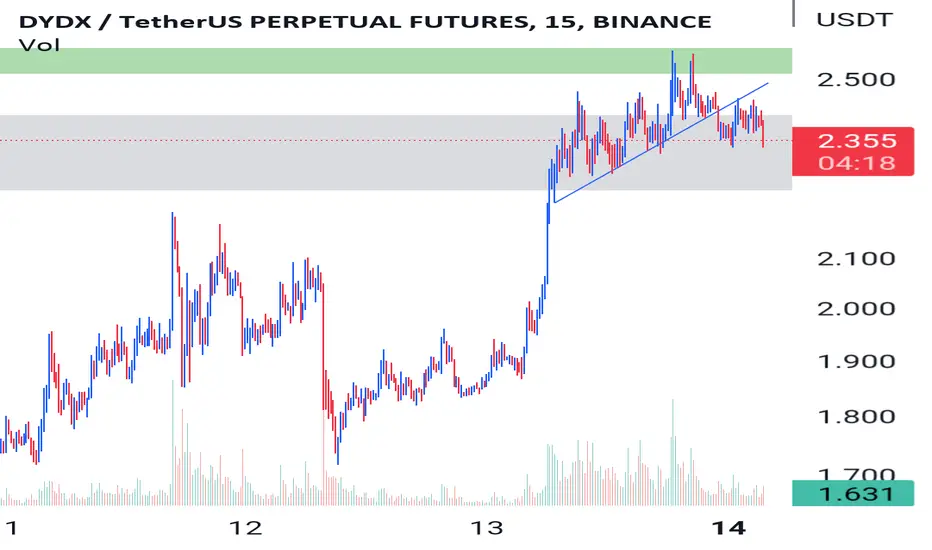
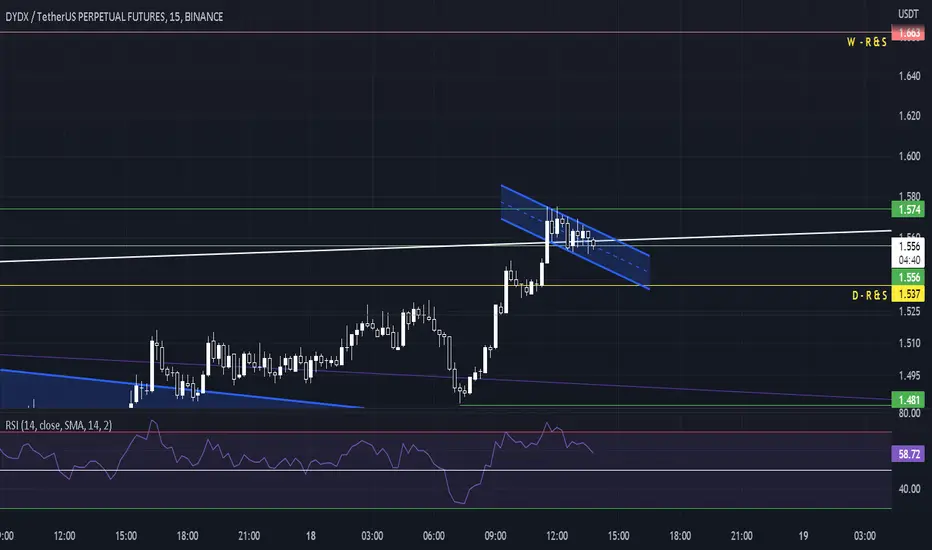
DYDX SHORTIn this range, looking for an excuse for a sell position .
Thank you for considering my analysis and perspective. I hope you find it helpful.
Hello, today i look into DYDXUSDT OKXHello Traders, DYDX USDT PERP
Direction : SHORT
Entry 1.3 - 1.285
Stoploss 1.32 (2%)
Not Financial Advice

dydxdydx 15 m bull flag - its bullish . markert movement is goin up .so i took dydx long entry so my feel is dydx going 1.64
DYDX LONGPrice has completed AB=CD pattern
If it doesn't miss the current price floor, it looks like the beginning of an uptrend has started .
Stay tuned for more updates.

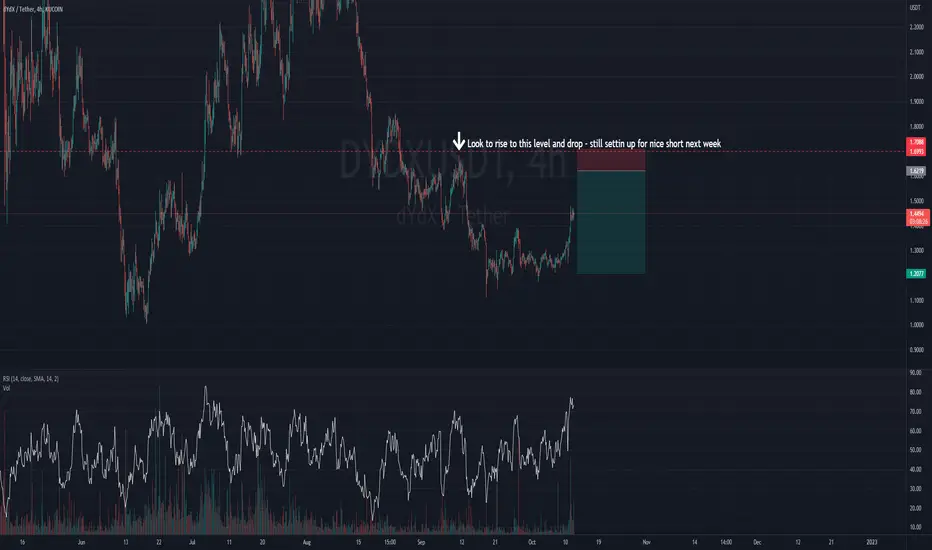
DYDXUSDT TRADING PLAN! A SHORT OPPORTUNITY!DYDXUSDT has somewhat risen while other markets are in a bearish mood.
DYDXUSDT can now take some correction.
Here is the trading plan for this pair.


400% growth DYDX price is real, but there are several conditionsThe DYDXUSDT price is starting to show "signs" that buyers are trying to push it off the bottom.
The downtrend has been going on for exactly a year, at the beginning of last October the price high was set around $28 for DYDX, and the low was $1 on June 22.
At the moment, the medium-term target for the growth of the DYDX price is in the range of 6-7 dollars.
- But before that, DYDX buyers need to break through the red downtrend line and fix the price above $1.70
- The next important stage that buyers and enthusiasts of DYDX will need to overcome is to break through and consolidate the price above $3. It will be difficult and at the same time very important, because $3 was the starting point of DYDX trading and this is a kind of psychological breakthrough and belief that the price can grow again.
- Only after these two conditions are met, it will be easier and more encouraging to think and believe in growth to $6-7 for DYDXUSD.
_____________________
Did you like our analysis? Leave a comment, like, and follow to get more

