#DYM/USDT DYM’s Comeback ?#DYM
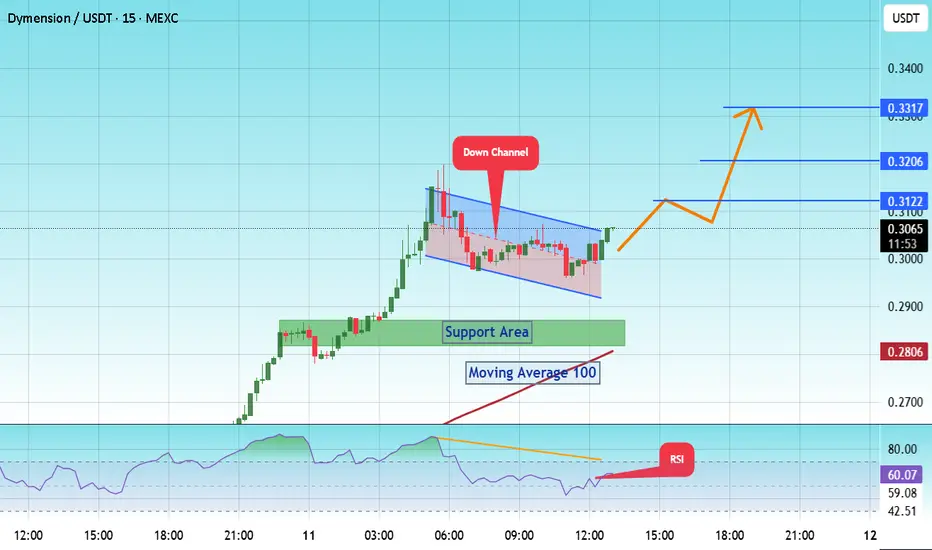
The price is moving within a descending channel on the 15-minute frame and is expected to break it and continue upward.
We have a trend to stabilize above the 100 Moving Average once again.
We have a bearish trend on the RSI indicator, supporting the upward break.
We have a support area at
#DYM/USDT#DYM
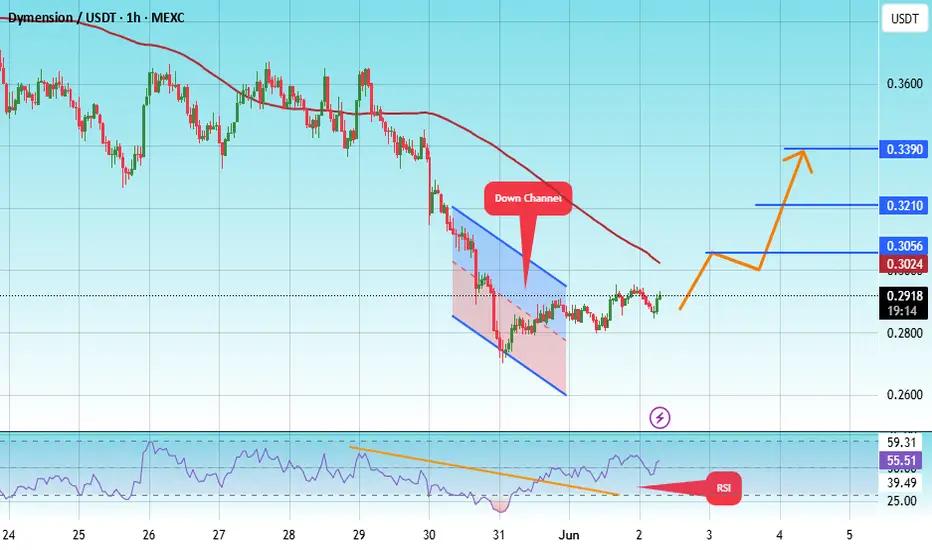
The price is moving within a descending channel on the 1-hour frame, adhering well to it, and is heading for a strong breakout and retest.
We are seeing a bounce from the lower boundary of the descending channel, which is support at 0.2729.
We have a downtrend on the RSI indicator that is abo
#DYM/USDT#DYM
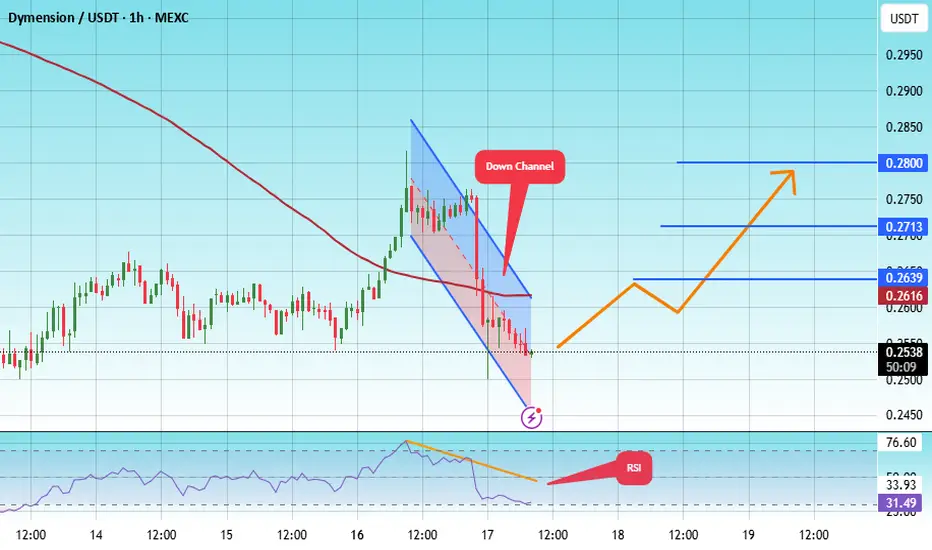
The price is moving within a descending channel on the 1-hour frame, adhering well to it, and is heading toward a strong breakout and retest.
We are experiencing a rebound from the lower boundary of the descending channel. This support is at 0.2480.
We are experiencing a downtrend on the RSI
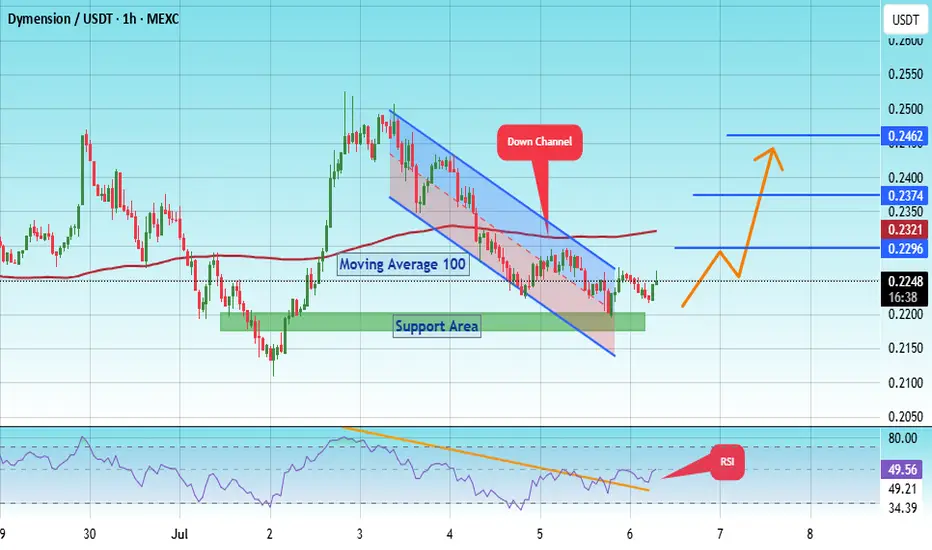
#DYM/USDT#DYM
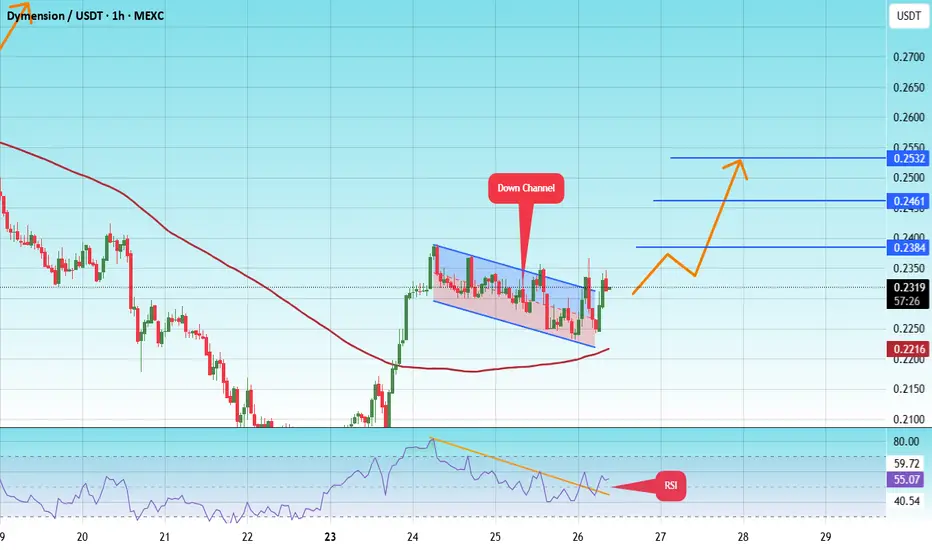
The price is moving within a descending channel on the 1-hour frame and is expected to break and continue upward.
We have a trend to stabilize above the 100 moving average once again.
We have a downtrend on the RSI indicator, which supports the upward move by breaking it upward.
We have a s
#DYM Dymension's Falling Wedge#DYM
The price is moving within a descending channel on the 1-hour frame, adhering well to it, and is heading for a strong breakout and retest.
We have a bounce from the lower boundary of the descending channel. This support is at 2180.
We have a downtrend on the RSI indicator that is about to be
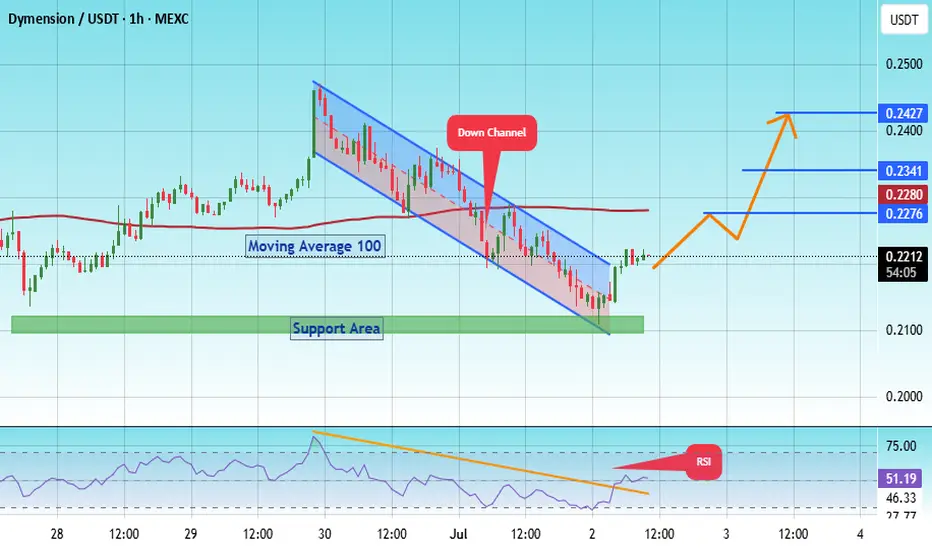
#DYM Dymension's Falling Wedge#DYM
The price is moving within a descending channel on the 1-hour frame, adhering well to it, and is on its way to breaking it strongly upwards and retesting it.
We have a bounce from the lower boundary of the descending channel. This support is at 0.2130.
We have a downtrend on the RSI indicato
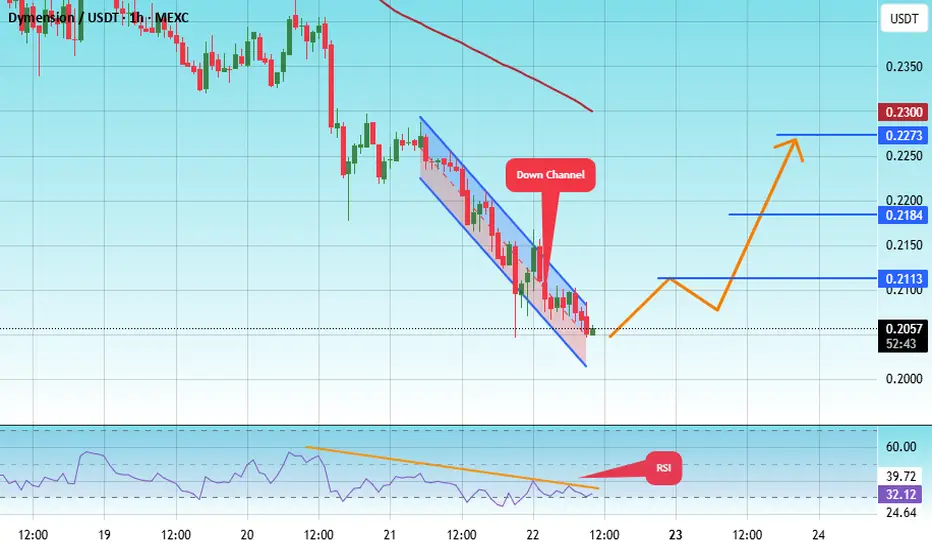
#DYM/USDT#DYM
The price is moving within a descending channel on the 1-hour frame, adhering well to it, and is heading for a strong breakout and retest.
We are seeing a bounce from the lower boundary of the descending channel, which is support at 0.2020.
We have a downtrend on the RSI indicator that is abo
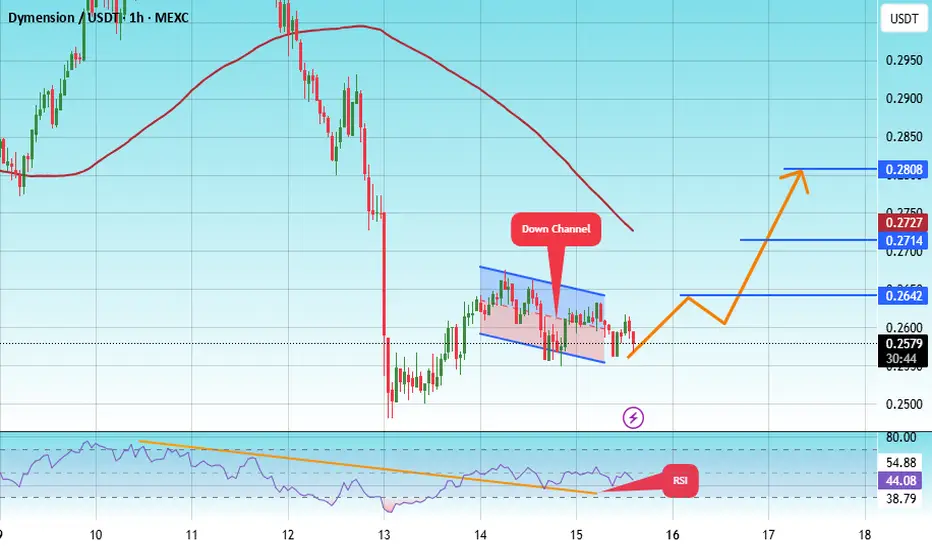
#DYM/USDT#DYM
The price is moving within a descending channel on the 1-hour frame, adhering well to it, and is heading towards a strong breakout and retest.
We are experiencing a rebound from the lower boundary of the descending channel. This support is at 0.2552.
We are experiencing a downtrend on the RSI
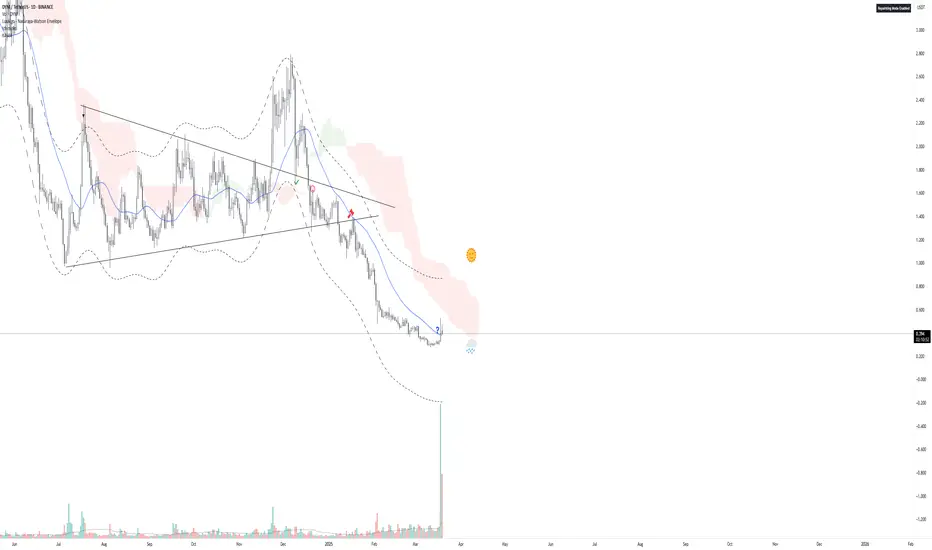
DYM’s Comeback: Storm Over or More Clouds Ahead?After breaking down from that lovely pattern, DYM is finally showing some strength—pushing above the moving average at last! Not gonna lie, there’s still plenty of resistance on the way up, but the volume on that breakout gave me a bit of hope for a trend reversal. Now, it’s retesting the MA, and fi
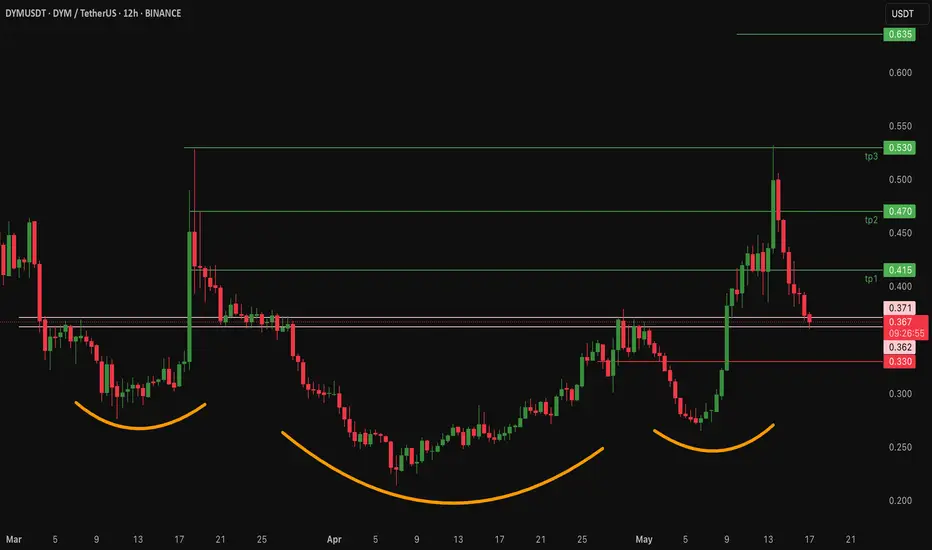
$dym Dym Dymension Inverse head and shoulder pattern (Bottoming)ASX:DYM Dymension price action is printing an inverse head and shoulders Pattern (Bottoming pattern)
Current Price: $0.361
Neckline Resistance is between 0.361 - 0.363
Price has pulled back from a local high near $0.53
If #dym Neckline Resistance holds then expect higher prices to to reached.
TP
See all ideas
Summarizing what the indicators are suggesting.
Oscillators
Neutral
SellBuy
Strong sellStrong buy
Strong sellSellNeutralBuyStrong buy
Oscillators
Neutral
SellBuy
Strong sellStrong buy
Strong sellSellNeutralBuyStrong buy
Summary
Neutral
SellBuy
Strong sellStrong buy
Strong sellSellNeutralBuyStrong buy
Summary
Neutral
SellBuy
Strong sellStrong buy
Strong sellSellNeutralBuyStrong buy
Summary
Neutral
SellBuy
Strong sellStrong buy
Strong sellSellNeutralBuyStrong buy
Moving Averages
Neutral
SellBuy
Strong sellStrong buy
Strong sellSellNeutralBuyStrong buy
Moving Averages
Neutral
SellBuy
Strong sellStrong buy
Strong sellSellNeutralBuyStrong buy
Displays a symbol's price movements over previous years to identify recurring trends.