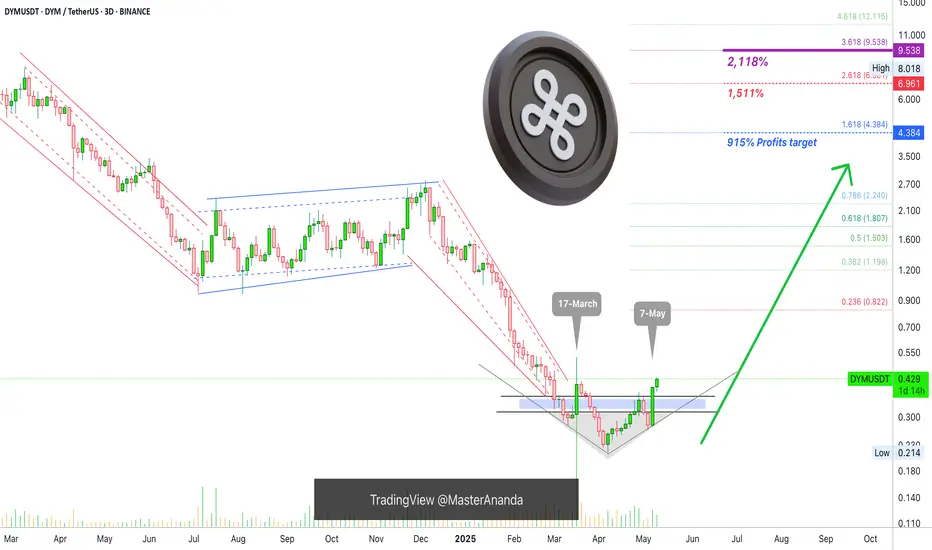
Dymension —Technical Analysis Works, We Can Time The MarketOnce a recovery is confirmed there is no going back. Technical analysis works, it is an amazing tool and this tool can help us time the market. It can help us know in advance where the market is headed next. Here we have a great example with this DYMUSDT chart.
Once a recovery is confirmed, there is no going back. Here the recovery is the inverted triangle pattern coupled with volume.
On 17-March, a three days session, DYMUSDT (Dymension) produced the highest volume ever. This was a strong green candle but there was a rejection.
This rejection led to a lower low and new All-Time Low. Here is the thing, there was a recovery just a few weeks later.
The last active session, 7-May, produced a full green candle after a higher low. This candle erased all the bearish action after the lower low.
The current 3D session is now full green and trades above the 17-March candle close. This is a complete recovery of the rejection from mid-March.
This recovery reveals two things: (1) The downtrend is over and (2) DYMUSDT is now green.
This chart pattern and price dynamic, reveals what will happen next. Notice that this information is nowhere written on the chart, you have to know where to look and what to look for to be able to extract this information, but the information is present to those that know how to interpret the data.
The chart doesn't predict any specific event. The candles can't be right or wrong, that part is on us. But it is clear that after such behavior by the buyers and sellers of this project their next action will be a wave of buying. This will push prices up. Technical analysis works .
What I like about this chart setup, it is so easy and so simple, yet it has huge potential for growth. With this tool, we can time the market . Being able to time the market successfully calls for a new strategy for those investing and thinking that the way to riches is allocating money into bonds and index funds.
Imagine the same investing strategy, monthly compounding, while at the same time choosing smart.
Buy when prices are low, sell when prices are high while choosing the best possible projects when they are about to blow up.
The end result can be a "Billionaire Teacher," the "Millionaire Teacher" will sound like a bad joke.
10% in the era of Crypto? Bitcoin alone outperforms these numbers already a hundred fold.
Namaste.
DYMUSDT trade ideas
#DYM/USDT#DYM
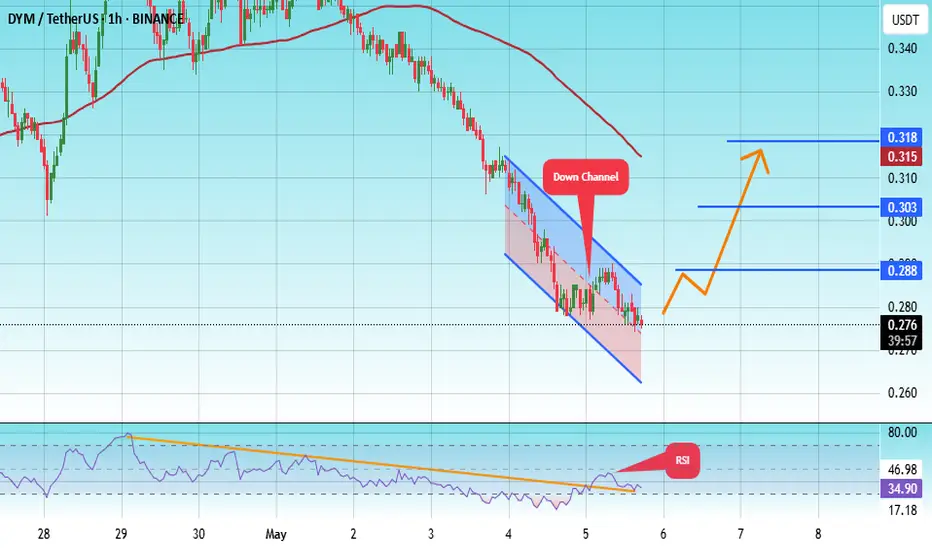
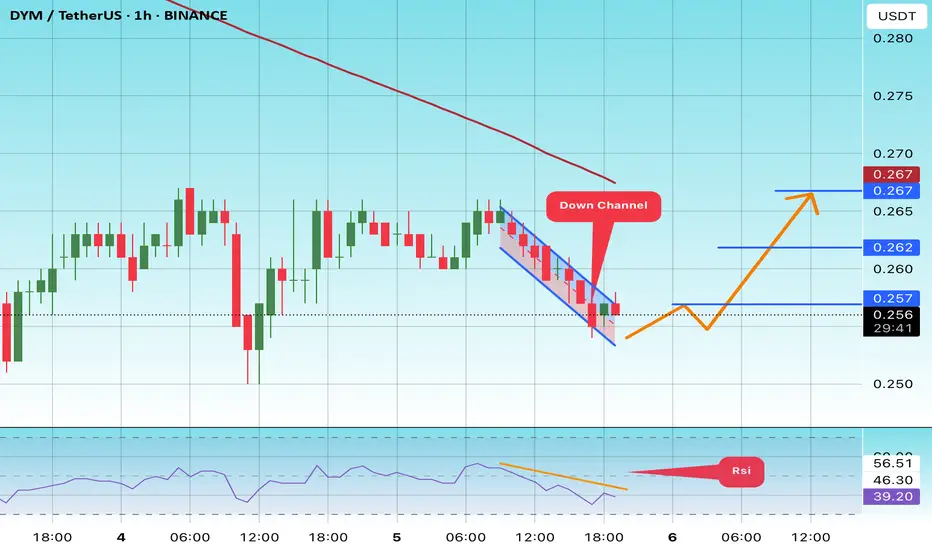
The price is moving within a descending channel on the 1-hour frame, adhering well to it, and is on its way to breaking it strongly upwards and retesting it.
We are seeing a rebound from the lower boundary of the descending channel, which is support at 1.76.
We have a downtrend on the RSI indicator that is about to break and retest, supporting the upward trend.
We are looking for stability above the 100 moving average.
Entry price: 0.276
First target: 0.288
Second target: 0.303
Third target: 0.318
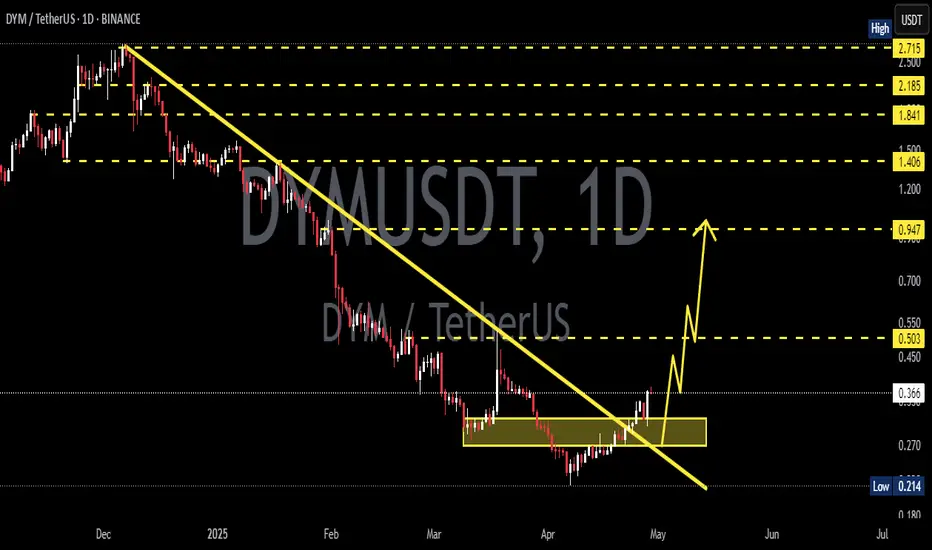
DYMUSDT 1D AnalysisDYM ~ 1D Analysis
#DYM Buy back when testing this support with a short -term target of at least 10%+ from here.
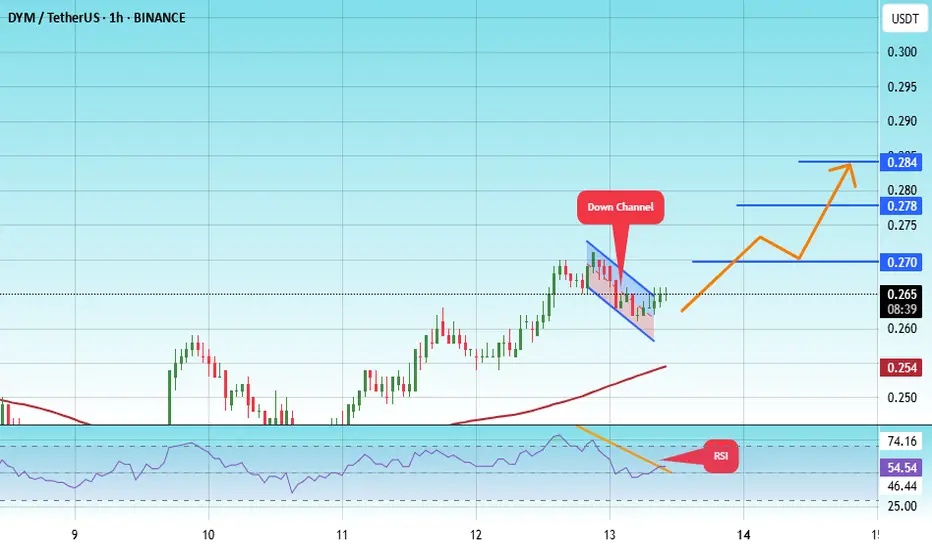
#DYM/USDT#DYM
The price is moving within a descending channel on the 1-hour frame and is expected to break and continue upward.
We have a trend to stabilize above the 100 moving average once again.
We have a downtrend on the RSI indicator, which supports the upward move by breaking it upward.
We have a support area at the lower limit of the channel at 0.288, acting as strong support from which the price can rebound.
Entry price: 0.296
First target: 0.301
Second target: 0.311
Third target: 0.321
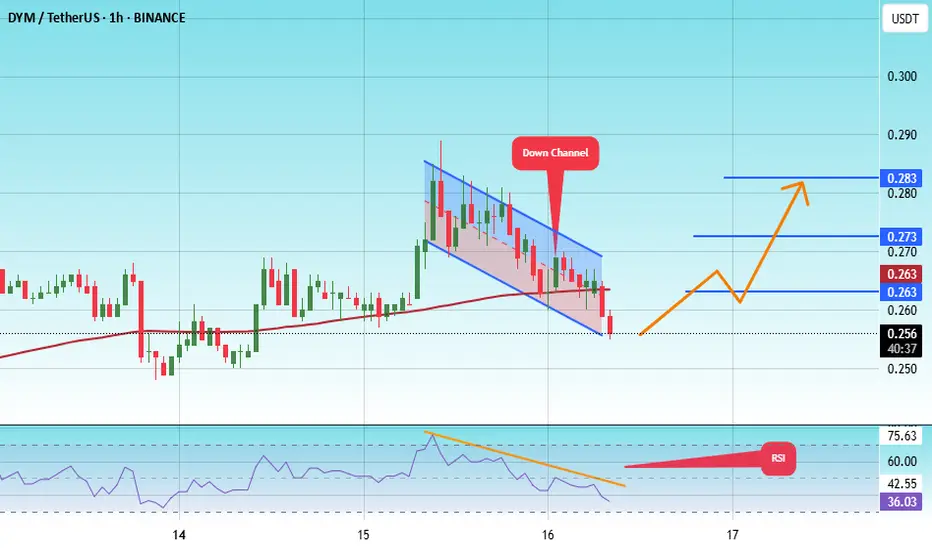
#DYM/USDT#DYM
The price is moving within a descending channel on the 1-hour frame, adhering well to it, and is heading for a strong breakout and retest.
We are seeing a bounce from the lower boundary of the descending channel, which is support at 0.270.
We have a downtrend on the RSI indicator that is about to be broken and retested, supporting the upward trend.
We are looking for stability above the 100 moving average.
Entry price: 0.276
First target: 0.281
Second target: 0.288
Third target: 0.296

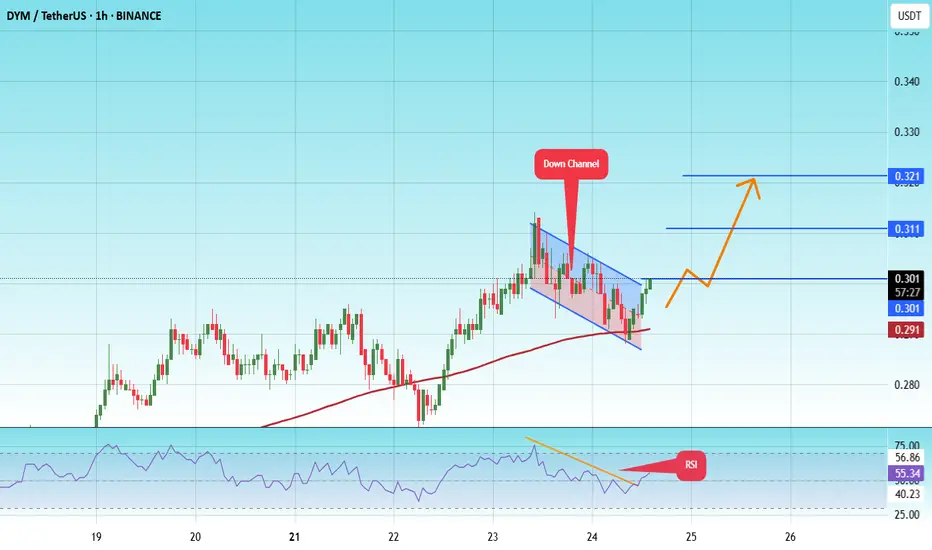
#DYM/USDT#DYM
The price is moving within a descending channel on the 1-hour frame, adhering well to it, and is heading for a strong breakout and retest.
We are seeing a bounce from the lower boundary of the descending channel, which is support at 0.255.
We have a downtrend on the RSI indicator that is about to break and retest, supporting the upward trend.
We are looking for stability above the 100 moving average.
Entry price: 0.257
First target: 0.263
Second target: 0.273
Third target: 0.283
#DYM/USDT#DYM
The price is moving within a descending channel on the 1-hour frame, adhering well to it, and is heading for a strong breakout and retest.
We are experiencing a rebound from the lower boundary of the descending channel, which is support at 0.260.
We are experiencing a downtrend on the RSI indicator, which is about to break and retest, supporting the upward trend.
We are looking for stability above the 100 moving average.
Entry price: 0.265
First target: 0.270
Second target: 0.278
Third target: 0.284
#DYM/USDT#DYM
The price is moving within a descending channel on the 1-hour frame and is expected to continue upward.
We have a trend to stabilize above the 100 moving average once again.
We have a downtrend on the RSI indicator, supporting the upward move with a breakout.
We have a support area at the lower boundary of the channel at 0.250.
Entry price: 0.255
First target: 0.257
Second target: 0.262
Third target: 0.0267
#DYM/USDT#DYM
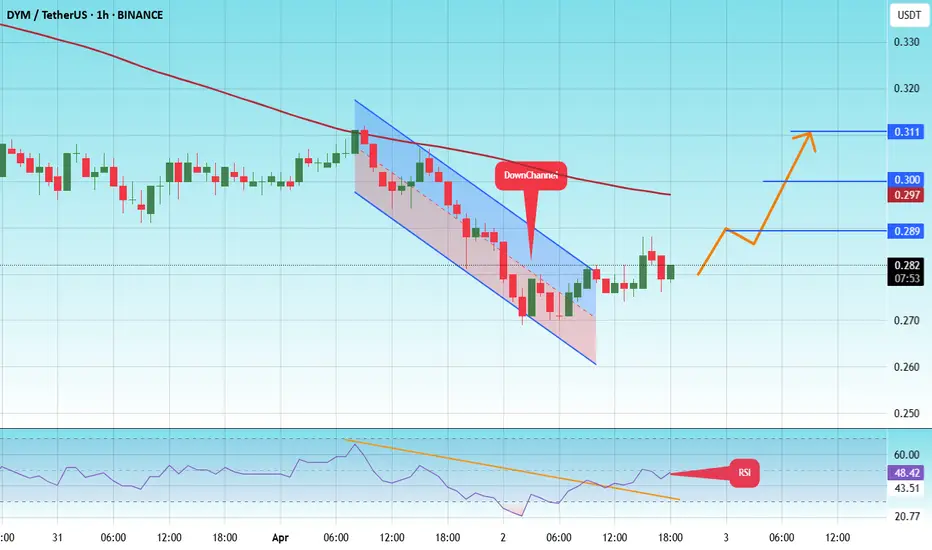
The price is moving within a descending channel on the 1-hour frame and is expected to continue upward.
We have a trend to stabilize above the 100 moving average once again.
We have a downtrend on the RSI indicator that supports the upward move with a breakout.
We have a support area at the lower limit of the channel at 0.266.
Entry price: 0.282
First target: 0.288
Second target: 0.300
Third target: 0.311
#DYM/USDT#DYM
The price is moving within a descending channel on the 1-hour frame and is expected to continue lower.
We have a trend to stabilize below the 100 moving average once again.
We have a downtrend on the RSI indicator, supporting the upward trend with a break above it.
We have a support area at the upper limit of the channel at 0.330.
Entry price: 0.328
First target: 0.325
Second target: 0.317
Third target: 0.310

#DYM/USDT#DYM
The price is moving within a descending channel on the 1-hour frame, adhering well to it, and is on its way to breaking it strongly upwards and retesting it.
We are seeing a bounce from the lower boundary of the descending channel, which is support at 0.350.
We have a downtrend on the RSI indicator that is about to break and retest, which supports the upward trend.
We are looking for stability above the 100 moving average.
Entry price: 0.365
First target: 0.376
Second target: 0.385
Third target: 0.397
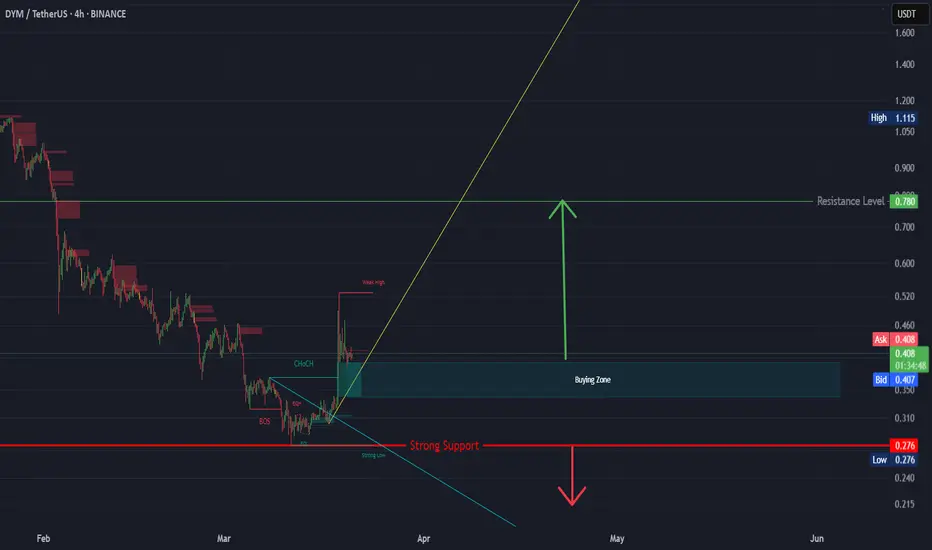
DYM (SPOT)BINANCE:DYMUSDT
DYM / USDT
4H time frame ( wait for the price to come to buying zone)
analysis tools
____________
SMC
FVG
Trend lines
Fibonacci
Support & resistance
MACD Cross
EMA Cross
______________________________________________________________
Golden Advices.
********************
* Please calculate your losses before any entry.
* Do not enter any trade you find it not suitable for you.
* No FOMO - No Rush , it is a long journey.
Useful Tags.
****************
My total posts
tradingview.sweetlogin.com
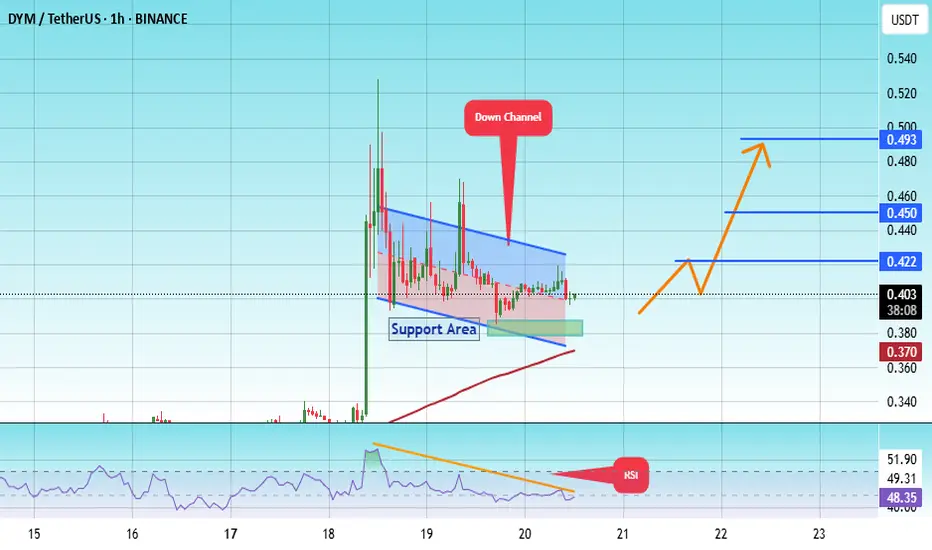
#DYM/USDT#DYM
The price is moving within a descending channel on the 1-hour frame, adhering well to it, and is on its way to breaking it strongly upwards and retesting it.
We are seeing a bounce from the lower boundary of the descending channel, this support at 0.380.
We have a downtrend on the RSI indicator that is about to break and retest, supporting the upward trend.
We are looking for stability above the 100 moving average.
Entry price: 0.400
First target: 0.422
Second target: 0.450
Third target: 0.493
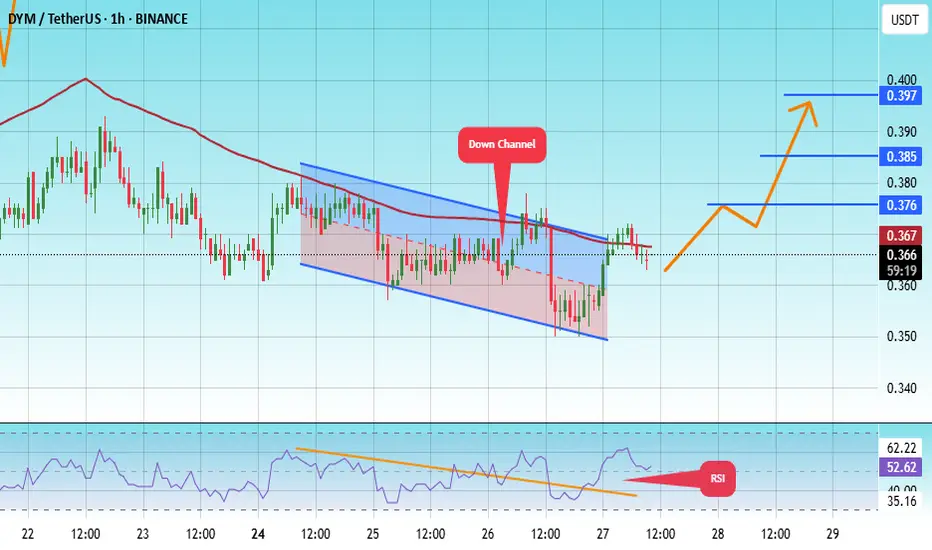
#DYM/USDT#DYM
The price is moving in a descending channel on the 1-hour frame and is adhering to it well and is heading to break it strongly upwards and retest it
We have a bounce from the lower limit of the descending channel, this support is at a price of 0.330
We have a downtrend on the RSI indicator that is about to break and retest, which supports the rise
We have a trend to stabilize above the moving average 100
Entry price 0.343
First target 0.369
Second target 0.392
Third target 0.418

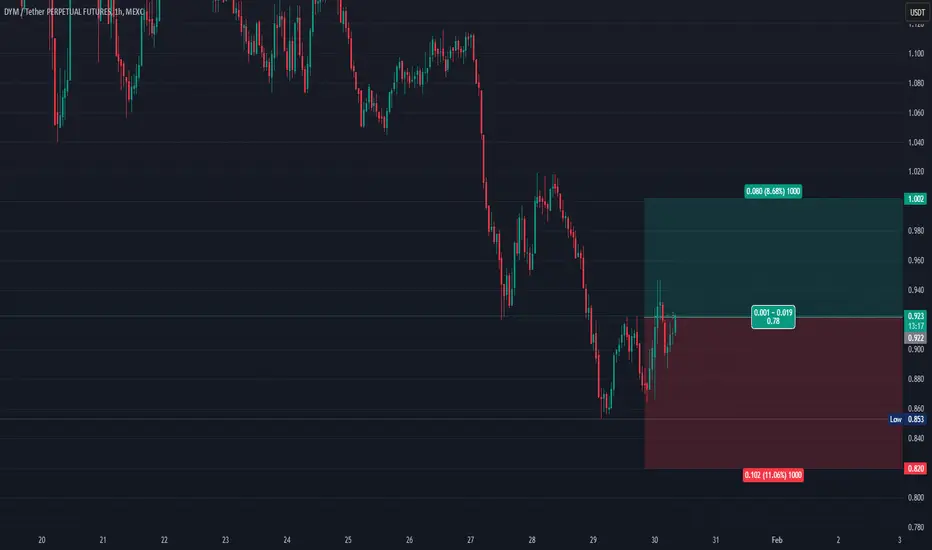
#DYMUSDT is showing signs of growth📉 Long BYBIT:DYMUSDT.P от $0,4575
🛡 Stop loss $0,4350
🕒 1H Timeframe
⚡️ Overview:
➡️ The main POC (Point of Control) is at 0,4149, indicating the area with the highest trading volume.
➡️ The 0,4572 level acts as a local support, as the price previously bounced from this zone.
🎯 TP Targets:
💎 TP 1: $0,4720
💎 TP 2: $0,4850
💎 TP 2: $0,4970
📢 Monitor key levels before entering the trade!
📢 If 0,4572 is broken downward, the trade may be invalidated.
BYBIT:DYMUSDT.P is showing signs of growth — expecting further upside movement!

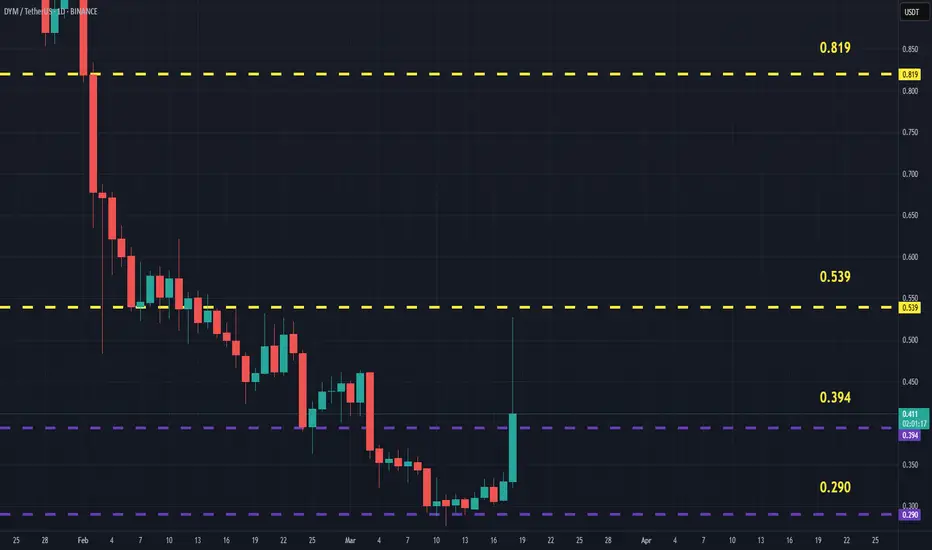
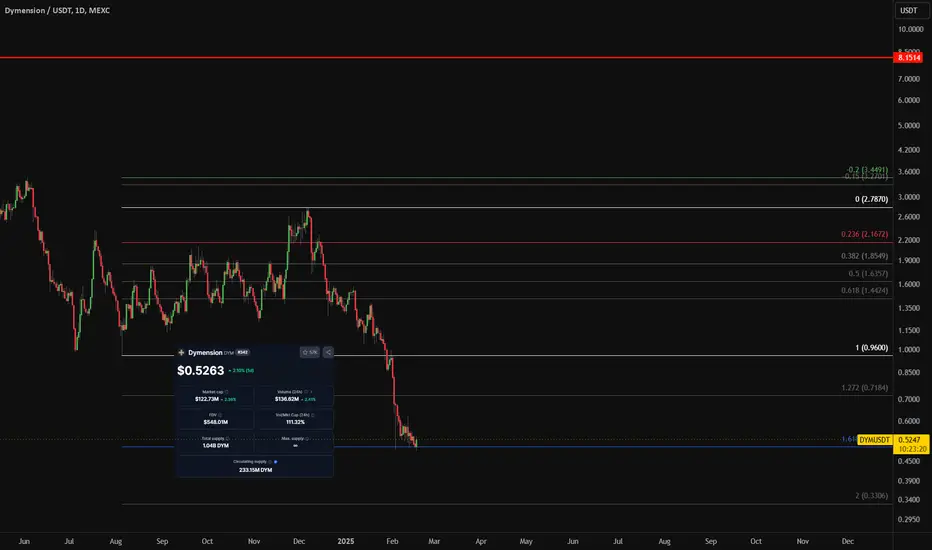
DYMUSDT(dymension) Updated till 18-03-25DYMUSDT(dymension) Daily timeframe range. PA is very close to its price discovery level its better if it can stay above it. range level gap for lack of data its huge here. for that if pullback happens it will be hard. if cant stay above 0.394 back to its low.
Dymension (DYM) - A quick 500% returnOn the above daily chart price action has corrected 90% inside the last 90 days. A number of reasons to take advantage of the situation, they include:
1) Price action and RSI resistance breakouts.
2) RSI trend reversal, higher lows print.
3) Significant confluence on past support / resistance (red circles) with regular bullish divergence.
4) The first big resistance is around 2.60 or 700% above.
Is it possible sellers keep selling after a 90% correction? Sure, you know emotions.
Is it probable? No.
Ww

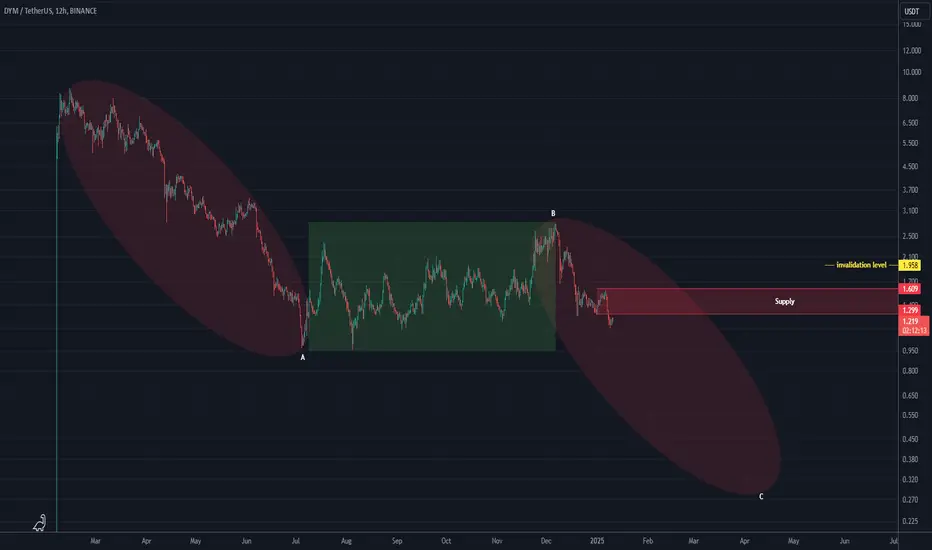
looks DYM is bearish in the medium term (12H)We had a downward move, followed by a pause, and then the price is continuing to decline. When the bottom of the green box at $0.963 is broken with a daily candle, we will have further confirmation.
These fractals can be labeled as ABC waves.
However, for those looking for sell/short positions, the red box can be a potential zone to consider. The closing of a daily candle above the invalidation level will invalidate this analysis.
For risk management, please don't forget stop loss and capital management
Comment if you have any questions
Thank You
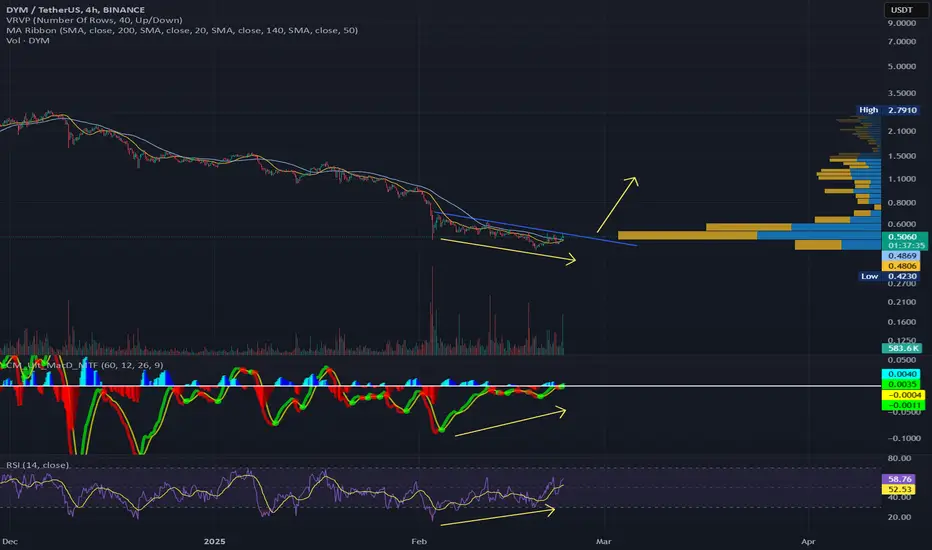
DYM - Positive DivergencePrice trending lower with momentum indicators trending higher.
Selling overdone - a move above that resistance could be explosive.
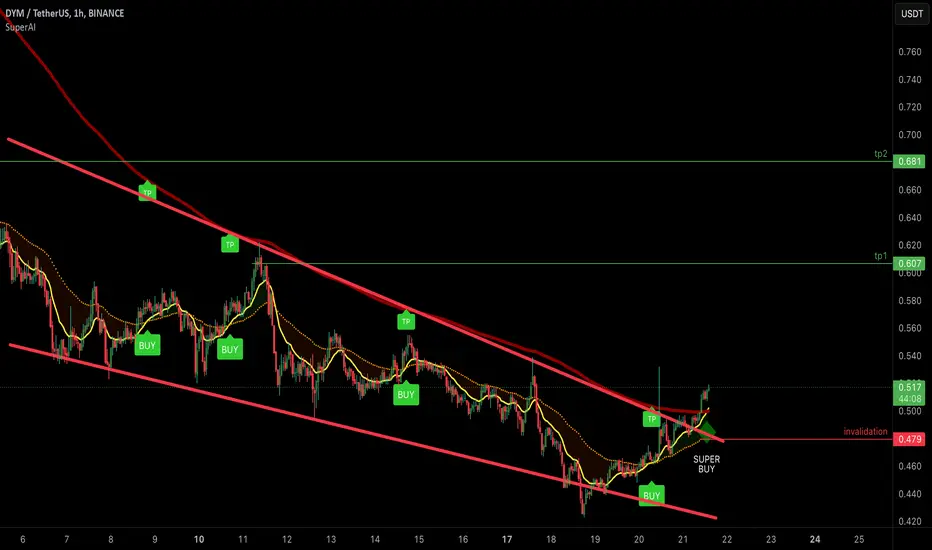
$dym Dymension's Falling Wedge.. Will it Rise?ASX:DYM falling wedge. SuperBuy Spotted! NFA
Current price: 0.51
Continous Break out of Falling Wedge will lead to Targets: 0.60, 0.68
Invalidation under 0.47
#DYM #dymension
Great Vol/MktCap projectWith a combined volume of over 130M in the last 24hrs, and a marketcap around 100M, I am adding DYM to my portfolio. This project is one to keep an eye on!
Dym/usdt LongMEXC:DYMUSDT.P
dym usdt long
from, 0.91-0.85 buy zone
use 75 x leverage
tp
1. 0.93.5
2. 0.94.5
3. 0.95.5
4. 0.96
5. 0.99
stoploss 0.93
Time to buy DYM?I am expecting the continuation of this bearish move until the price reaches $0.85 or even $0.80 in the worst case scenario, and that can be the bottom if we see 🐂 ish 🕯s from there.
$1.10, $2, $3 can be the targets.