US30 Bullish Bias Builds on Fed and Earnings OptimismUS30 – Market Overview
The market is showing bullish momentum, supported by recent developments from the Federal Reserve and a strong corporate earnings season.
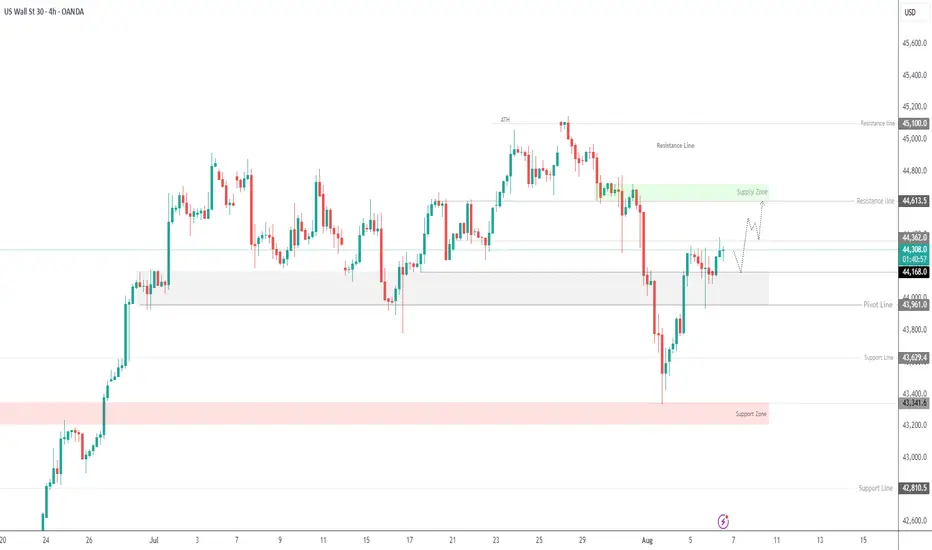
Technically, the price action suggests a continuation of the uptrend toward 44610.
🔻 However, bearish momentum may be triggered if the price breaks below 44170.
🔹 Resistance: 44360, 44610 – 44820
🔹 Support: 44170 – 43960 – 43630
DOWUSD trade ideas
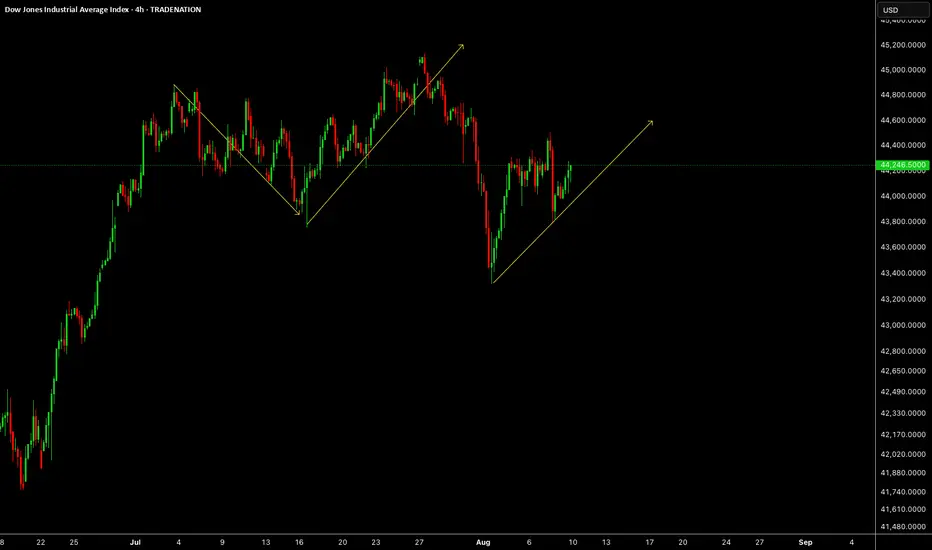
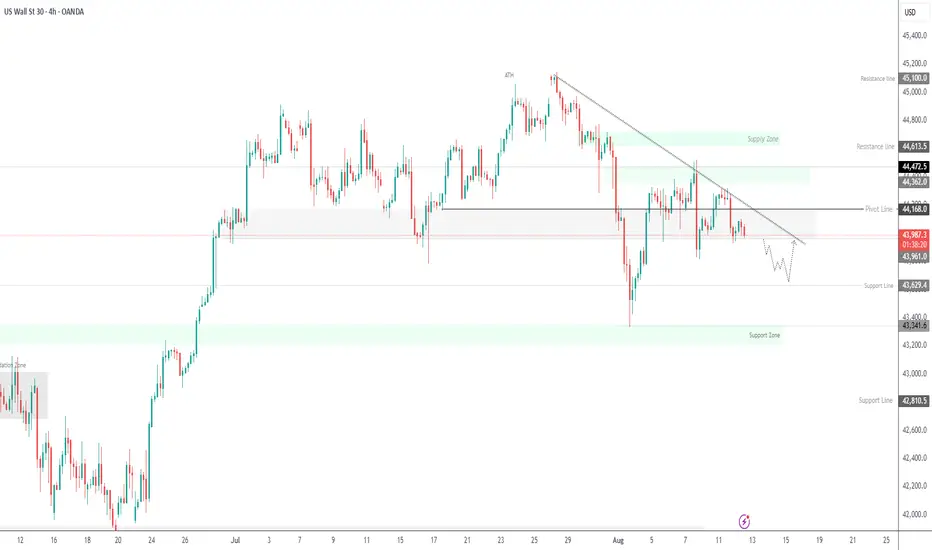
US30US30 needs some more correction downside short term before going up to take ATH.
Disclosure: We are part of Trade Nation's Influencer program and receive a monthly fee for using their TradingView charts in our analysis.
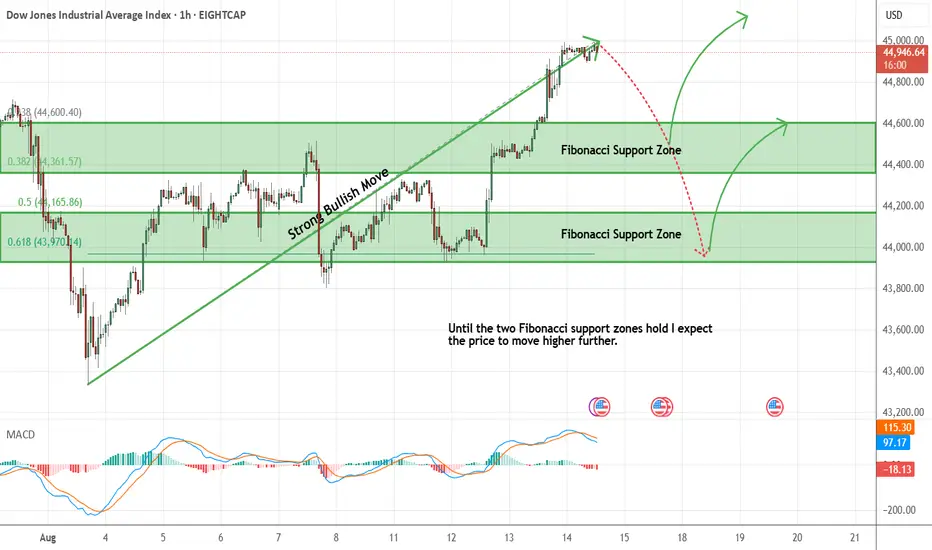
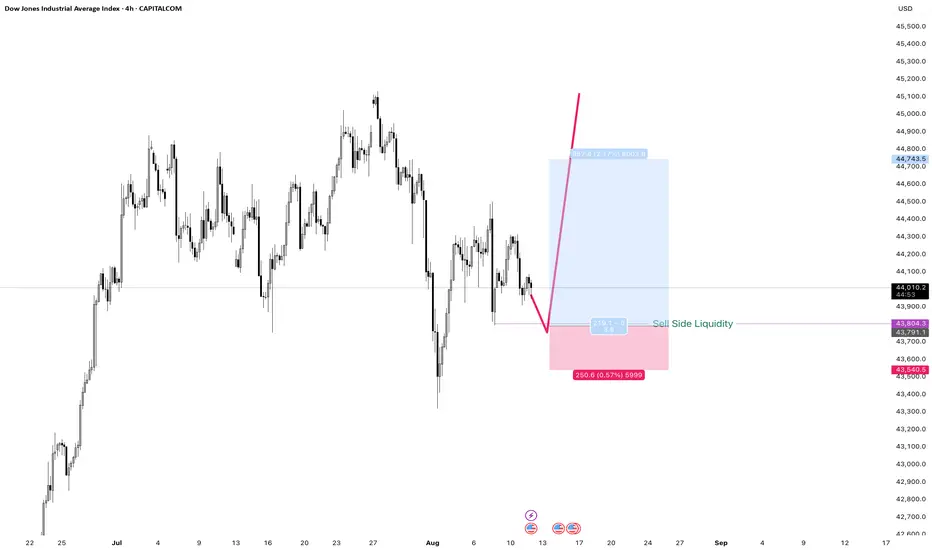
Dow Jones - Expecting Bullish Continuation In The Short TermH1 - Strong bullish momentum.
No opposite signs.
Until the two Fibonacci support zones hold I expect the price to move higher further.
If you enjoy this idea, don’t forget to LIKE 👍, FOLLOW ✅, SHARE 🙌, and COMMENT ✍! Drop your thoughts and charts below to keep the discussion going. Your support helps keep this content free and reach more people! 🚀
--------------------------------------------------------------------------------------------------------------------
US30 | CPI Data to Set the Next Big MoveU.S. Stock Index Futures – CPI in Focus
U.S. stock index futures traded flat on Tuesday as investors remained cautious ahead of a key inflation report that could shape expectations for the Federal Reserve’s next policy move.
CPI Scenarios:
A reading above 2.8% would likely support a bearish move toward 43630 and 43350.
A reading below 2.8% could fuel a bullish move toward 44170 and 44430.
Technical Levels:
Pivot: 43960
Support: 43770, 43630, 43350
Resistance: 44170, 44320, 44470
US30 Bleeding.Greetings Family. I'm seeing a very clear selling opportunities on EIGHTCAP:US30 , so i brought the case to the attention of team TradingView community so that we can look into the situation together.

DOW JONES - STRONG SUPPORT BOUNCE INSIDE CHANNEL UP
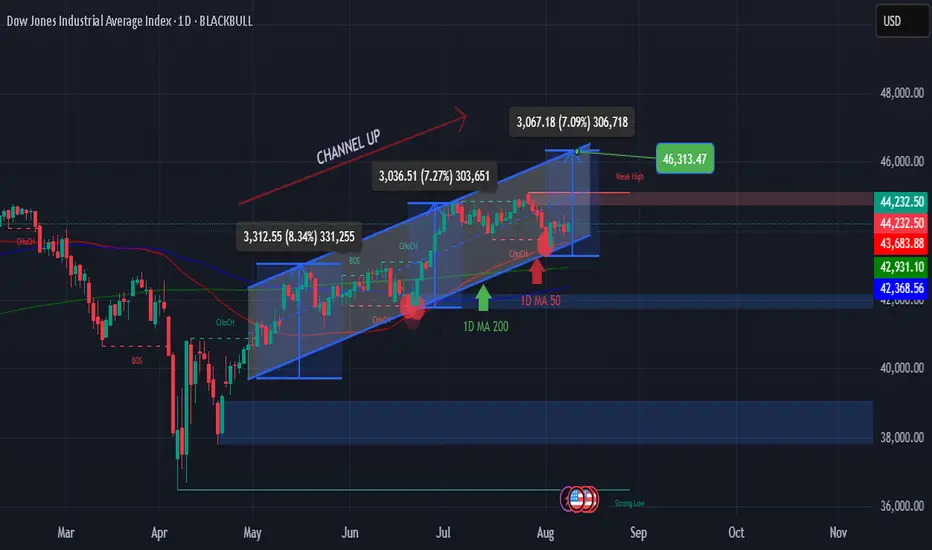
The Dow Jones (DJI) has been moving inside a Channel Up since the April 25 low. Right now, price is consolidating after touching and bouncing from the 1D MA50 (blue line), which also aligns with the bottom of the Channel.
This area forms a Higher Low, which is one of the strongest technical supports.
The 1D RSI is also bouncing from the same level as the last Higher Low, increasing the chance of another bullish wave inside the Channel.
In the last two bullish legs, price gained at least +7%. Based on that, our short-term target is 46,350.
🟢 KAIZO US30 REPORT
🎯 Setup: BUY 📈
🔹 Entry: 44,000 – 44,200
🛑 Stop Loss: 42,930
✅ Take Profit: 46,313
📶 Confidence: High (85%)
💬 “Strong support means strong opportunities.”
#DJI #DowJones #StockMarket #ChannelUp #Kaizo
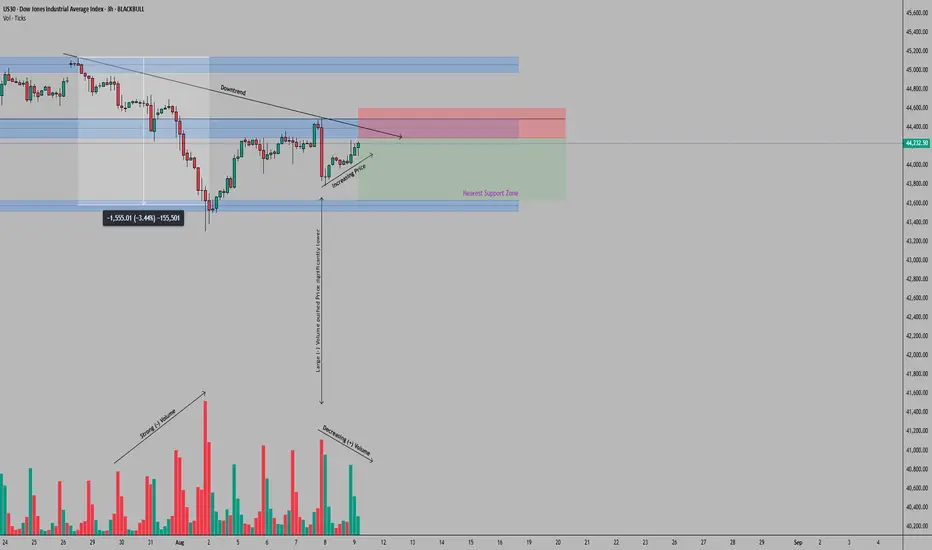
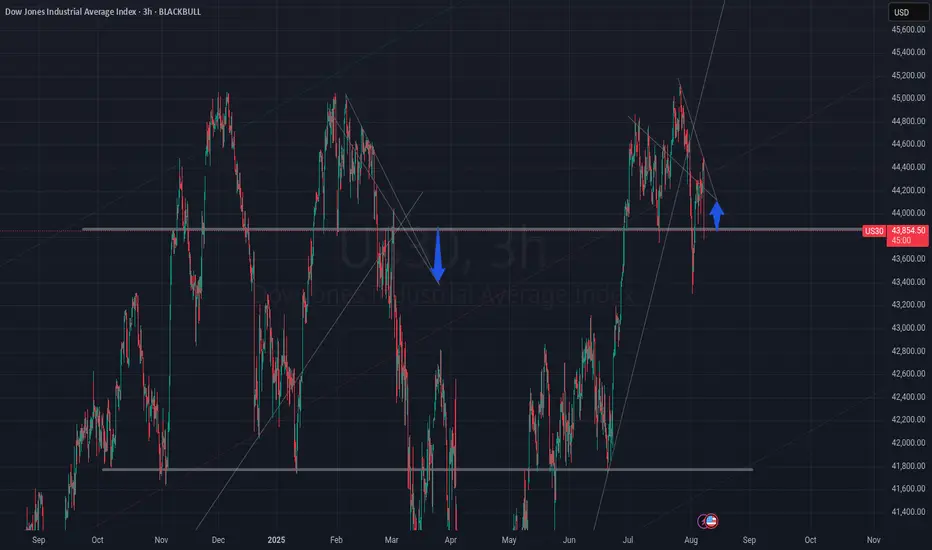
US30 (Dow Jones Industrial Index) Trade Setup – 3H TimeframeOn the 3-hour timeframe, US30 has established a clear bearish structure following its July 28, 2025 all-time high just above the 45,000 mark. The initial sharp decline from this level, characterized by strong negative volume, found support at 43,550 after a 3.44% correction. What's particularly noteworthy is the subsequent price action at the 44,400 level, which has transitioned from support to resistance, confirmed by a high-volume rejection on August 7.
The current market structure shows weakening momentum on recovery attempts, with declining positive volume as price tests the 44,400 barrier. This volume pattern, combined with the established downward trendline from the 45,126.50 ATH, suggests sellers remain in control of the short-term price action.
Illustrative Setup: A Sell Limit order at 44,290 aligns with the lower boundary of the resistance zone. The Stop Loss placement at 44,605 provides protection above both the 44,400 resistance and the descending trendline, offering clear invalidation if breached. The Take Profit target at 43,550 corresponds with the recent support level, where strong buying interest previously emerged, pushing price back up. This configuration yields a risk-reward ratio of 2.1:1, respecting the recent price action dynamics.
Key consideration: The high-volume rejection at 44,400 and subsequent declining volume on recovery attempts suggest institutional selling pressure remains dominant. However, traders should remain mindful that the broader market structure is still bullish despite this correction phase.
This analysis is provided solely for educational and entertainment purposes and does not constitute any form of financial or investment advice. Always manage your risk and trade responsibly.
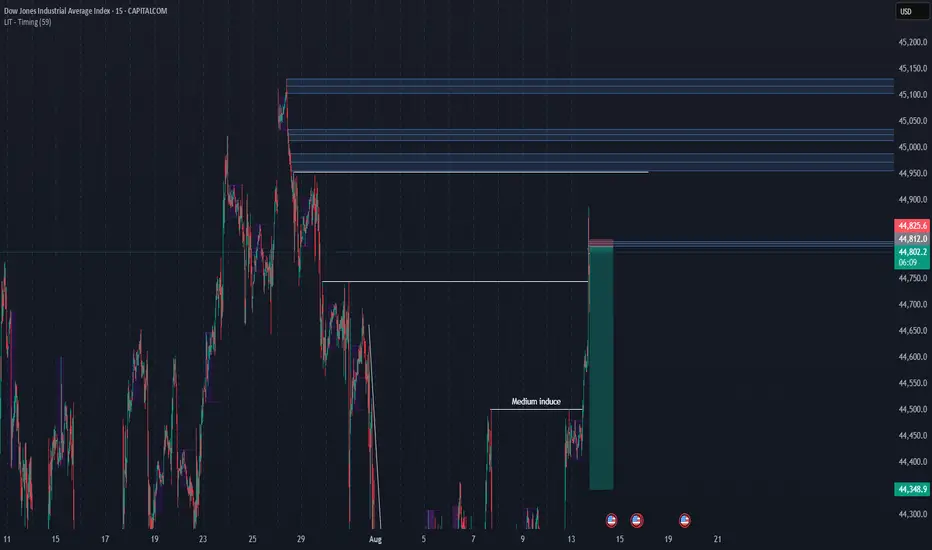
Dow moneyGot multiple daily candles giving context to one side. NY session taken. Looking to take out created sellers which will happen shortly. Take a good look at the certain levels on the chart on the daily. 15 min execution off 1h cycles from daily money. Lets work ! Working towards mastering us30 only for some years going forward, one flow one mission.
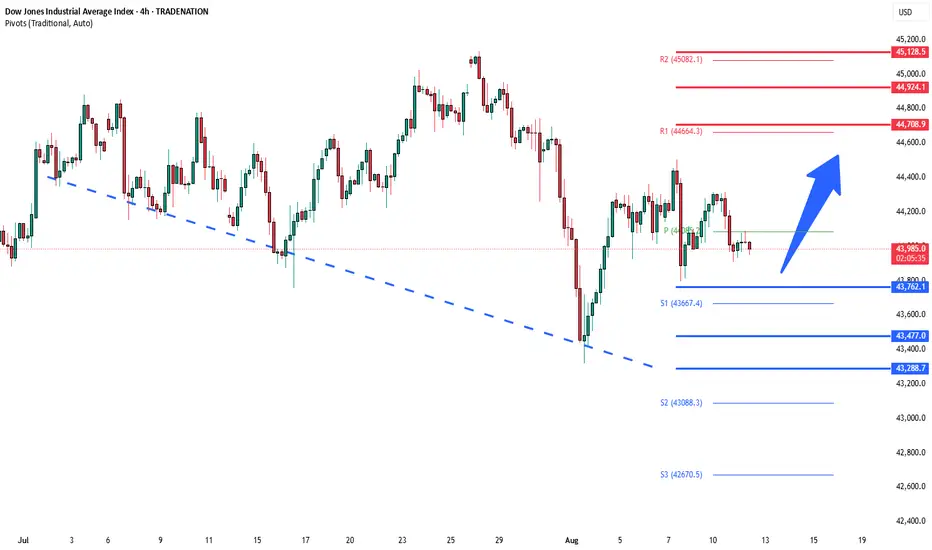
DowJones ahead of US Inflation data capped by 44700Key Support and Resistance Levels
Resistance Level 1: 44700
Resistance Level 2: 44924
Resistance Level 3: 45130
Support Level 1: 43760
Support Level 2: 43477
Support Level 3: 43288
This communication is for informational purposes only and should not be viewed as any form of recommendation as to a particular course of action or as investment advice. It is not intended as an offer or solicitation for the purchase or sale of any financial instrument or as an official confirmation of any transaction. Opinions, estimates and assumptions expressed herein are made as of the date of this communication and are subject to change without notice. This communication has been prepared based upon information, including market prices, data and other information, believed to be reliable; however, Trade Nation does not warrant its completeness or accuracy. All market prices and market data contained in or attached to this communication are indicative and subject to change without notice.
Scalp short First entry got cooked. Second entry might be the better Idea.
Overall I am bullish for the swing trade idea. We shall see.
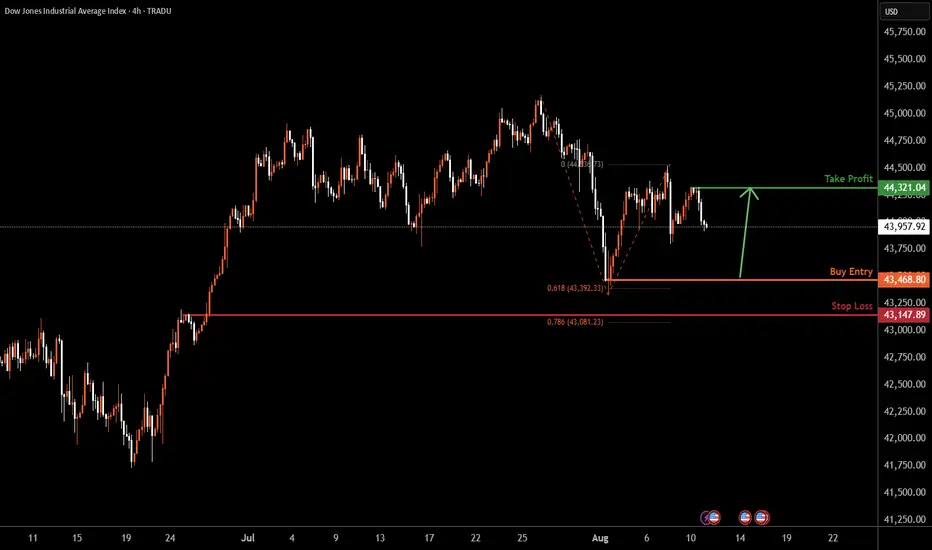
US30 H4 | Falling towards pullback supportBased on the H4 chart analysis, we could see the price fall to the buy entr at 43,468.80, which is a swing low support that is slightly above the 61.8% Fibonacci projection.
Stop loss is at 43,147.89, whihc is a pullback support that is slighlty above the 78.6% Fibonacci retracement.
Take profit is at 44,321.04, which is a swing high ressitance.
High Risk Investment Warning
Trading Forex/CFDs on margin carries a high level of risk and may not be suitable for all investors. Leverage can work against you.
Stratos Markets Limited (tradu.com ):
CFDs are complex instruments and come with a high risk of losing money rapidly due to leverage. 65% of retail investor accounts lose money when trading CFDs with this provider. You should consider whether you understand how CFDs work and whether you can afford to take the high risk of losing your money.
Stratos Europe Ltd (tradu.com ):
CFDs are complex instruments and come with a high risk of losing money rapidly due to leverage. 66% of retail investor accounts lose money when trading CFDs with this provider. You should consider whether you understand how CFDs work and whether you can afford to take the high risk of losing your money.
Stratos Global LLC (tradu.com ):
Losses can exceed deposits.
Please be advised that the information presented on TradingView is provided to Tradu (‘Company’, ‘we’) by a third-party provider (‘TFA Global Pte Ltd’). Please be reminded that you are solely responsible for the trading decisions on your account. There is a very high degree of risk involved in trading. Any information and/or content is intended entirely for research, educational and informational purposes only and does not constitute investment or consultation advice or investment strategy. The information is not tailored to the investment needs of any specific person and therefore does not involve a consideration of any of the investment objectives, financial situation or needs of any viewer that may receive it. Kindly also note that past performance is not a reliable indicator of future results. Actual results may differ materially from those anticipated in forward-looking or past performance statements. We assume no liability as to the accuracy or completeness of any of the information and/or content provided herein and the Company cannot be held responsible for any omission, mistake nor for any loss or damage including without limitation to any loss of profit which may arise from reliance on any information supplied by TFA Global Pte Ltd.
The speaker(s) is neither an employee, agent nor representative of Tradu and is therefore acting independently. The opinions given are their own, constitute general market commentary, and do not constitute the opinion or advice of Tradu or any form of personal or investment advice. Tradu neither endorses nor guarantees offerings of third-party speakers, nor is Tradu responsible for the content, veracity or opinions of third-party speakers, presenters or participants.
dow sellits maybe, but im still on sell side. its may hit stop los , bcz very thick stop. but i love to get this .
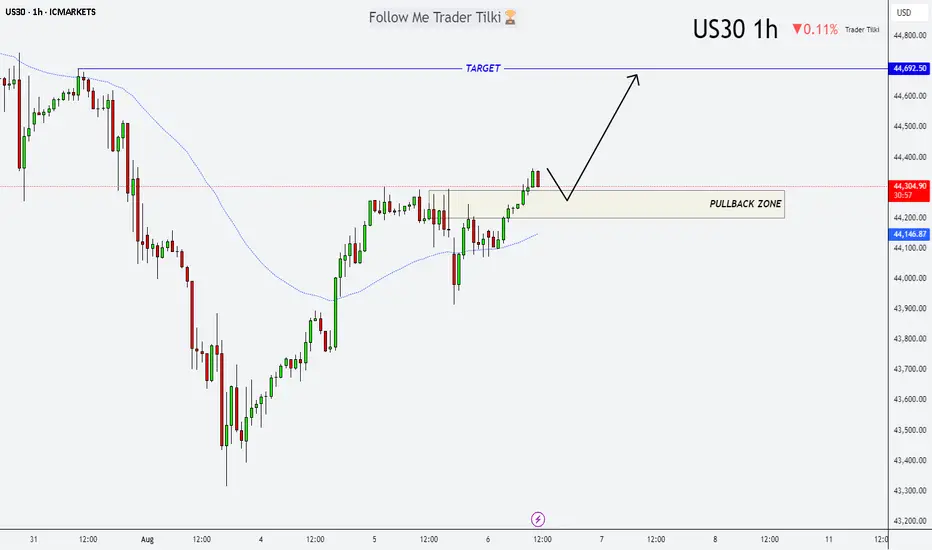
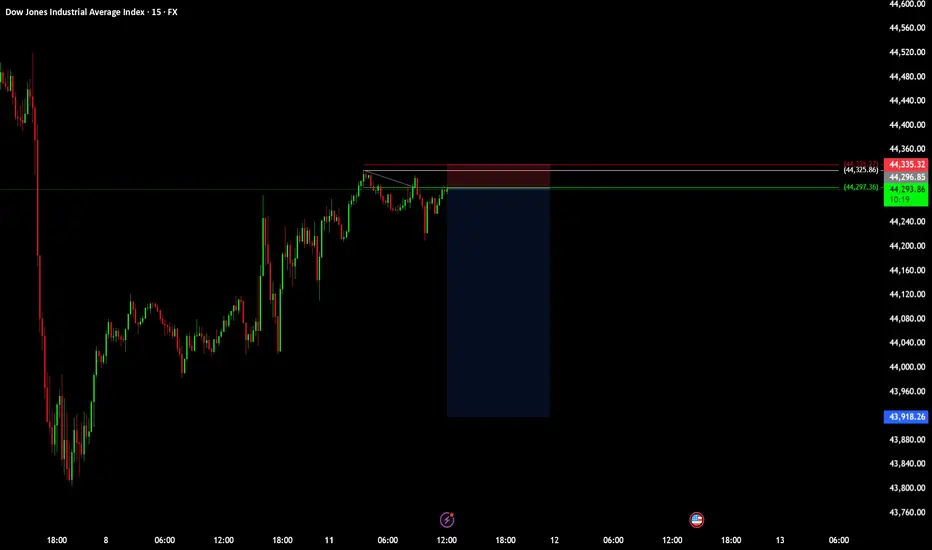
US30 at the Turn: Buy Setup from the Pullback ZoneHey friends 👋
Here’s my latest analysis on US30 (Dow Jones). I’m watching a potential pullback into the zone I marked: 44,292 – 44,190. I plan to open a buy position from that range, targeting 44,692 as my take-profit level.
Every single like you send is a huge source of motivation for me to keep sharing these insights. Big thanks to everyone supporting with a tap of appreciation 🙏
US30 CPI trade idea 12-aug-2025Expecting sharp move down side at cpi event, an dgrap sell side liquidity than whole day upside , expecting to grap buy side liquidity
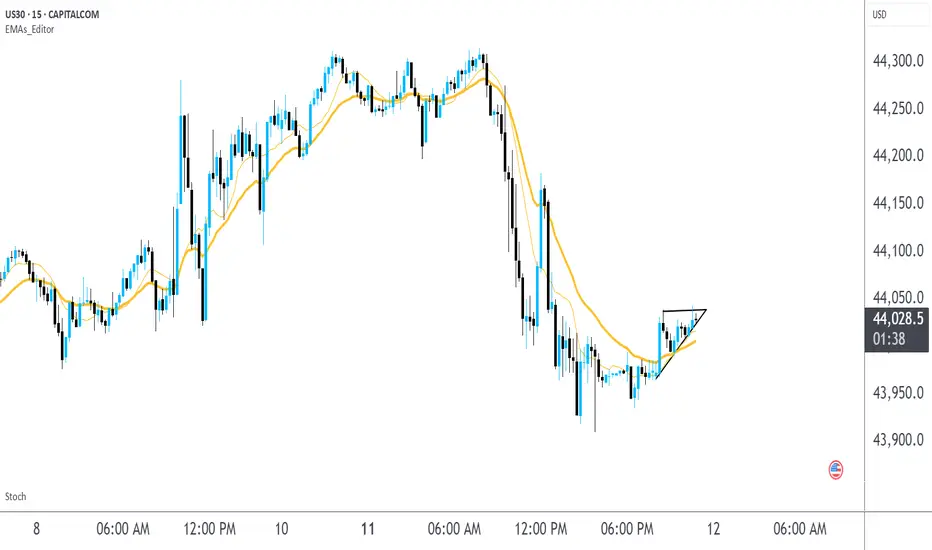
US30There's a clear bullish flag pattern and strong price action on the 1 minute timeframe. I expect at least a small rally long with a high R:R based of the 1 minute timeframe 1:3R+
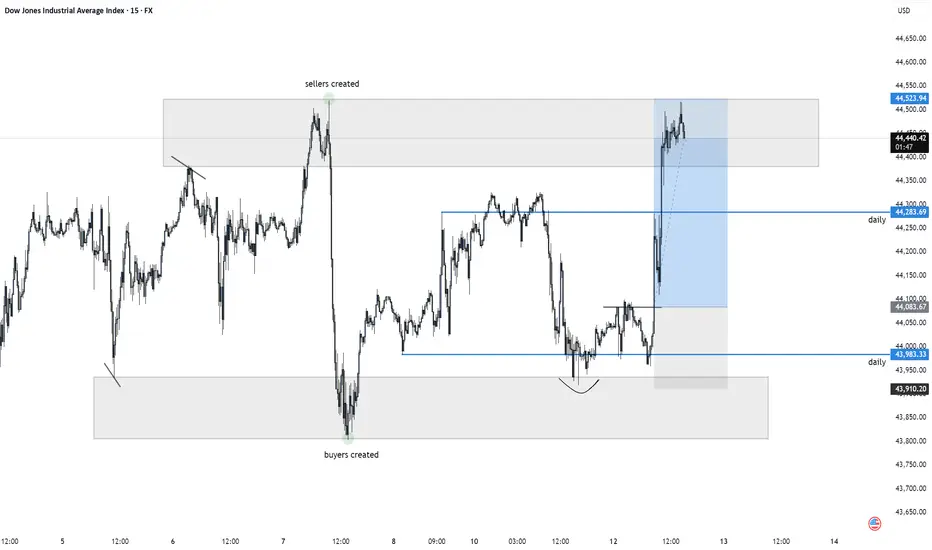
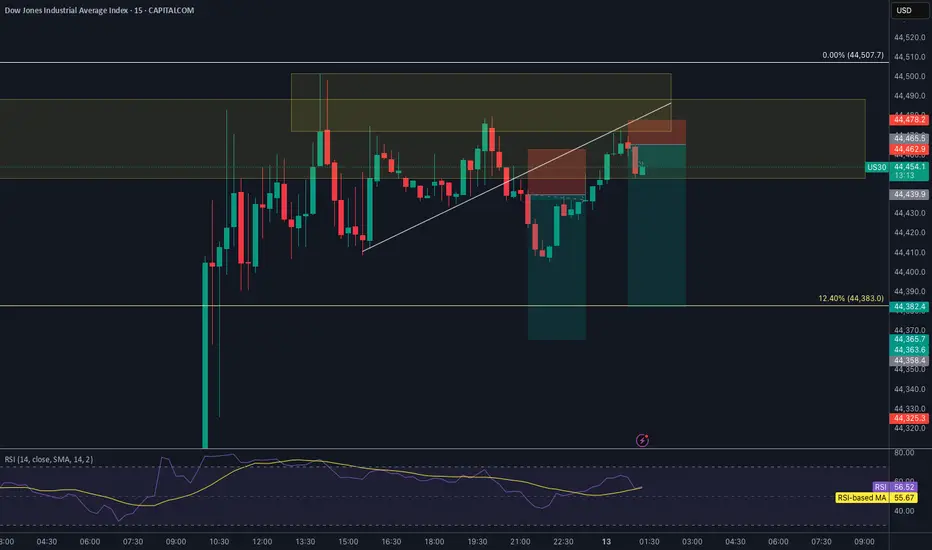
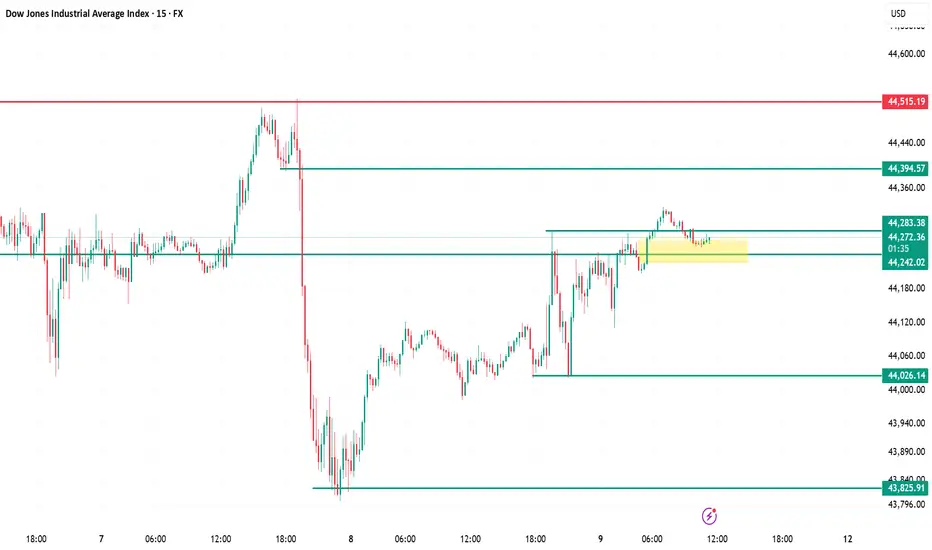
Dow Jones 15m Chart Analysis Current Position – Price is consolidating in the 44,242–44,283 demand zone after a bullish push, showing buyers defending support.
Upside Levels – Break and close above 44,394 can trigger momentum toward 44,515 (major liquidity zone).
Downside Risk – Failure to hold 44,242 likely sends price to 44,026 first, then 43,826 (previous swing low demand).
Market Structure – Short-term bullish above 44,242; turns bearish below it. Volume breakout confirmation is key for conviction.
Trading Approach – Range trade between 44,242–44,394 until a confirmed breakout; trade with tight stops to avoid whipsaws
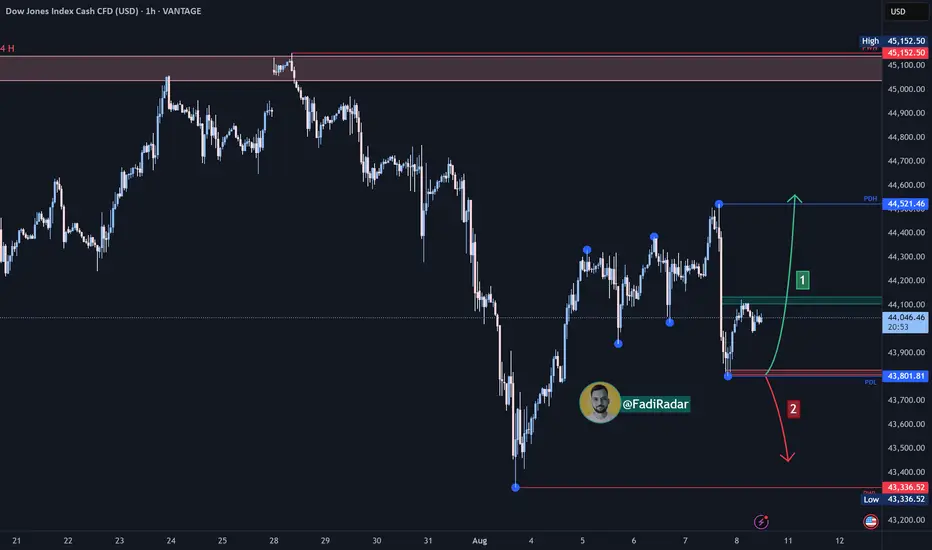
Dow Jones Index (US30 / Dow Jones) Analysis:The Dow Jones index is currently moving sideways and is trading near the $44,000 level.
🔻 Bearish Scenario:
If selling pressure leads to a break below the $43,800 area, the index may drop to test the $43,300 level, which is considered a critical support in the short term.
🔺 Bullish Scenario:
The price may test PDL (Previous Day Low) at $43,800 as a support zone and bounce upward. If the index breaks and holds above $44,100, this could lead to a continuation toward $44,520, and then to $45,000, a key resistance zone.
⚠️ Disclaimer:
This analysis is not financial advice. It is recommended to monitor the markets and carefully analyze the data before making any investment decisions.
Dow jonesDow Jones daily analysis
Time frame daily
Risk rewards ratio >3.5
Short position
Because price couldn't break the 45.048 again and earthquake in 5he east of Russia and Japan makes the markets drop down

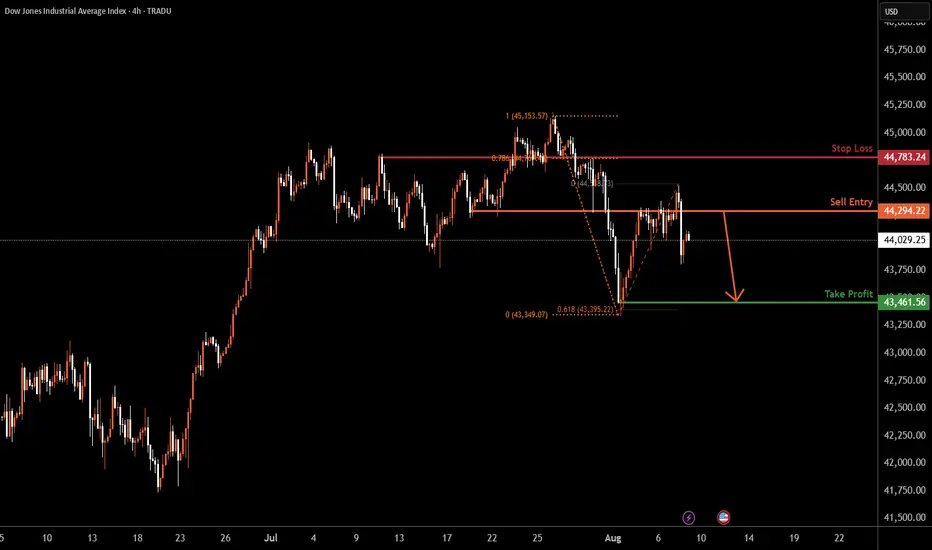
US30 H4 | Bearish drop off pullback resistanceBased on the H4 chart analysis, we could see the price rise to the sell entry at 44,294.22, which is a pullback resistance and could reverse to the downside.
Stop loss is at 44,783.24, which is an overlap resistance that aligns with the 78.6% Fibonacci retracement.
Take profit is at 43,461.56, which is a swing low support that is slightly above the 61.8% Fibonacci projection.
High Risk Investment Warning
Trading Forex/CFDs on margin carries a high level of risk and may not be suitable for all investors. Leverage can work against you.
Stratos Markets Limited (tradu.com ):
CFDs are complex instruments and come with a high risk of losing money rapidly due to leverage. 65% of retail investor accounts lose money when trading CFDs with this provider. You should consider whether you understand how CFDs work and whether you can afford to take the high risk of losing your money.
Stratos Europe Ltd (tradu.com ):
CFDs are complex instruments and come with a high risk of losing money rapidly due to leverage. 66% of retail investor accounts lose money when trading CFDs with this provider. You should consider whether you understand how CFDs work and whether you can afford to take the high risk of losing your money.
Stratos Global LLC (tradu.com ):
Losses can exceed deposits.
Please be advised that the information presented on TradingView is provided to Tradu (‘Company’, ‘we’) by a third-party provider (‘TFA Global Pte Ltd’). Please be reminded that you are solely responsible for the trading decisions on your account. There is a very high degree of risk involved in trading. Any information and/or content is intended entirely for research, educational and informational purposes only and does not constitute investment or consultation advice or investment strategy. The information is not tailored to the investment needs of any specific person and therefore does not involve a consideration of any of the investment objectives, financial situation or needs of any viewer that may receive it. Kindly also note that past performance is not a reliable indicator of future results. Actual results may differ materially from those anticipated in forward-looking or past performance statements. We assume no liability as to the accuracy or completeness of any of the information and/or content provided herein and the Company cannot be held responsible for any omission, mistake nor for any loss or damage including without limitation to any loss of profit which may arise from reliance on any information supplied by TFA Global Pte Ltd.
The speaker(s) is neither an employee, agent nor representative of Tradu and is therefore acting independently. The opinions given are their own, constitute general market commentary, and do not constitute the opinion or advice of Tradu or any form of personal or investment advice. Tradu neither endorses nor guarantees offerings of third-party speakers, nor is Tradu responsible for the content, veracity or opinions of third-party speakers, presenters or participants.
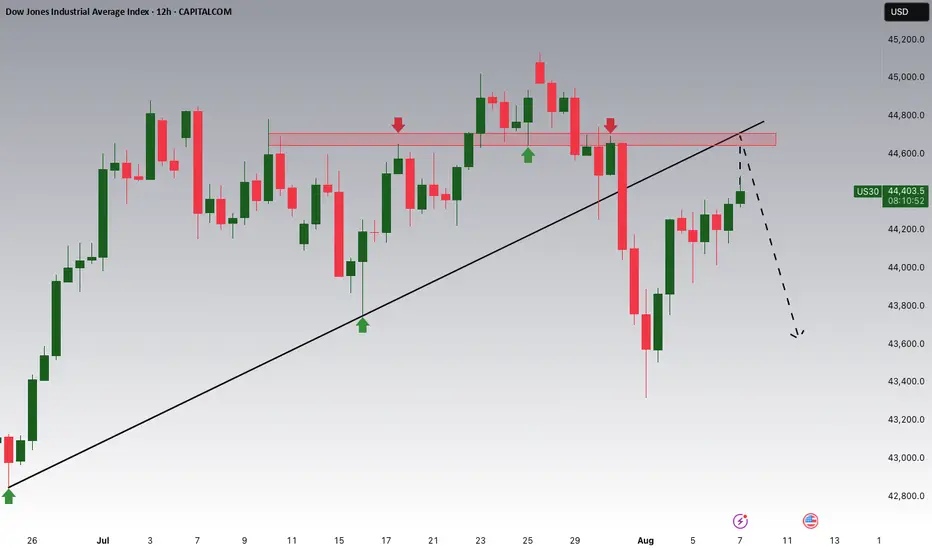
Dow Jones Breakout and Potential RetraceHey Traders, in today's trading session we are monitoring US30 for a selling opportunity around 44,650 zone, Dow Jones was trading in an uptrend and successfully managed to break it out. Currently is in a correction phase in which it is approaching the retrace area at 44,650 support and resistance area.
Trade safe, Joe.
Aug ~12th UpEssentially, the resistance below has turned into a huge wall of support.
Going to need a few days to consolidate, but the ingredients are there and ready to cook. Maybe not exactly on the 12th. Expect rally to last until early Sept. once it starts.
Not giving any start or SL because I suck at technical analysis. You do you.
Short term idea on Ym (US30 Spot)Based on:
- Supply zone
- Different indices setup for short
- correlatoon between ethereum and indices indicate a potential short
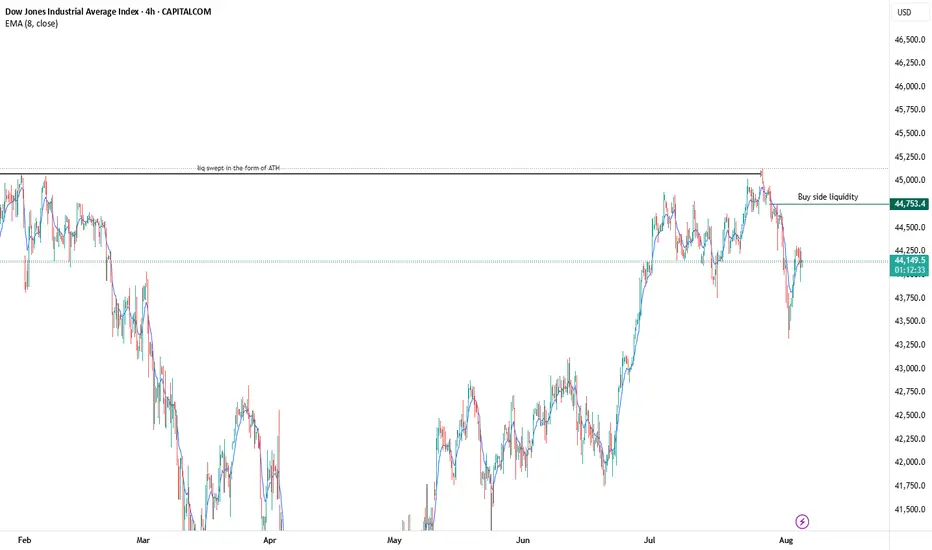
US30 Sell offmajor move to the downside coming up, once we get the buyside liquidity sweep ill be looking for a heavy short position. Liquidity has already been sept in the form of equal high at the area of all time high. the internal liquidity is what I'm looking for to get swept, then its all down hill from there. I will be holding this until it reaches a daily or monthly demand zone