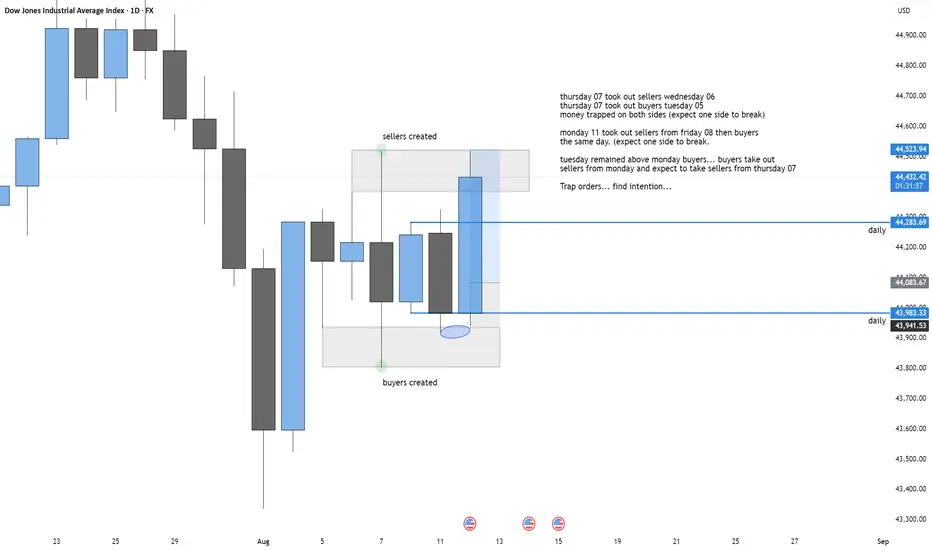
Dow moneydaily intention to drive 1h money. 15 min execution for better risk to reward. Tracking sellers and buyers taken and created.... letting structure get us in.
DOWUSD trade ideas
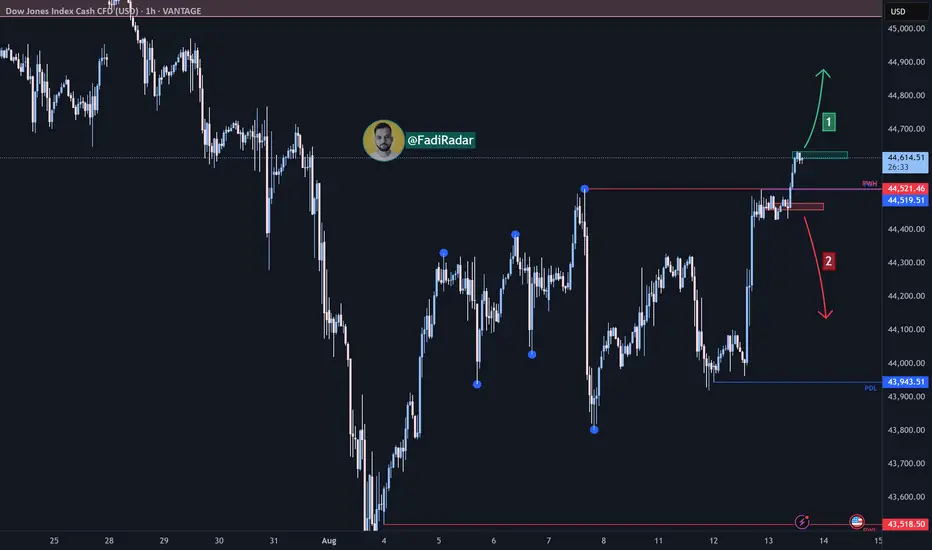
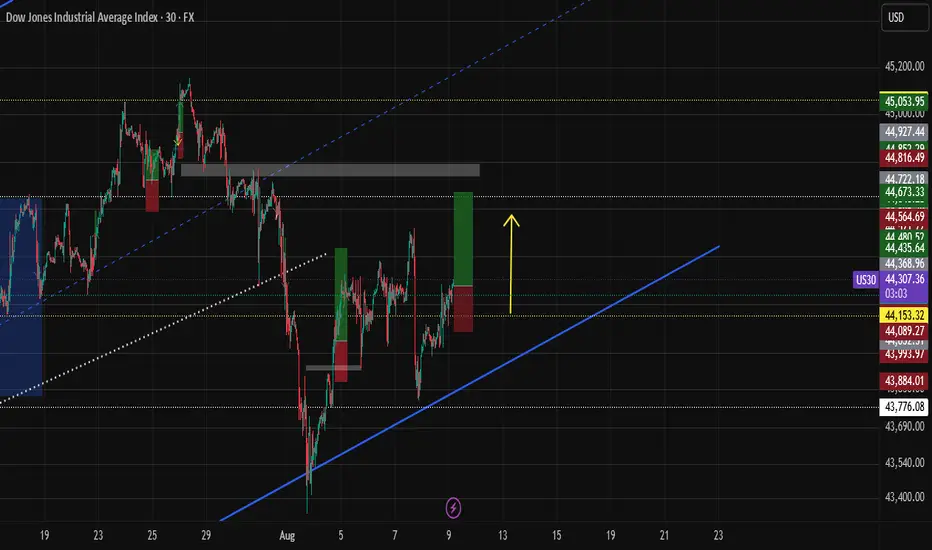
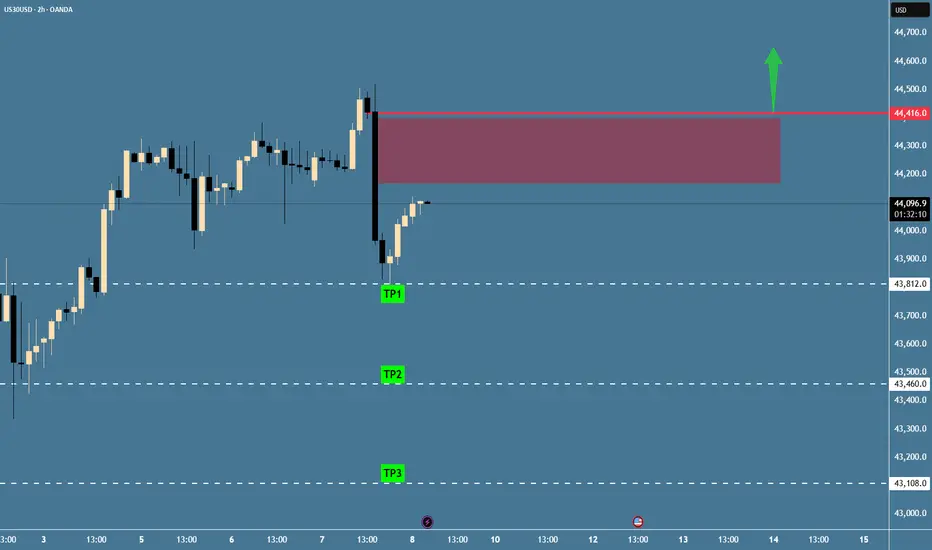
US30 Risky Long!
HI,Traders !
#US30 is trading in an uptrend
So despite a local correction
We are bullish biased and
As we are already seeing
A bullish rebound from the
Local horizontal support
Of 43885.9 a further
Bullish move up is
To be expected !
Comment and subscribe to help us grow !

Dow Jones Index Analysis (US30 / Dow Jones)The index is currently trading near the 44,600 level, which is considered a potential reversal zone. The possible scenarios are as follows:
1️⃣ Bullish Scenario:
If bullish momentum continues and the price holds above 44,650, the index may target the 44,900 area.
2️⃣ Bearish Scenario:
If a corrective downward move begins and the price breaks below the nearby support at 44,460 and holds under it, this could push the price toward testing the 44,100 level.
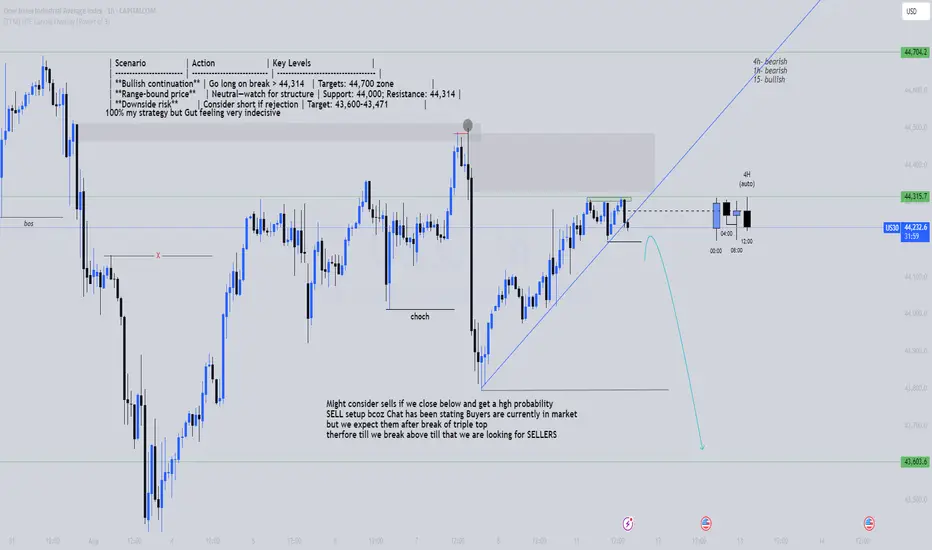
MON 11AUG | US30 BIAS HTF🧱 Setup Breakdown
Primary Observation:
Triple top pattern forming under 44,314
Support at 44,000 holding for now — break could trigger deeper move to 43,600
Buyer presence noted from lower timeframe, but HTF suggests sell-side intent
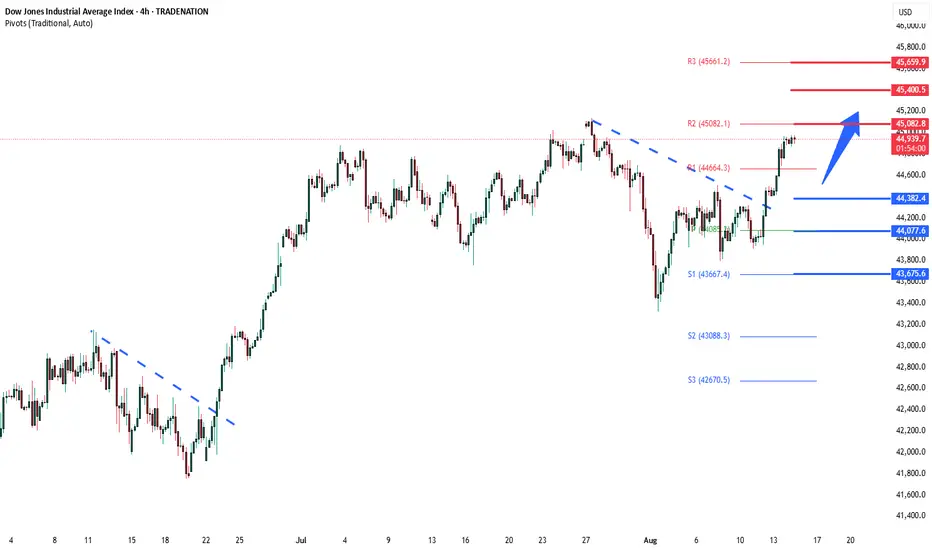
DowJones bullish breakout support at 44380Key Support and Resistance Levels
Resistance Level 1: 45080
Resistance Level 2: 45400
Resistance Level 3: 45660
Support Level 1: 44380
Support Level 2: 44077
Support Level 3: 43675
This communication is for informational purposes only and should not be viewed as any form of recommendation as to a particular course of action or as investment advice. It is not intended as an offer or solicitation for the purchase or sale of any financial instrument or as an official confirmation of any transaction. Opinions, estimates and assumptions expressed herein are made as of the date of this communication and are subject to change without notice. This communication has been prepared based upon information, including market prices, data and other information, believed to be reliable; however, Trade Nation does not warrant its completeness or accuracy. All market prices and market data contained in or attached to this communication are indicative and subject to change without notice.
US30
In these conditions, the probability of reaching the target is usually **55% to 65%**, and the probability of hitting the stop loss is **35% to 45%**.
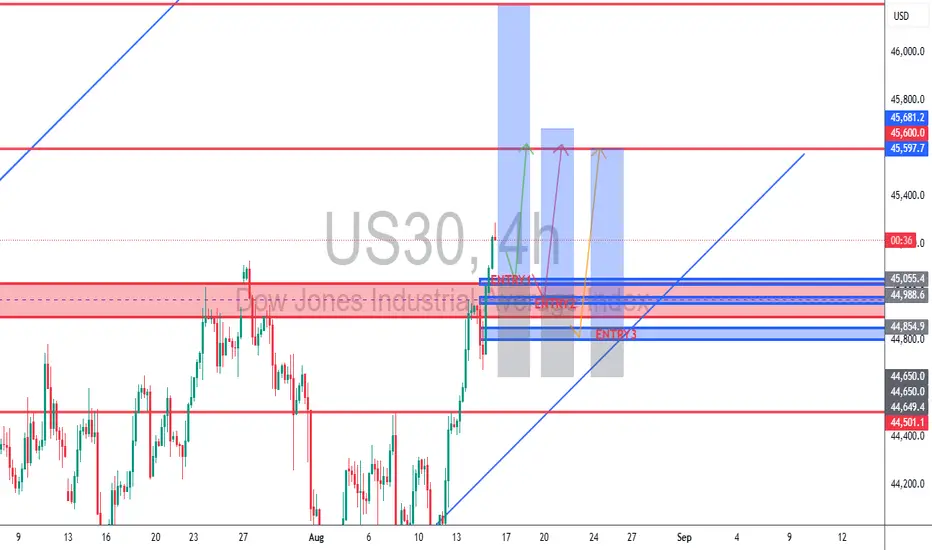
US30 TCBFlow Plan📌 TCBFlow Plan – US30
Bias: Bullish (Trend + Breakout Phase)
Setup Quality: A (High Probability)
1️⃣ 4H Timeframe – Structure Confirmation
Main Zone: 44,800 (old resistance, now potential support)
Bullish Confirmation Triggers:
Bullish engulfing candle closing above the retest low
Long-tailed rejection wick that holds above 44,800
Invalidation: 4H close below 44,650
2️⃣ 1H Timeframe – Precision Entry
After 4H confirmation, drop to 1H for exact entry.
My Entries:
EP1: 45,055.4 → Aggressive entry (anticipating bounce before full retest)
EP2: 44,988.6 → Ideal zone touch entry
EP3: 44,854.9 → Deep retest entry near demand base
Stop Loss: 44,650.0
Below rejection wick / structure low (~80–120 pts risk depending on entry)
Take Profits:
TP1: 45,600 → Partial close + SL to breakeven
TP2: 46,200 → Measured move from breakout
3️⃣ Trade Management
At 1:1 RRR → Move SL to breakeven
Trail SL behind 1H swing lows as price climbs
If stopped at BE but structure holds → re-enter on next 1H bullish signal
4️⃣ Risk Notes
Avoid entering if price rallies straight to 45,600 without retest (chasing)
No trade if price breaks below 44,650 (failed breakout)
💬 Drop your comment below if you’re also looking at the exact same setup!
Check the trend Given the behavior of the index within the current resistance range, possible scenarios have been identified. As long as the index does not show above the resistance range, the continuation of the correction trend is likely.
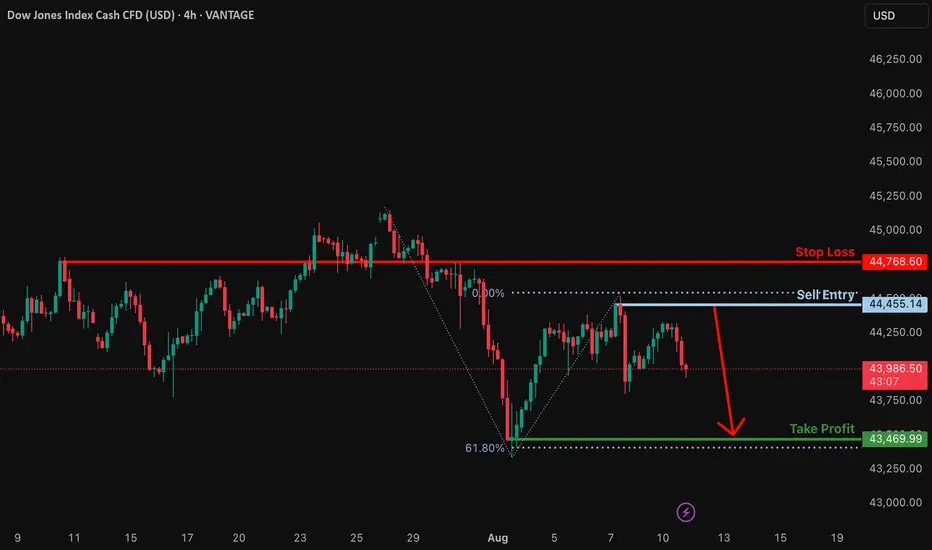
Bearish reversal?US30 is risng towards the resistance level which is. a pullback resistance and could reverse from this lev to our take profit.
Entry: 44,455.14
Why we like it:
There is a spullbsck resistance.
Stop loss: 44,768.60
Why we like it:
There is an overlap resistance.
Take profit: 43,469.99
Why we like it:
There is a pullback support that is slightly above the 61.8% Fibonacci projection.
Enjoying your TradingView experience? Review us!
Please be advised that the information presented on TradingView is provided to Vantage (‘Vantage Global Limited’, ‘we’) by a third-party provider (‘Everest Fortune Group’). Please be reminded that you are solely responsible for the trading decisions on your account. There is a very high degree of risk involved in trading. Any information and/or content is intended entirely for research, educational and informational purposes only and does not constitute investment or consultation advice or investment strategy. The information is not tailored to the investment needs of any specific person and therefore does not involve a consideration of any of the investment objectives, financial situation or needs of any viewer that may receive it. Kindly also note that past performance is not a reliable indicator of future results. Actual results may differ materially from those anticipated in forward-looking or past performance statements. We assume no liability as to the accuracy or completeness of any of the information and/or content provided herein and the Company cannot be held responsible for any omission, mistake nor for any loss or damage including without limitation to any loss of profit which may arise from reliance on any information supplied by Everest Fortune Group.
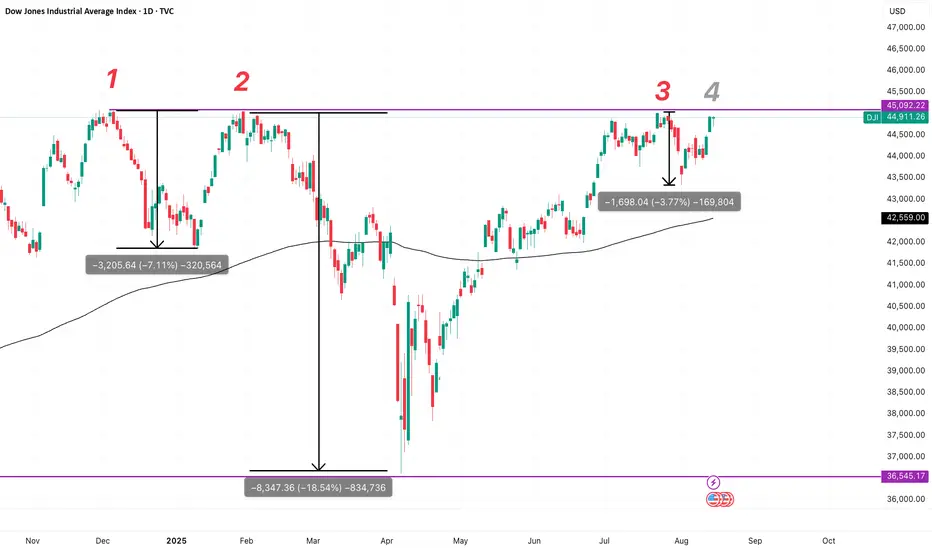
Dow: Fourth Attempt at the CeilingThree times since late 2024, the Dow has run head-first into the same resistance zone around 45,092 — each time pulling back, but each time finding higher lows and quicker recoveries.
Now we’re at attempt #4. The prior pullbacks have been smaller, and breadth is improving — only 5 out of 30 Dow components are negative since December 24, 2024.
Yes, there are plenty of unknowns — macro headwinds, earnings gaps, global geopolitical and tariff risks — but the chart says one thing loud and clear: the bulls are still in control.
A clean breakout here could open the door to new highs. Until proven otherwise, momentum belongs to the buyers.
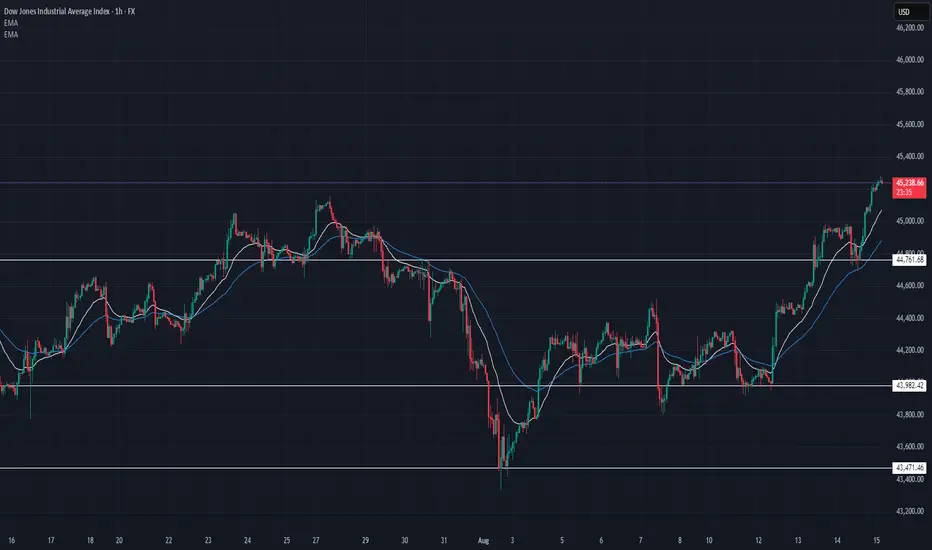
US30 Technical Breakdown – 08/15/2025📍 US30 Technical Breakdown – 08/15/2025
US30 is trading at 45,238, extending its sharp rally from the 43,471 low. Price ripped through the 44,761 resistance, turning it into fresh support, with EMAs in strong bullish alignment. Momentum remains with the bulls, but the next key obstacle sits around 45,400–45,600.
📊 Current Market Behavior:
📈 Strong impulsive rally, higher highs & higher lows
📊 EMAs steeply pointing up — bullish momentum
🧱 Immediate resistance above current price
⚠️ Overextended short-term, potential for intraday pullbacks
📌 Key Levels:
🔹 Resistance Zones:
45,400 → Immediate upside target
45,600–45,800 → Supply zone
46,200 → Major swing high
🔹 Support Zones:
44,761 → Fresh support
44,200 → Secondary support
43,982 → Key demand
🧠 Bias:
📈 Strong Bullish
Trend favors continuation while above 44,761, but after such a steep move, watch for profit-taking.
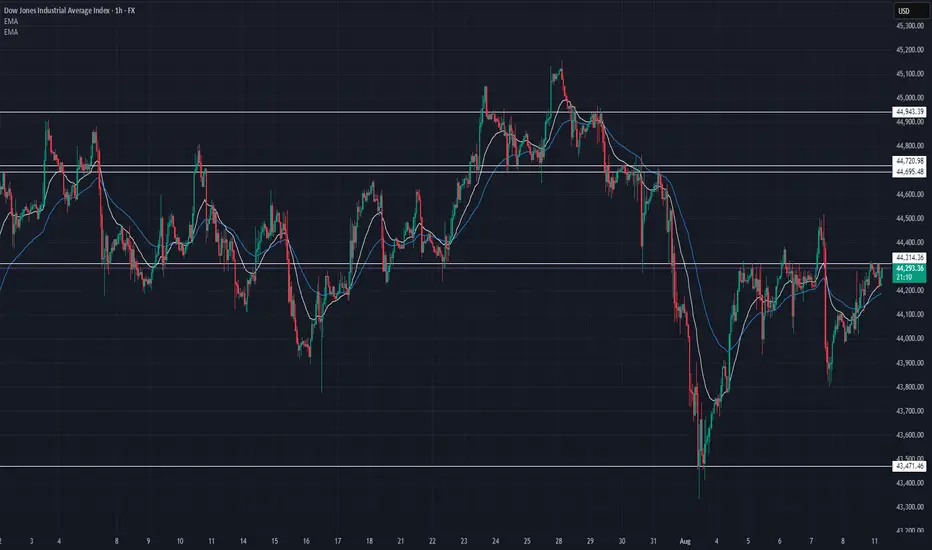
US30 Technical Breakdown – 08/11/2025📍 US30 Technical Breakdown – 08/11/2025
US30 is trading around 44,279 after a steady climb from last week’s 43,471 low. Price has reclaimed short-term EMAs but remains capped under the 44,314 resistance pivot. Bulls need a clean break above this level to target the heavy supply zone at 44,695–44,720.
A rejection at current levels could see price slip back toward 44,000, and if that fails, the next supports are 43,600 and 43,471.
📊 Current Market Behavior:
📈 Bounce from recent lows holding above EMAs
📊 Price stalling under key resistance at 44,314
🧱 Heavy supply waiting near 44,720
⚠️ Bulls in control short term, but upside capped unless breakout clears
📌 Key Levels:
🔹 Resistance Zones:
44,314 → Immediate breakout pivot
44,695–44,720 → Major supply zone
44,943 → Swing high
🔹 Support Zones:
44,000 → Psychological & structure support
43,600 → Reaction low
43,471 → Demand base
🧠 Bias:
📈 Neutral to Bullish Intraday
Bulls hold the advantage above 44,000, but sellers have defended 44,720 multiple times. Breakout or rejection likely to set the week’s tone.
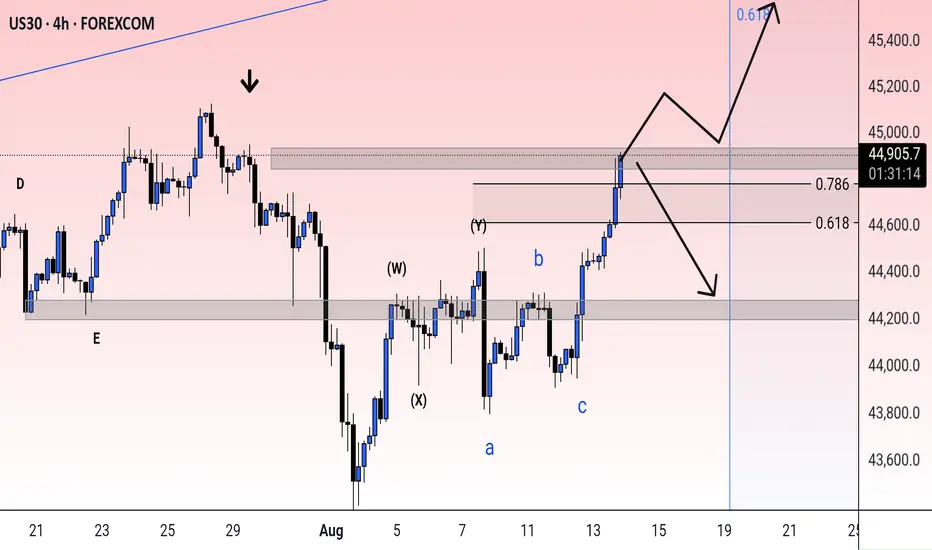
US30 - Potential TargetsDear Friends in Trading,
How I see it,
Keynote:
If price closes a 2HR / 4HR candle body above red barrier,
the "SHORT" thesis is voided.
I sincerely hope my point of view offers a valued insight
Thank you for taking the time study my analysis.
US 30 Index – Potential Rebound or Deeper Retracement Ahead?Just as the US 30 became the last of the three major US indices to register a new all time high last Monday at 45160, on a final wave of positivity generated by the announcement of a trade deal between the US and EU, it was snatched away again as traders used the up move to take profit on longs.
This initial fall evolved into 5 straight daily declines which took the index from its record high of 45160 on Monday to a Friday close at 43591 as the sell off accelerated, driven by disappointment of a more hawkish than expected Fed, a new wave of trade tariffs from President Trump, weaker Amazon earnings , and on Friday, perhaps the biggest surprise of all, a Non-farm Payrolls release that showed the US labour market may be weakening faster than anticipated.
Looking forward, with the shock of Friday’s data reverberating through markets, US 30 traders still have lots to think about this week. The US ISM Services PMI release is due at 1500 BST on Tuesday. Service activity has been the major driver of growth in the US economy for the last 18 months, so this new update could have a big influence over where the US 30 index moves next. Any reading below 50 = economic contraction, while readings above 50 = economic expansion, and traders could well be focused on how this month’s print stacks up against last month’s reading of 50.8.
The earnings releases of 3 bellwether US corporates may also be relevant, given their US 30 index weightings. Caterpillar reports its Q2 results before the market open on Tuesday, with McDonald’s and Walt Disney reporting before the open on Wednesday. Traders may be looking to compare actual earnings against expected, alongside assessing any future revenue guidance that is provided against the current trade tariff operating environment.
Now, while the US 30 index has opened this new trading week on a more stable footing, currently trading up 0.25% at 43705 at the time of writing (0530 BST), assessing the technical outlook for the week ahead could also be useful for traders.
Technical Update: Deeper Retracement Risk Emerging?
While it might be argued that it was the reaction to the latest US employment data that saw US equities encounter fresh selling pressure, as the chart below shows, prices were already declining into Friday’s payrolls release.
Price weakness was materialising in the US 30 index right after it posted its new all-time high on Monday July 28th at 45160, and traders might now argue that last Thursday’s close below support provided by the Bollinger mid-average, currently at 44412, was the first potential indication that a more extended phase of price weakness was possible. The case was then perhaps strengthened by Friday’s negative reaction to the payrolls data, which saw closing breaks under support provided by the July 16th last correction low at 43770.
There is of course no guarantee that this price action will result in a retracement of the April 7th (36440) to July 28th strength (45160), but assessing what may be the potential support and resistance levels to monitor this week could be helpful, if the recent volatility continues to dominate price action at the start of August.
Possible Support Levels:
Last week’s price decline held at the 43337 level which was the August 1st low, and having previously found buyers at this point, they may be found again. As such, this 43337 level could now prove to be the first support focus for the week ahead.
Closing breaks below 43337, if seen, could lead to the possibility of further price declines, opening potential to test the next support at 41824, which is the 38.2% Fibonacci retracement of April to July 2025 price strength (see chart above).
Possible Resistance Levels:
Having now seen the Bollinger mid-average for the US 30 index turn lower after last week’s fall, this may now be the first resistance level to watch on any subsequent rally higher. It currently stands at 44442 and watching how this level is defended on a closing basis could be useful.
If a more sustained phase of price strength is to materialise, it could be closing breaks above the mid-average at 44442 that increases the possibility of it happening. Such moves could then see retests of the July 28th all-time high at 45160, possibly higher if this level is then breached on a closing basis.
The material provided here has not been prepared accordance with legal requirements designed to promote the independence of investment research and as such is considered to be a marketing communication. Whilst it is not subject to any prohibition on dealing ahead of the dissemination of investment research, we will not seek to take any advantage before providing it to our clients.
Pepperstone doesn’t represent that the material provided here is accurate, current or complete, and therefore shouldn’t be relied upon as such. The information, whether from a third party or not, isn’t to be considered as a recommendation; or an offer to buy or sell; or the solicitation of an offer to buy or sell any security, financial product or instrument; or to participate in any particular trading strategy. It does not take into account readers’ financial situation or investment objectives. We advise any readers of this content to seek their own advice. Without the approval of Pepperstone, reproduction or redistribution of this information isn’t permitted.

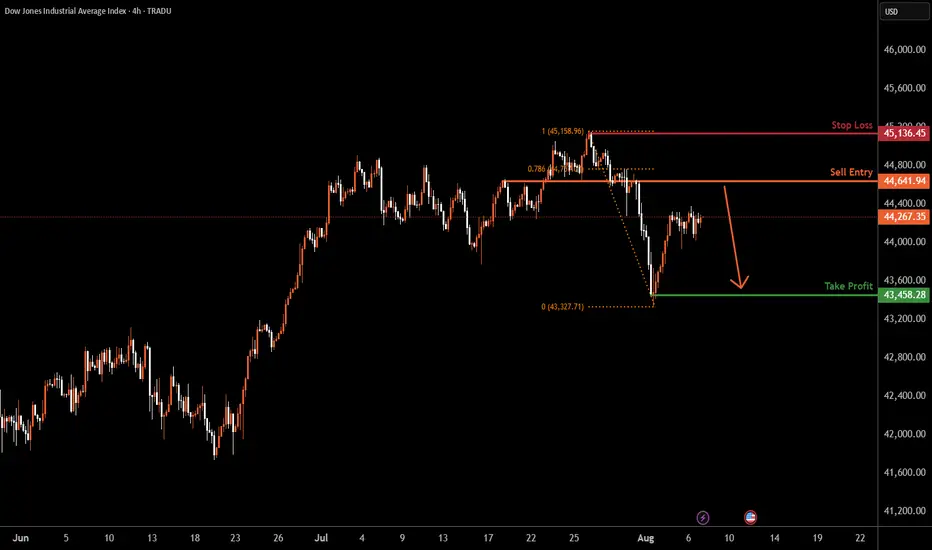
US30 H4 | Bearish reversalDow Jones (US30) is rising towards the sell entry which is an overlap resistance and could reverse to the downside.
Sell entry is at 44,641.94, which is an overlap resistance that is slightly below the 78.6% Fibonacci retracement.
Stop loss is at 45,136.45, which is a swing high resistance.
Take profit is at 43,458.28, which has been identified as a swing low support.
High Risk Investment Warning
Trading Forex/CFDs on margin carries a high level of risk and may not be suitable for all investors. Leverage can work against you.
Stratos Markets Limited (tradu.com ):
CFDs are complex instruments and come with a high risk of losing money rapidly due to leverage. 65% of retail investor accounts lose money when trading CFDs with this provider. You should consider whether you understand how CFDs work and whether you can afford to take the high risk of losing your money.
Stratos Europe Ltd (tradu.com ):
CFDs are complex instruments and come with a high risk of losing money rapidly due to leverage. 66% of retail investor accounts lose money when trading CFDs with this provider. You should consider whether you understand how CFDs work and whether you can afford to take the high risk of losing your money.
Stratos Global LLC (tradu.com ):
Losses can exceed deposits.
Please be advised that the information presented on TradingView is provided to Tradu (‘Company’, ‘we’) by a third-party provider (‘TFA Global Pte Ltd’). Please be reminded that you are solely responsible for the trading decisions on your account. There is a very high degree of risk involved in trading. Any information and/or content is intended entirely for research, educational and informational purposes only and does not constitute investment or consultation advice or investment strategy. The information is not tailored to the investment needs of any specific person and therefore does not involve a consideration of any of the investment objectives, financial situation or needs of any viewer that may receive it. Kindly also note that past performance is not a reliable indicator of future results. Actual results may differ materially from those anticipated in forward-looking or past performance statements. We assume no liability as to the accuracy or completeness of any of the information and/or content provided herein and the Company cannot be held responsible for any omission, mistake nor for any loss or damage including without limitation to any loss of profit which may arise from reliance on any information supplied by TFA Global Pte Ltd.
The speaker(s) is neither an employee, agent nor representative of Tradu and is therefore acting independently. The opinions given are their own, constitute general market commentary, and do not constitute the opinion or advice of Tradu or any form of personal or investment advice. Tradu neither endorses nor guarantees offerings of third-party speakers, nor is Tradu responsible for the content, veracity or opinions of third-party speakers, presenters or participants.
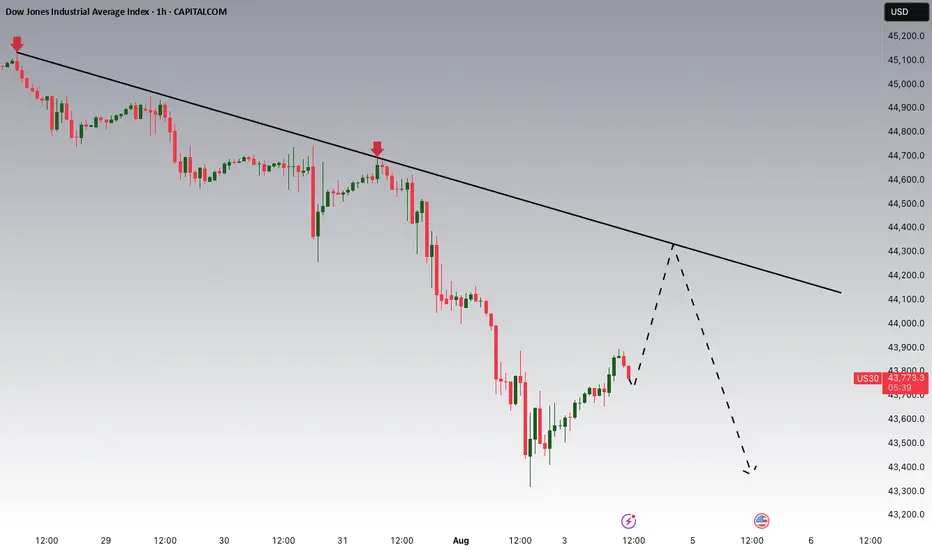
Dow Jones Potential DownsidesHey Traders, in today's trading session we are monitoring US30 for a selling opportunity around 44,300 zone, Dow Jones is trading in a downtrend and currently is in a correction phase in which it is approaching the trend at 44,300 support and resistance area.
Trade safe, Joe.
Will The Soft NFP Data Resume the Strength of Dow Jones?Macro approach:
- The Dow Jones Industrial Average advanced this week, rebounding strongly as risk appetite improved following last week’s pullback, supported by a soft jobs report and easing global tariff concerns.
- Sentiment was aided by the Fed’s increased hopes of a near-term rate cut after Non-farm Payrolls missed expectations, prompting a 1.3% surge on Monday. Broader market sectors responded favorably to resilient earnings and softer economic prints.
- The index may remain sensitive to upcoming US inflation data, US service sector data and Fed communications, with labor market softness and further trade headlines poised to influence direction this and next week.
Technical approach:
- US30 significantly rebounded yesterday, erasing half of the losses from the last 5-losing streak last week. The price is hovering around EMA21, indicating a short-term sideways momentum and await for an apparent breakout to determine the trend.
- If US30 breaks above key resistance at 45000, the price may surge further to test the Fibo Extension confluencing area around 46800.
- On the contrary, failing to hold above the support at 43325, confluence with EMA78, may prompt a deeper correction to the following support at 41750.
Analysis by: Dat Tong, Senior Financial Markets Strategist at Exness

US30 with A/J strategy Not saying that mach please keep in mind we have to protect the capital and follow the trend move please read the candles and follow the moves we have strong high on 1hr and 4hr also quick shift when you look down 15m S/Lows
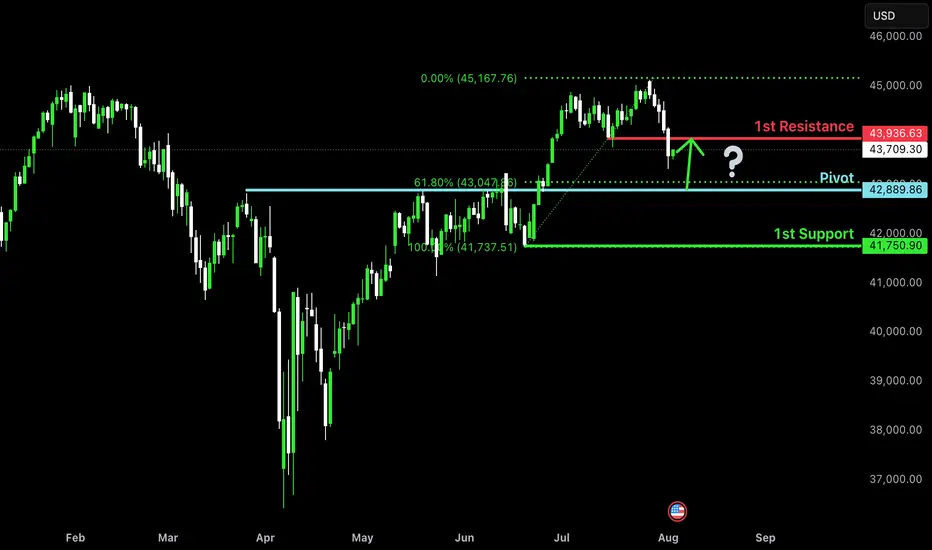
Falling towards pullback support?Dow Jones (US30) is falling towards the pivot and could bounce to the 1st resistance.
Pivot: 42,889.86
1st Support: 41,750.90
1st Resistance: 43,936.63
Risk Warning:
Trading Forex and CFDs carries a high level of risk to your capital and you should only trade with money you can afford to lose. Trading Forex and CFDs may not be suitable for all investors, so please ensure that you fully understand the risks involved and seek independent advice if necessary.
Disclaimer:
The above opinions given constitute general market commentary, and do not constitute the opinion or advice of IC Markets or any form of personal or investment advice.
Any opinions, news, research, analyses, prices, other information, or links to third-party sites contained on this website are provided on an "as-is" basis, are intended only to be informative, is not an advice nor a recommendation, nor research, or a record of our trading prices, or an offer of, or solicitation for a transaction in any financial instrument and thus should not be treated as such. The information provided does not involve any specific investment objectives, financial situation and needs of any specific person who may receive it. Please be aware, that past performance is not a reliable indicator of future performance and/or results. Past Performance or Forward-looking scenarios based upon the reasonable beliefs of the third-party provider are not a guarantee of future performance. Actual results may differ materially from those anticipated in forward-looking or past performance statements. IC Markets makes no representation or warranty and assumes no liability as to the accuracy or completeness of the information provided, nor any loss arising from any investment based on a recommendation, forecast or any information supplied by any third-party.
SHORT ON US30US30 Has given us a nice CHOC (Change of Character) to the downside.
This indicates a huge potential of US30 dropping more after it pulls back into the supply zone that created the change.
Dollar news is also a catalyst today for this play. If news comes out good for PMI and makes the dollar rise... US30 could fall almost 3000 points over the next few days.
Take Advantage.
How to prepare a session and generate ideas - Todays NY SessionIn this video i demonstrate how i prepare a session with my heat map analysis template, using SB Style signals, MTF approach and market profile. I go through the current price action and setup of DXY, Silver, Gold, WTI, NAS, S&P and DJ30

*US30: Fifth Wolfe Wave in Play—Correction Offers Prime Shorting📉 *
The US30 index has completed its **fifth Wolfe Wave**, initiating the expected downward move. While price is currently undergoing a corrective bounce, this retracement is shaping up to be a golden opportunity for sellers.
🔍 **Technical Breakdown**
- ✅ Wolfe Wave structure is confirmed, with wave 5 marking the turning point.
- 🔄 Current price action shows a **corrective pullback**, typical after the initial drop.
- 📌 Any upward movement is viewed as a **strategic entry point for short positions**.
🎯 **Target Zone**
We’re eyeing a descent toward the **41,700 level**, which aligns with the equilibrium line drawn between **waves 1 and 4**—a classic Wolfe Wave target.
⚠️ **Trade Insight**
This setup blends harmonic precision with tactical timing. As long as price remains below the wave 5 peak, the bearish bias holds strong. Sellers are watching for signs of exhaustion in the correction to strike.
---

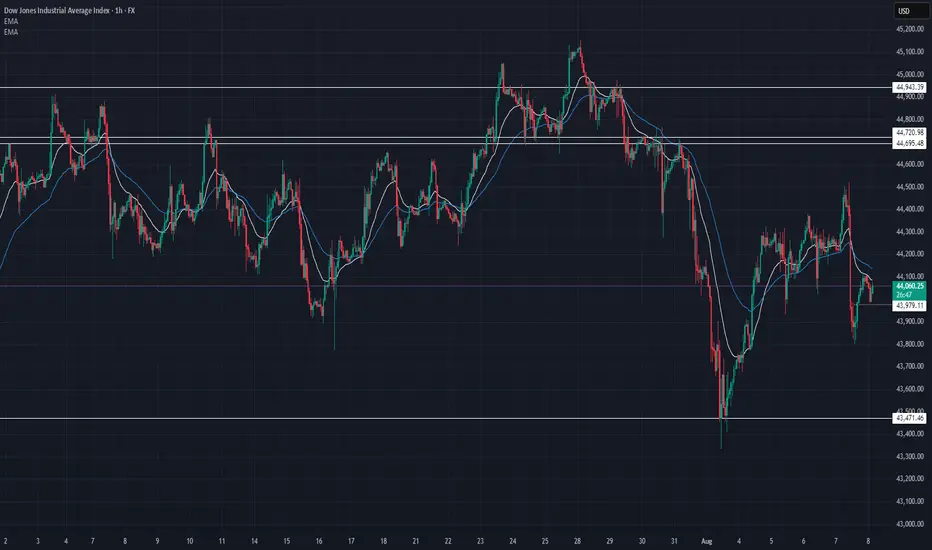
US30 Technical Breakdown – 08/08/2025📍 US30 Technical Breakdown – 08/08/2025
US30 has pulled back from the 44,360–44,400 resistance zone and is now trading around 44,060 after a failed breakout attempt. The rejection near 44,400 confirms it as a key supply zone. Price is now testing the 43,950–44,000 support band.
Short-term momentum has turned soft again, and price is stuck below the key EMAs. Bulls need to defend 43,950 to avoid a deeper rotation toward 43,600–43,470.
📊 Current Market Behavior:
📉 Rejection off lower highs
📊 Trading back below short-term EMAs
🧱 Range between 44,400 and 43,950 tightening
⚠️ Bias tilting bearish unless 44,200 is reclaimed
📌 Key Levels:
🔹 Resistance Zones:
44,200–44,360 → Breakdown zone
44,600–44,720 → Major resistance overhead
44,943 → Last key swing high
🔹 Support Zones:
43,950–43,900 → Intraday support
43,600 → Reaction low
43,471 → Demand base
🧠 Bias:
📉 Bearish Intraday
Failed breakout and loss of EMAs indicate weakness. A break below 43,950 could trigger another leg down.