US30 _BUY RETRACEMENT-SELL CONTINUATION-HIGHER TIMEFRAME-FVGThe week of July 28th the market reacted off the resistance around the 45,097 level to the sellside creating a downward trend. On the Monthly and the weekly, the market has traded down into a higher timeframe FVG, possibly creating a buy model for the upcoming week. On the 4hour it's possible a continuation will occur to the sellside.
DOWUSD trade ideas

Dow Jones August GameplanNow that the first trading day of August has printed, can one reliably forecast the possible month based on just the first day? I am inclined to believe that one can with a small amount of accuracy. Not perfect.
There are two types of monthly cycles when the first traded day is a bearish candle right from the open of the month.
Type 1 is a bearish trending cycle that trends lower and lower. It is then followed up by small number of bullish pullbacks halfway through the month before rolling back over and closing near the lows.
Type 2, more common, is when the first traded day is bearish right from the get-go as well, trades lower but reverses near the beginning of the month before trading higher than the open and forming a bullish bar.
So, in my opinion, there are only two probably outcomes for August.
Type 1:
Type 2:

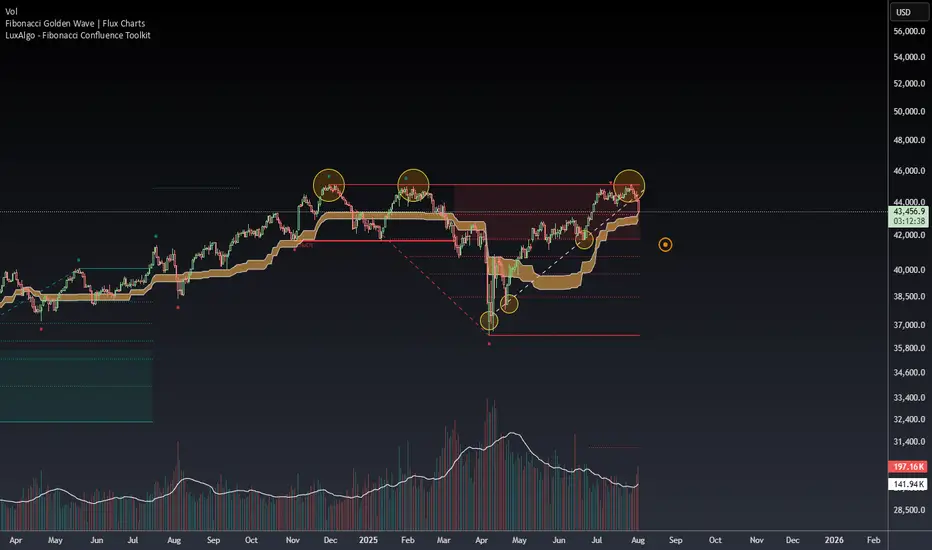
Dow Jones Triple Top & Critical Trendline Break - Buy The Dip?Potential Tripple Top formation spotted on the Dow. This would represent a full fibonacci retracement, which leads me to believe a 38.2 retest is likely. If this 23.6 level can hold support and price does not close below the fib band (orange channel), then the bullish continuation to new all time highs can still happen in Q3/Q4 of this year. The clear trendline break dating back to April is very concerning (white line), leading me to believe more downside in the coming weeks.
Let me know what you think in the comments!
Thanks
DowJones The Week Ahead Key Support and Resistance Levels
Resistance Level 1: 44390
Resistance Level 2: 44720
Resistance Level 3: 45100
Support Level 1: 43360
Support Level 2: 43140
Support Level 3: 42800
This communication is for informational purposes only and should not be viewed as any form of recommendation as to a particular course of action or as investment advice. It is not intended as an offer or solicitation for the purchase or sale of any financial instrument or as an official confirmation of any transaction. Opinions, estimates and assumptions expressed herein are made as of the date of this communication and are subject to change without notice. This communication has been prepared based upon information, including market prices, data and other information, believed to be reliable; however, Trade Nation does not warrant its completeness or accuracy. All market prices and market data contained in or attached to this communication are indicative and subject to change without notice.

Dow Jones Wave Analysis – 1 August 2025
- Dow Jones broke the support zone
- Likely to fall to support level 43000.00
The Dow Jones index broke the support zone between the support level 44000.00 and the 38.2% Fibonacci correction of the upward impulse from June.
The breakout of this support zone accelerated the active short-term correction iv.
Dow Jones index can be expected to fall to the next support level at 43000.00 (target for the completion of the active correction iv and the former resistance from May and June).

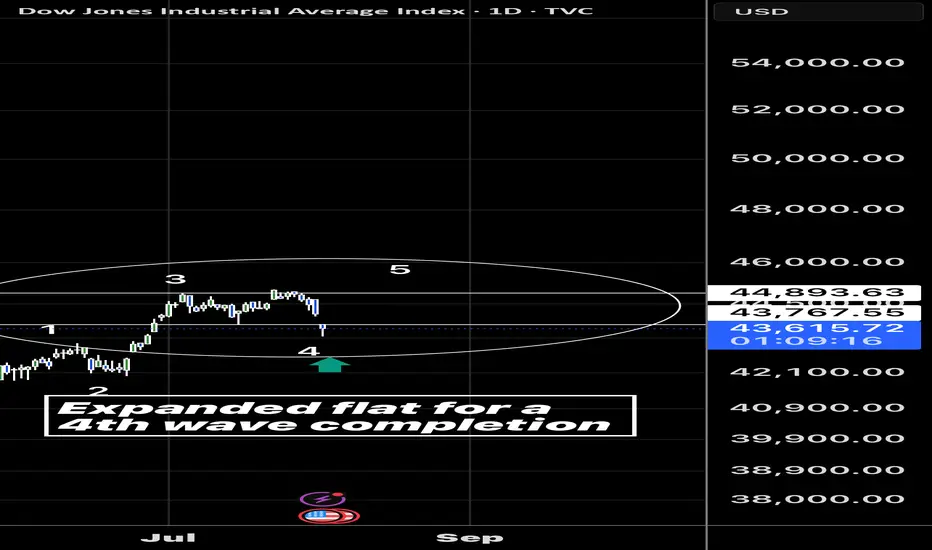
Expanded flat on the Dow for 4th wave completion? If it is we can see some new highs… a close back above 43760 today would set it up
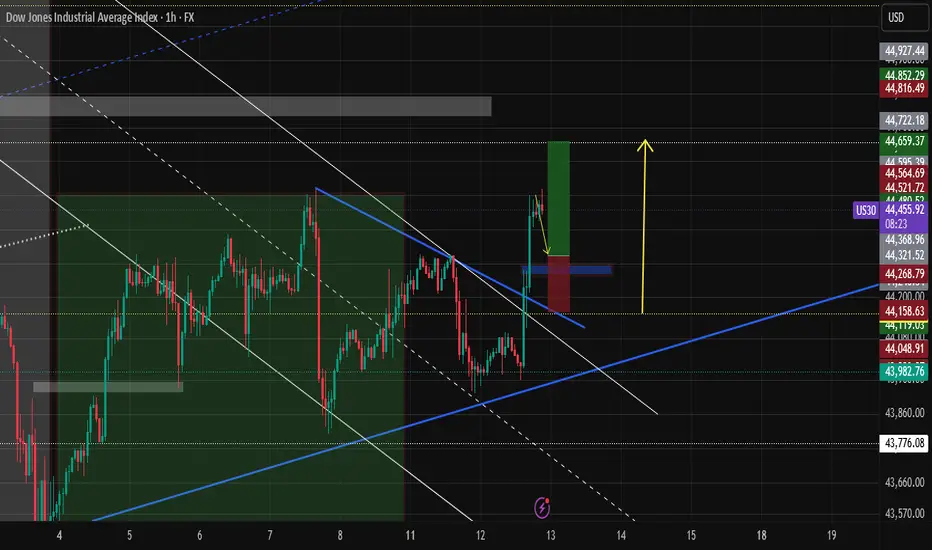
DJ30/US30 LONG Reason for trade:
1. Expanding flat in play
2. Equal highs (LIQUIDITY)
3. Currently at the order block area (Ready)
Entry: 43647
Stop Loss: 43386
Take Profit: 45246
Strategy: Wait for a 30 minute engulfing candle closure.
Once in profit of 1:1 R, place the trade at BE
Blessings, in CHRIST.

US30 Bullish Bias!
HI,Traders !
#US30 went down and
Retested a horizontal
Support of 43775.2 from
Where we are seeing a
Bullish rebound so as we
Are bullish biased and we
Will be expecting a further
Bullish move up !
Comment and subscribe to help us grow !

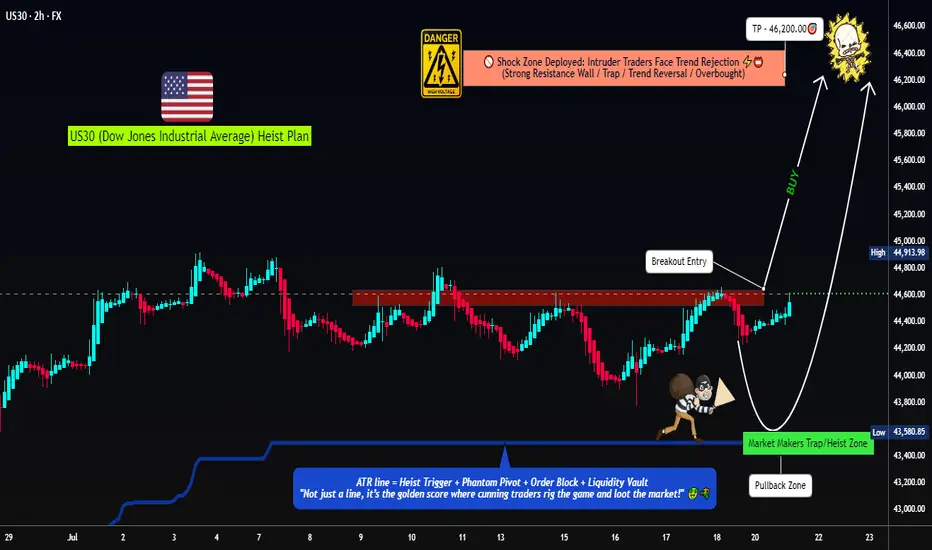
US30 Robbery Blueprint: Breakout, Pullback, Escape Setup💎 Dow Jones Robbery Blueprint: The US30 Vault Crack Plan 💎
(Maximized for reach — within TradingView title limit)
🌟Hi! Hola! Ola! Bonjour! Hallo! Marhaba!🌟
Dear Market Robbers & Money Movers 🕵️♂️💰🚨
This ain't your average analysis — it’s a Thief Trader-style 🔥tactical mission🔥 aimed at the mighty "US30/DJI" (Dow Jones Industrial Average). We're talkin' about a precision heist with a full blueprint: entry zones, trap setups, and escape exits. Read carefully — this ain’t for the faint-hearted traders! 🧠🦾
🧠 Entry Zones (The Break-In) 📈
🛠 ENTRY 1: Crack the wall near 44700.00 – that’s the resistance gate. Wait for confirmation.
🎯 ENTRY 2: Sneak in at the Market Makers’ Trap around 43500.00 – a dirty zone where retailers get baited. Perfect time to strike long!
🧱 DCA/Layering strategy recommended. Stack those buy orders like a thief layering explosives on a safe. 💣💸
🛑 Risk Levels (Escape Routes/Stop Loss)
🔊 "Listen up, vault raiders! Never drop your SL until breakout is confirmed. If you jump early, you might land in a bear trap! 🪤"
🔐 Stop Zones (Based on Strategy):
📌 Swing Buy SL (2H TF): Place at 44100.00 for the stealth buy.
🏦 Institutional SL (Swing Zone): Drop it around 43000.00
🔐 Max Risk SL (3H TF): If you're deep, your last stand is at 39200.00
☝️ SL depends on your position sizing, number of entries, and risk appetite. Trade like a thief, not a gambler.
🎯 Heist Target (Profit Exit)
🏁 Escape Point: 46200.00 — or exit before heat rises! Don’t be greedy. Rob and vanish. 💨💰
🔥 Market Mood: Why the Heist Is On
"US30/DJI" is bullish AF — thanks to:
📊 Macro-Economic Wind at Our Back
📈 Institutional momentum
📰 Strong sentiment and intermarket flows
Check your chart radar: Fundamentals + technicals aligning = green light for robbery! 🟢
⚠️ Tactical Reminder: News Can Jam the Plan
📵 Avoid new entries during major economic releases
🛡 Use trailing SLs to protect running trades
Stay alert, stay alive. 💡
❤️ Support the Robbery Crew
Hit that 💥BOOST💥 — your love fuels our next mission.
Join us and ride daily heist plans with Thief Trading Style 🏴☠️🚀💰
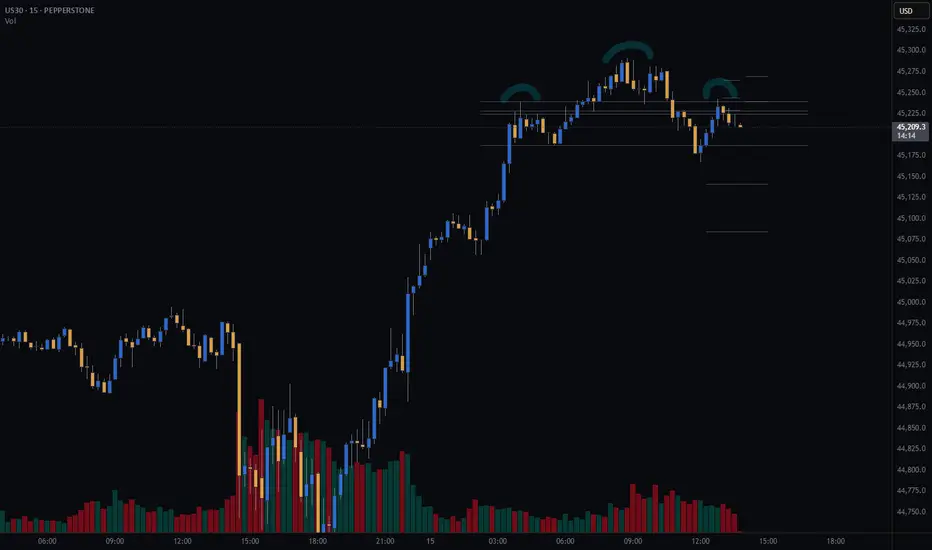
US30 - potential head and shoulders on 30min chartWatching the US30Cash for a potential short setup.
A head and shoulders pattern may be forming on the 30-minute timeframe. I’m still waiting for confirmation on some key variables before entering the trade.
Trade Details:
📊 Risk/Reward: 2.7
🎯 Entry: 45 224
🛑 Stop Loss: 45 261
💰 Take Profit 1 (50%): 45 141
💰 Take Profit 2 (50%): 45 084
Thanks for checking out my post! Make sure to follow me to catch the next update. If you found this helpful, give it a like 👍 and share your thoughts 💬 — I’d love to hear what you think!
Please note: This is not financial advice. This content is to track my trading journey and for educational purposes only.
DowJones uptrend supported at 44380Key Support and Resistance Levels
Resistance Level 1: 45400
Resistance Level 2: 45660
Resistance Level 3: 46000
Support Level 1: 44380
Support Level 2: 44080
Support Level 3: 43675
This communication is for informational purposes only and should not be viewed as any form of recommendation as to a particular course of action or as investment advice. It is not intended as an offer or solicitation for the purchase or sale of any financial instrument or as an official confirmation of any transaction. Opinions, estimates and assumptions expressed herein are made as of the date of this communication and are subject to change without notice. This communication has been prepared based upon information, including market prices, data and other information, believed to be reliable; however, Trade Nation does not warrant its completeness or accuracy. All market prices and market data contained in or attached to this communication are indicative and subject to change without notice.
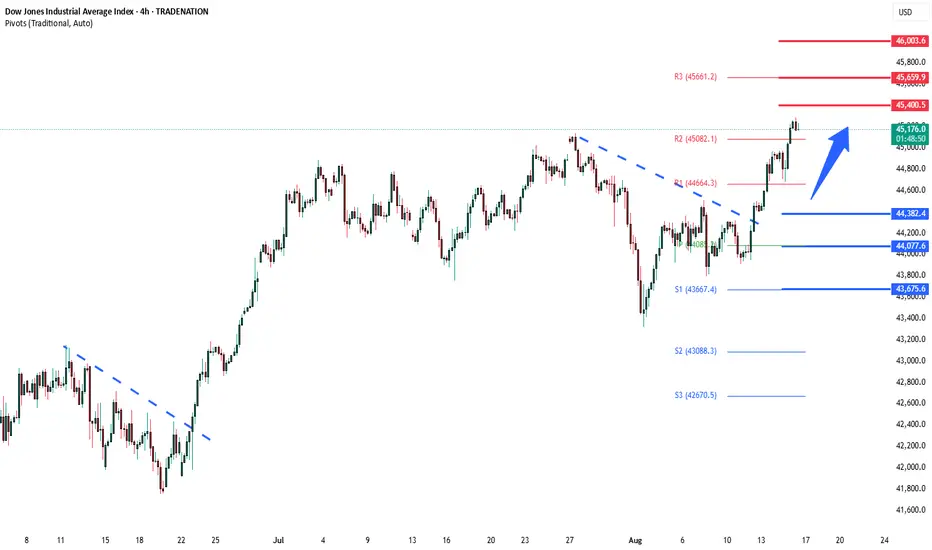
Possibility of uptrend The recent uptrend is expected to continue to the identified resistance levels. With the resistance trendline broken, a continuation of the uptrend will be more likely.
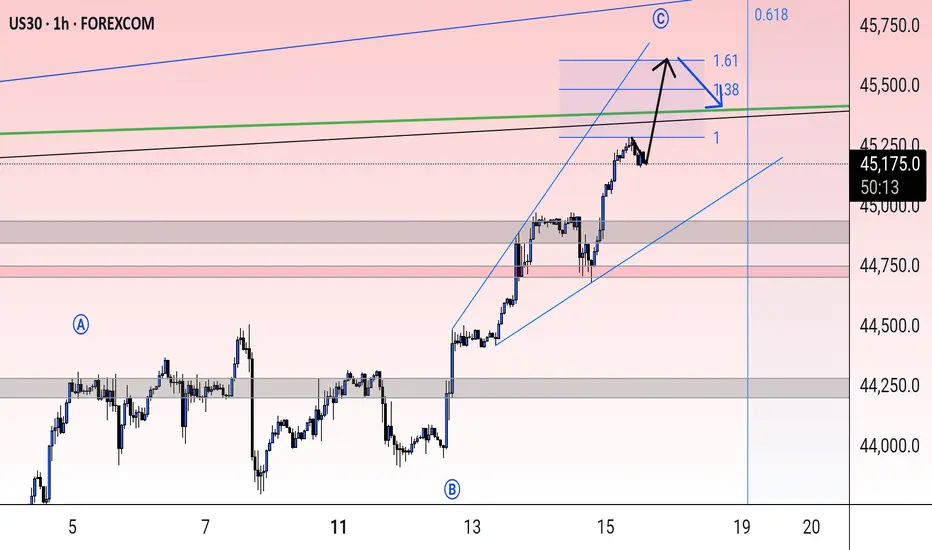
US30 Long Position US30 has broken passed the major resistance level at $45000 finally and is currently priced at $45200. The Bullish trend from the past week has created strong bullish confluences with price trading above the 21 and 50 day Moving Averages and in the bullish region of the RSI, expecting further upside potential.
With the break of the $45000 barrier, we can expect price to retrace and test this point sometime in the future and with that see a bounce from this level with the resistance turning support.
Will also be looking at other keys levels such as $44980 and $44730 should price have a deep retracement before the bullish trend resumes.
Will The Prospect of Fed Rate Cuts Continue to Support US30?Fundamental approach:
- US30 has been pushing toward a fresh high this week, aided by softer CPI and growing confidence in a Sep Fed cut. On Wed, it was within about 1% of a record and posted substantial gains earlier in the week.
- The US Jul PPI rose 0.9% MoM and 3.3% YoY, well above forecasts, reviving tariff-driven inflation worries and pressuring cyclicals. Earlier CPI relief had supported a midweek bounce and fresh risk-on tone in parts of the market. Headlines flagged mixed mega-cap moves, and Dow heavies like Apple (AAPL) and Caterpillar (CAT) fluctuated with growth and trade sensitivity as traders reassessed the rate path.
- US30 could remain supportive as markets weigh amid Fed policy expectations that could shift based on next week's flash PMIs and further data signals on pricing and activity. Traders may also react to guidance updates and sector rotations if inflation surprises persist, potentially delaying aggressive easing prospects.
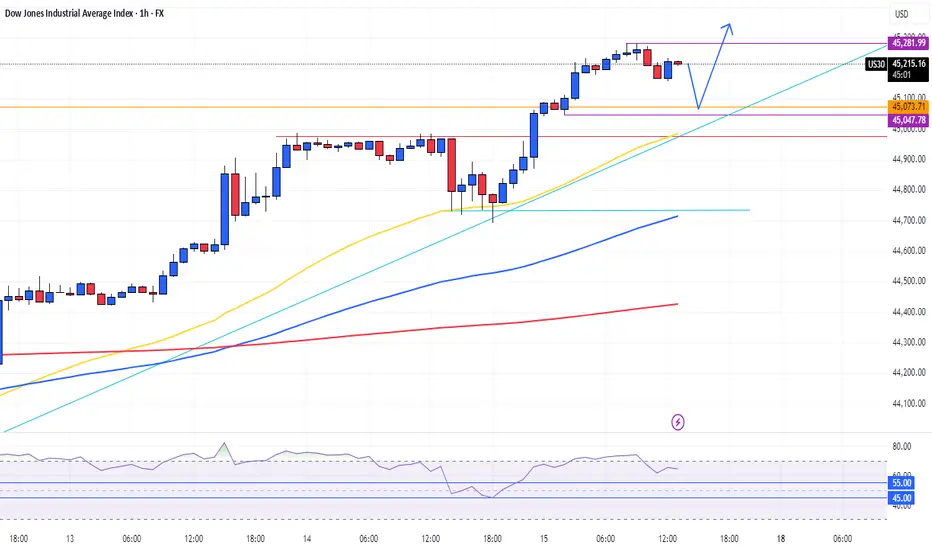
Technical approach:
- US30 created a new swing high, closing above the resistance at 45000. The index is above both EMAs, indicating upward momentum.
- If US30 remains above 45000, it may approach the 100% Fibonacci Extension at around 46670.
- On the contrary, staying below 45000 may prompt a retest of the EMA21 and the ascending channels' lower bound.
Analysis by: Dat Tong, Senior Financial Markets Strategist at Exness
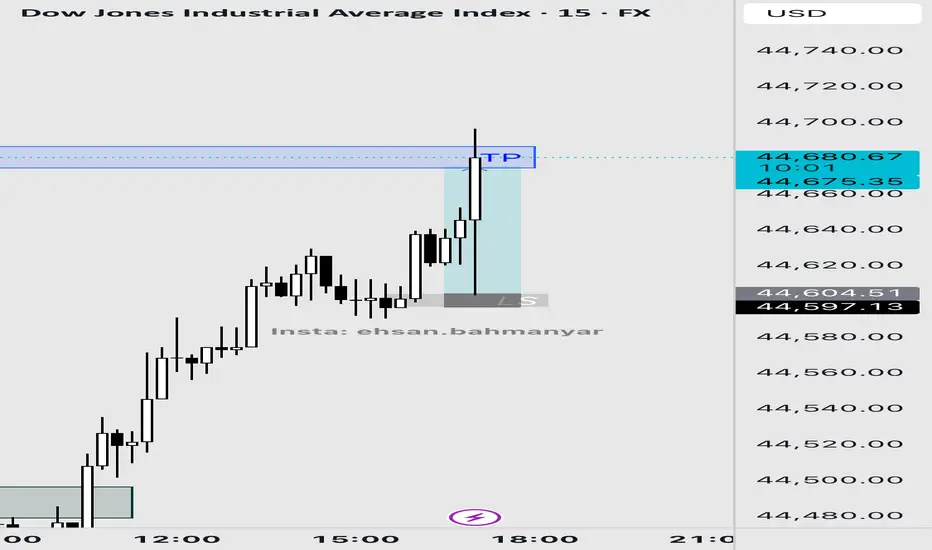
US30 15M DEMAND SETUPAsia session opened in consolidation before London session breaking both session lows and highs. Price swept liquidity above the highs then reversed with solid downside volume. At 8:30 AM news injected strong volatility driving price into my 15M demand zone. With the broader trend still showing strong bullish structure. I took the trade entering on a 5M candle break and placing stops below the zones low targeting 1:2 R:R. Price consolidated briefly hit my stoploss then reversed directly to target. Solid setup and execution — market simply moved on its own terms.

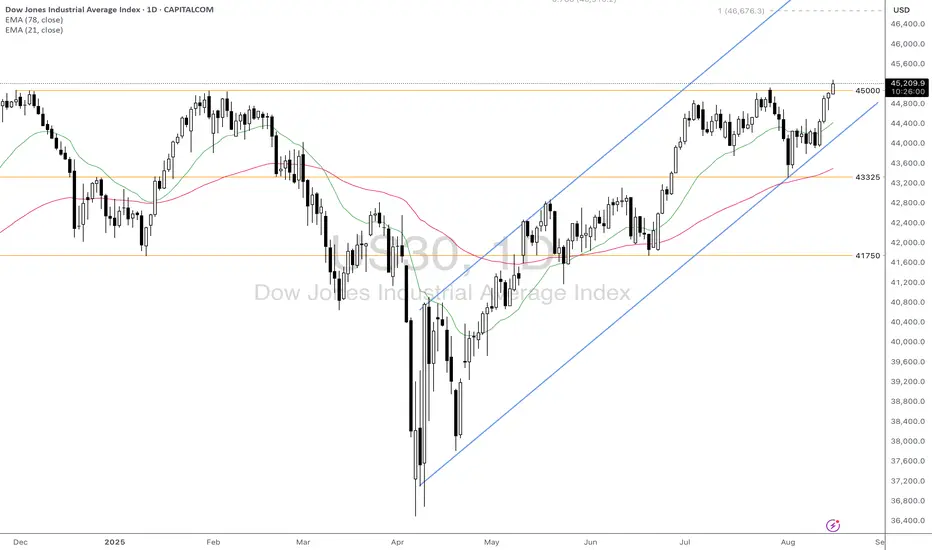
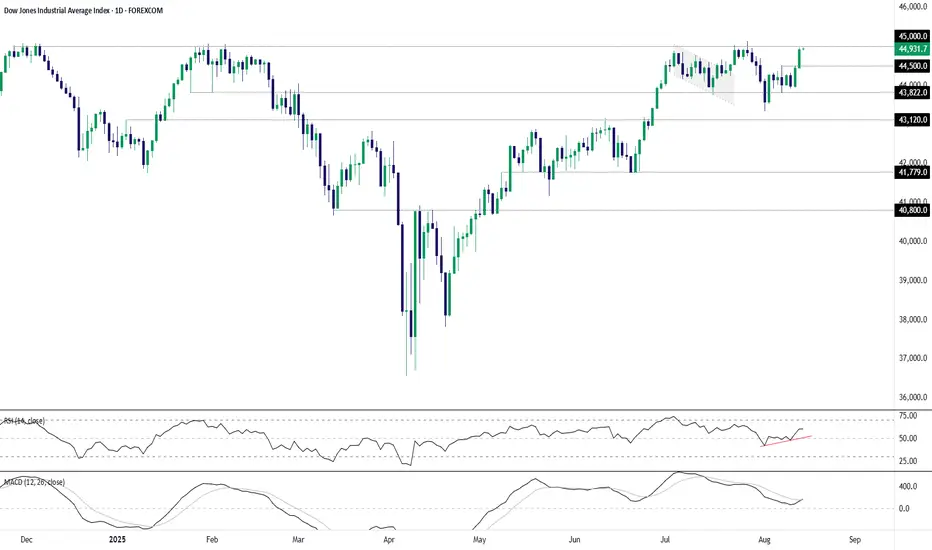
45,000 or Bust: Dow Faces Familiar Resistance Test45000 and Dow Jones bulls have not been the best of friends over the past year, with the index repeatedly rejected at the level going back to November after the Presidential election. But that hasn’t been enough to deter the bulls from having another crack, with the price back knocking on the door again following the latest rally.
RSI (14) is trending higher but not yet overbought, signalling a bias in the same direction. MACD has just confirmed the bullish signal, crossing the signal line from below in positive territory.
Combined, the price action and momentum picture suggests that if we see another attempt on the level, the move may well stick.
If we see a clean break above 45000, consider initiating longs with a stop beneath for protection. A close above 45000 would be preferred given how many times the price has failed at the level. Rather than nominate a specific target, big figures and watching for obvious reversal patterns may provide guidance on when to exit the trade.
If the bulls fail again, 45000 has proven to be a rich hunting ground for bears over the past year. Shorts can be established beneath the level with a stop above for protection. 44500, 43822 and the Aug 1 low of 43332 are possible targets depending on desired risk-reward.
Good luck!
DS
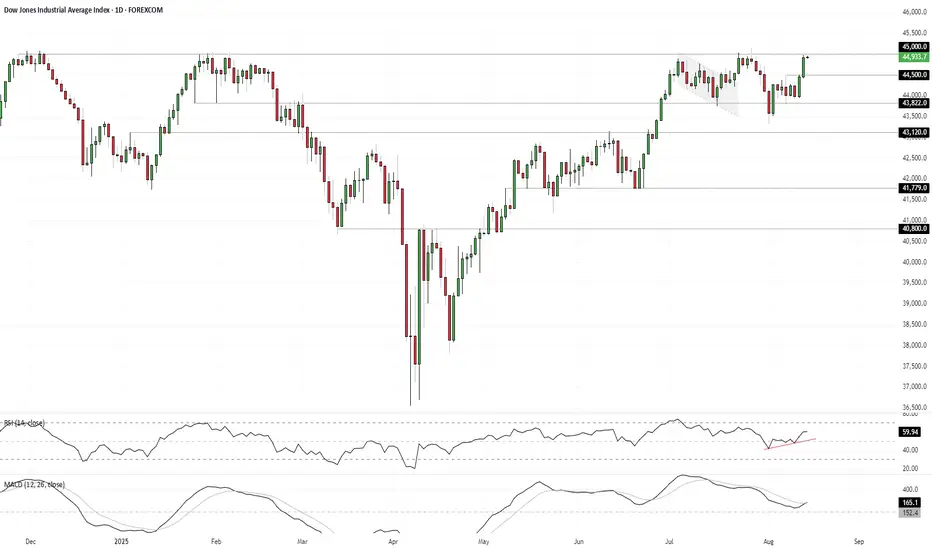
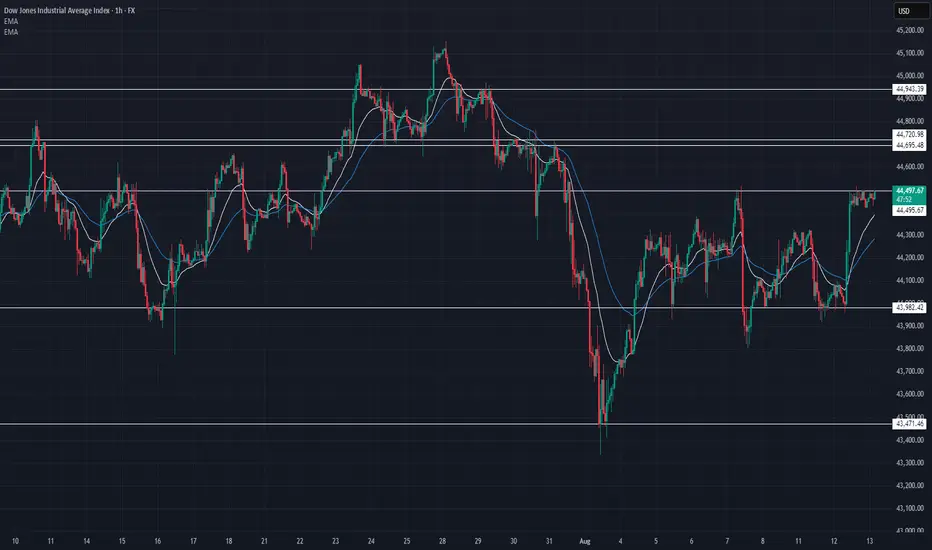
US30 Technical Breakdown – 08/13/2025📍 US30 Technical Breakdown – 08/13/2025
US30 is trading around 44,484, pressing against the 44,495 resistance after a strong recovery from the 43,471 low earlier this month. The move has flipped EMAs back to bullish alignment, but overhead supply between 44,495–44,720 remains the main obstacle.
A clean breakout above 44,495 could open the door for a retest of 44,695–44,720, while failure to hold this momentum risks a pullback toward 44,200–43,982.
📊 Current Market Behavior:
📈 EMAs reclaimed and aligned bullish
📊 Testing upper resistance after multi-day climb
🧱 Key supply stacked just above price
⚠️ Short-term bullish, but breakout confirmation needed
📌 Key Levels:
🔹 Resistance Zones:
44,495 → Immediate breakout pivot
44,695–44,720 → Major supply
44,943 → Swing high
🔹 Support Zones:
44,200 → Short-term support
43,982 → Key demand area
43,471 → Major base
🧠 Bias:
📈 Bullish Intraday
Momentum is in bulls’ favor above 44,200, but sellers will likely defend 44,495–44,720.
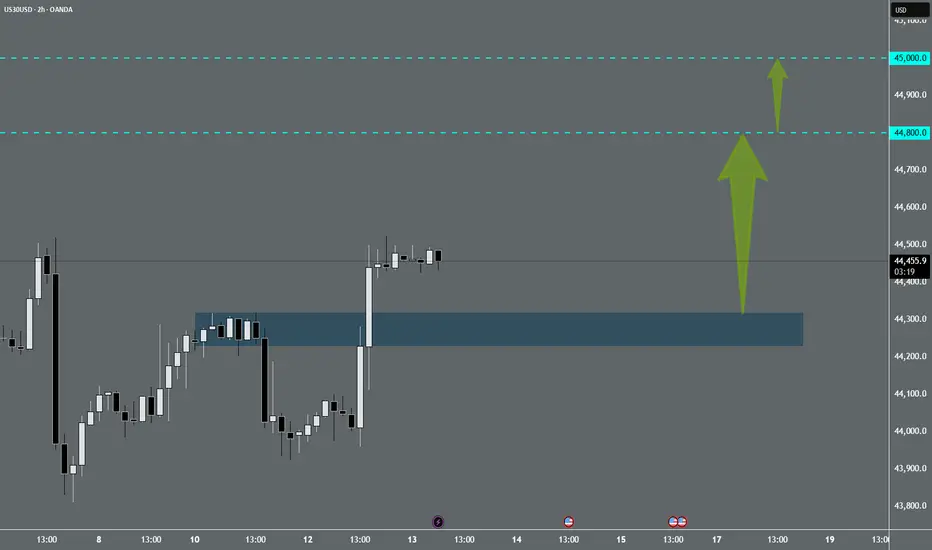
US30 Update - Potential TargetsDear Friends in Trading,
How I see it,
Stocks are roaring with the cooling inflation report.
I sincerely hope my point of view offers a valued insight
Thank you for taking the time study my analysis.
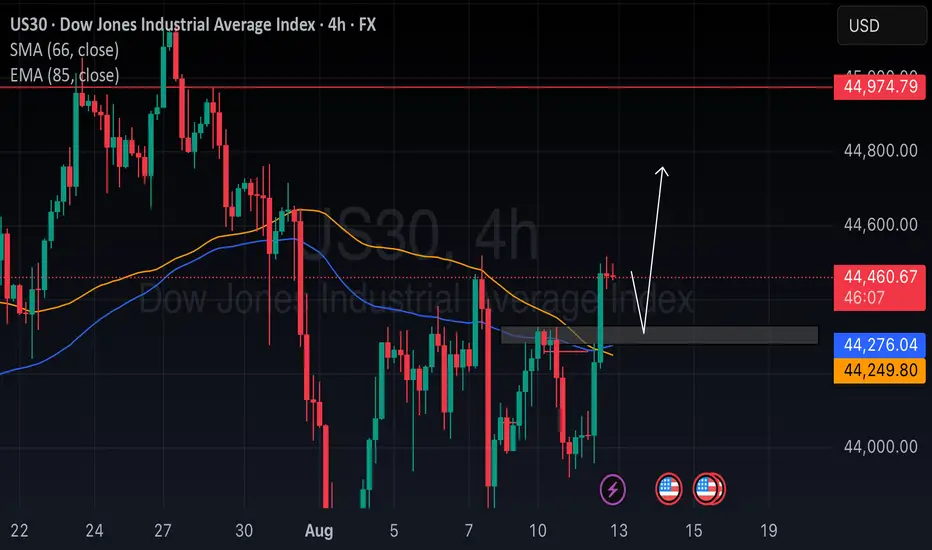
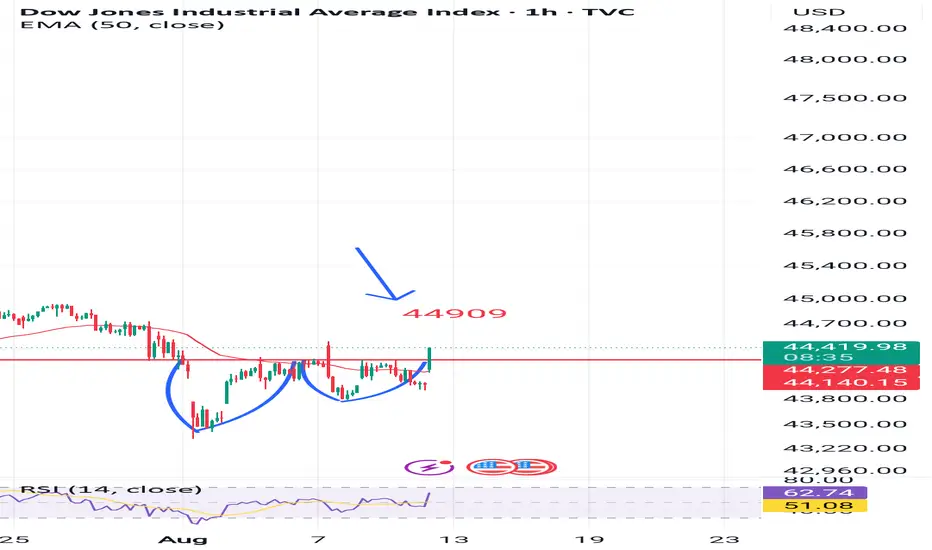
Cup and handle breakout in dow jonesNow cup and handle pattern observed in dji index.
Also the breakout of neckline implying bullish movement hence making the next target 44900.
Which could also affect indian market.