DOWUSD trade ideas
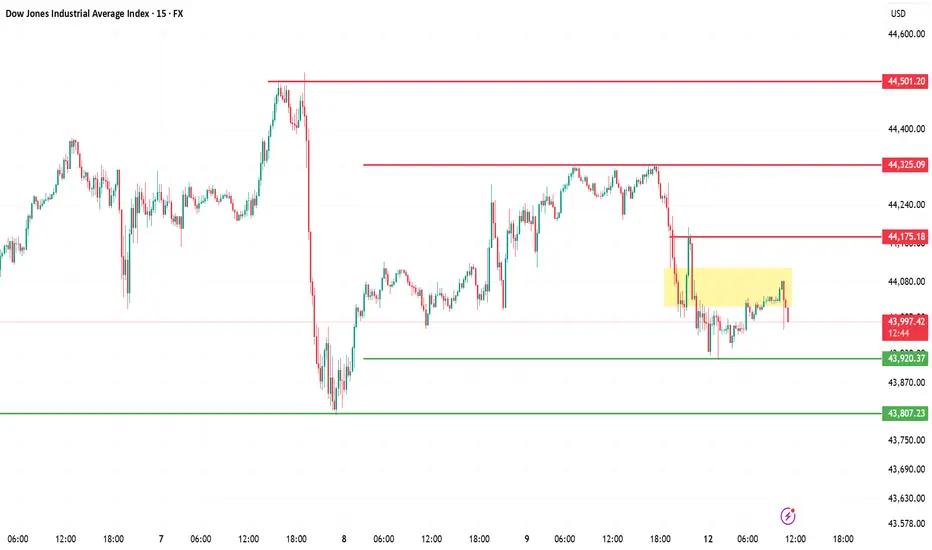
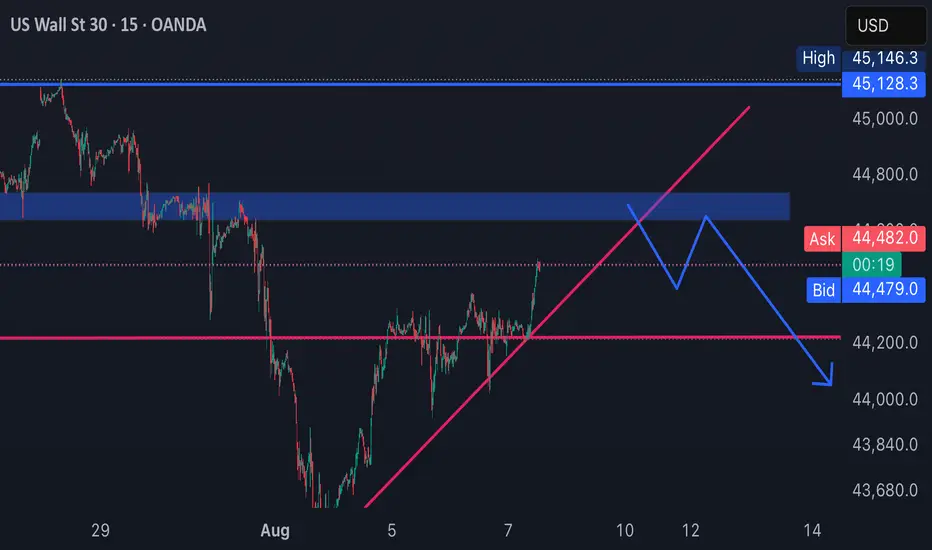
Dow Jones (DJI) – 15M Chart Analysis | Aug 12, 2025
1. Current Price Action:
Trading at 44,026, price is consolidating within a tight range after rejection from the yellow resistance zone (~44,080).
2. Resistance Levels:
Key hurdles at 44,175, 44,325, and the major top at 44,501. Bulls must clear 44,175 for a momentum shift.
3. Support Levels:
Nearest support at 43,920, followed by 43,807. A break below these could trigger further downside pressure.
4. Trend Outlook:
Short-term sentiment is bearish-neutral with lower highs forming; buyers need a decisive breakout to change structure.
5. Trading Bias:
Bullish: Break above 44,175 → targets 44,325/44,501.
Bearish: Drop below 43,920 → opens path toward 43,807 and potentially lower.
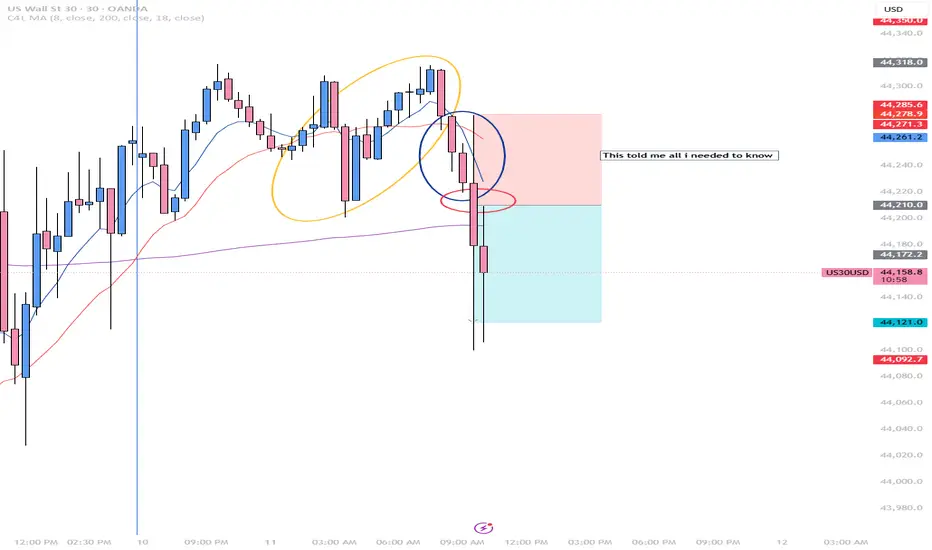
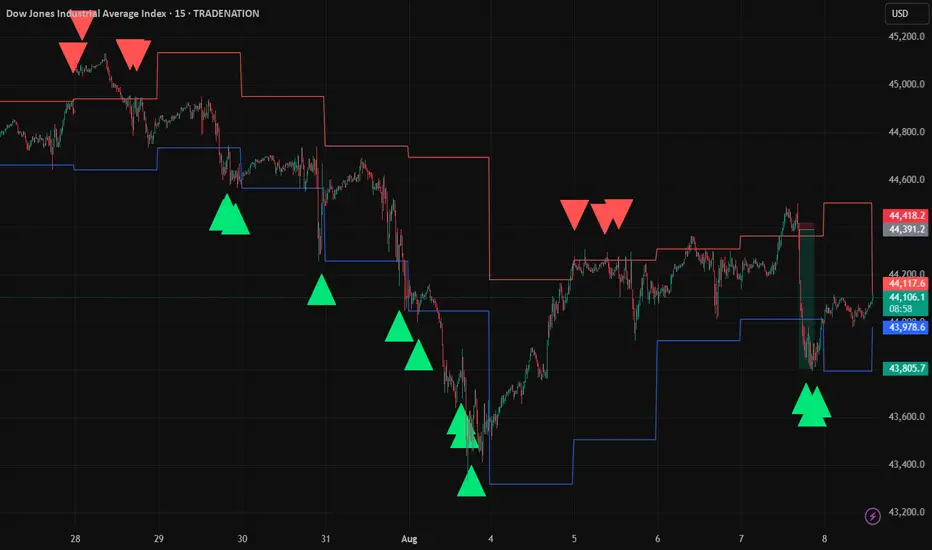
08/11 Killer Sell Trade Patience pays in the stock market. I knew the downtrend was coming strong but I needed my usual signals:
1. Variation: Yellow
2. Wigle rejecting the opposite side: Blue to point out the wick.
3. Volume: I used a pending order waiting for it to come down to fill it.
I closed manually but i hit my 1.1 easily
Us30usd longThe first Dow Jones trade did not reach my entry point, I entered higher I am not responsible for the risk on the trade
Long us30usdThe first Dow Jones trade did not reach my entry point, I entered higher I am not responsible for the risk on the trade
Us30usd longDowJones Analysis and Trading for Tomorrow's First Week.
I am not responsible for taking risks.
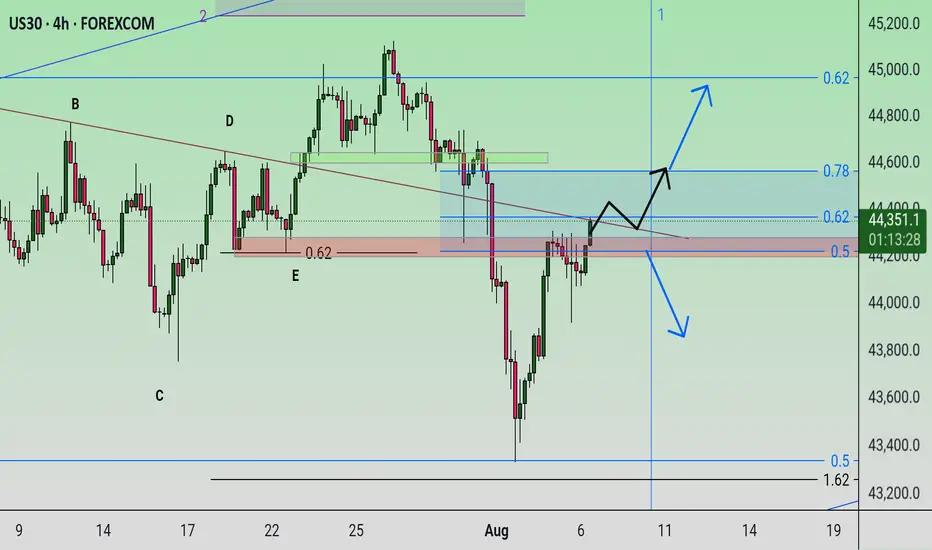
US30--LONG--monthly,weekly,daily trend is bullish
--if price breaks yellow line, retest the black horizantal line enter the trade

US30 – Bullish Break Above 44,300.00After bouncing off 43,450.00, US30 surged past 44,120.00 and is now holding above the key 44,300.00 resistance-turned-support level.
Support at: 44,300.00 🔽 | 44,120.00 | 43,770.20
Resistance at: 44,700.00 🔼 | 44,922.00 | 45,136.10
🔎 Bias:
🔼 Bullish: Holding above 44,300.00 could fuel a rally toward 44,700.00 and beyond.
🔽 Bearish: A drop back below 44,300.00 may expose 44,120.00 and 43,770.20.
📛 Disclaimer: This is not financial advice. Trade at your own risk.

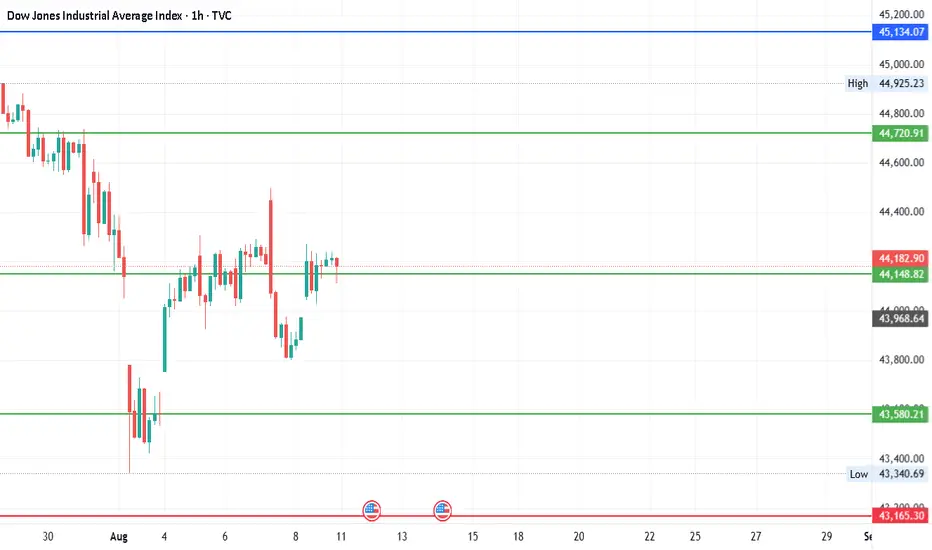
#DJI - Levels for Aug 2025Date: 09-08-2025
#DJI - Current Price: 44175.61
Pivot Point: 44149 Support: 43580 Resistance: 44721
#DJI Upside Targets:
| 🎯 Target 1 | 45134 |
| 🎯 Target 2 | 45547 |
| 🎯 Target 3 | 46072 |
| 🎯 Target 4 | 46596 |
#DJI Downside Targets:
| 🎯 Target 1 | 43165 |
| 🎯 Target 2 | 42750 |
| 🎯 Target 3 | 42226 |
| 🎯 Target 4 | 41702 |
#TradingView #Nifty #BankNifty #DJI #NDQ #SENSEX #DAX #USOIL #GOLD #SILVER
#BHEL #HUDCO #LT #LTF #ABB #DIXON #SIEMENS #BALKRISIND #MRF #DIVISLAB
#MARUTI #HAL #SHREECEM #JSWSTEEL #MPHASIS #NATIONALUM #BALRAMCHIN #TRIVENI
#USDINR #EURUSD #USDJPY #NIFTY_MID_SELECT #CNXFINANCE
#SOLANA #ETHEREUM #BTCUSD #MATICUSDT #XRPUSDT
#Crypto #Bitcoin #BTC #CryptoTA #TradingView #PivotPoints #SupportResistance
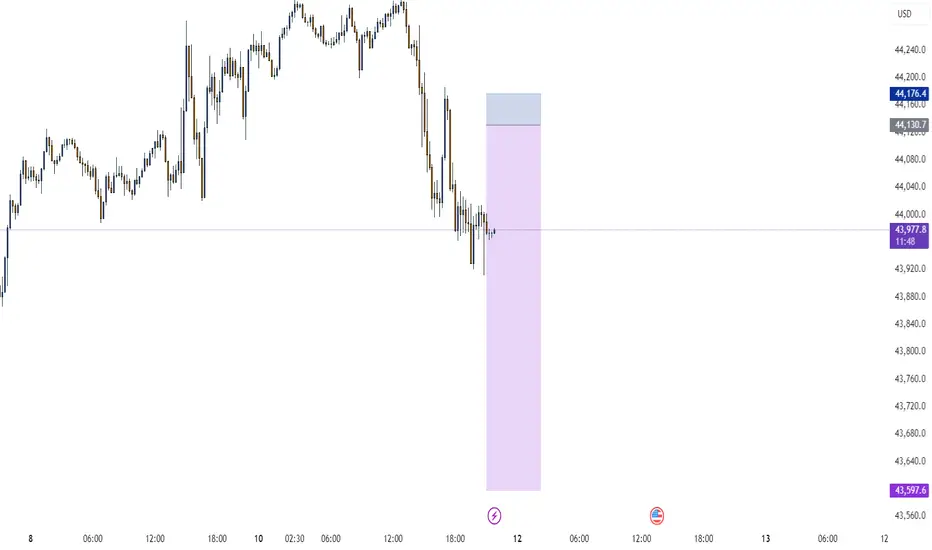
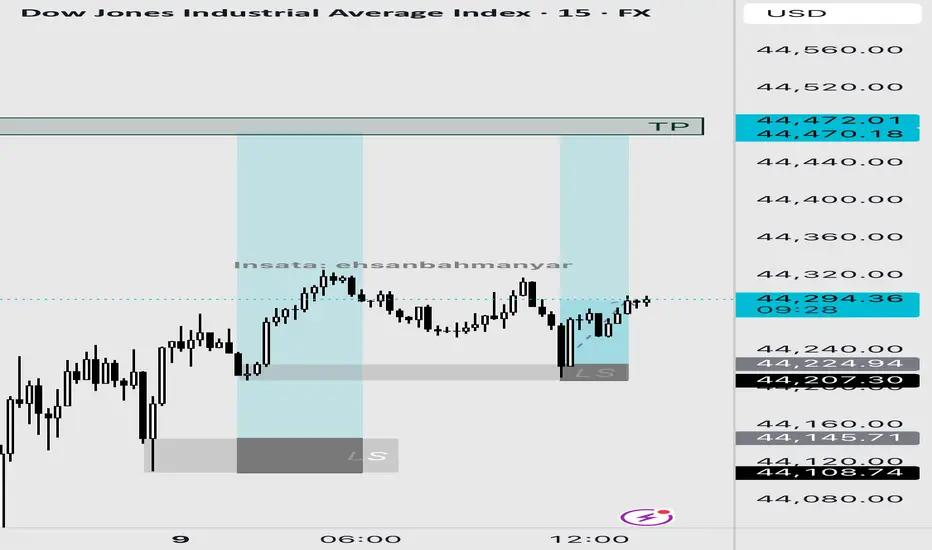
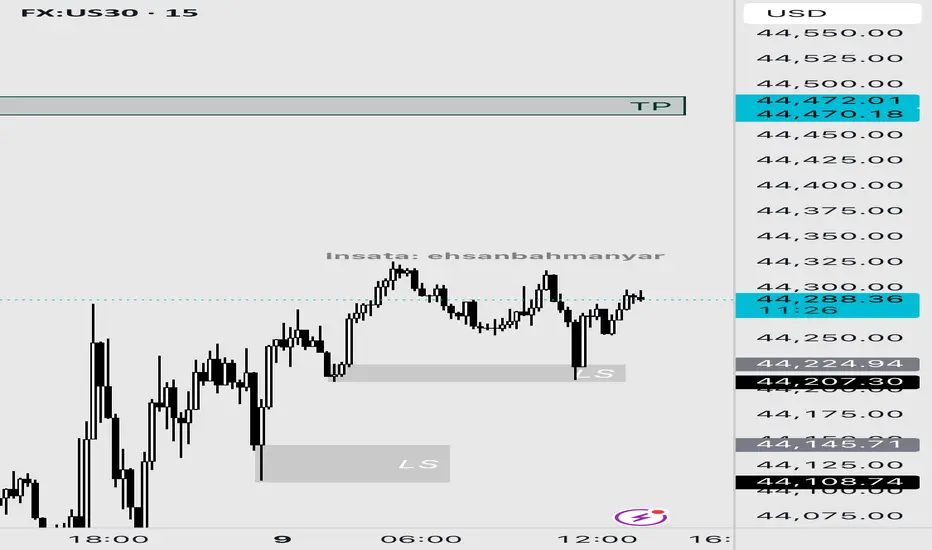
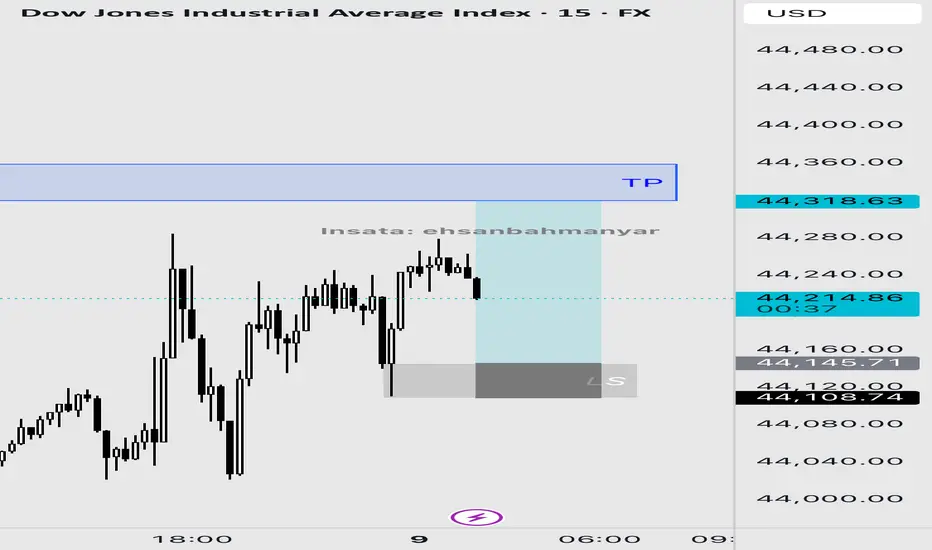
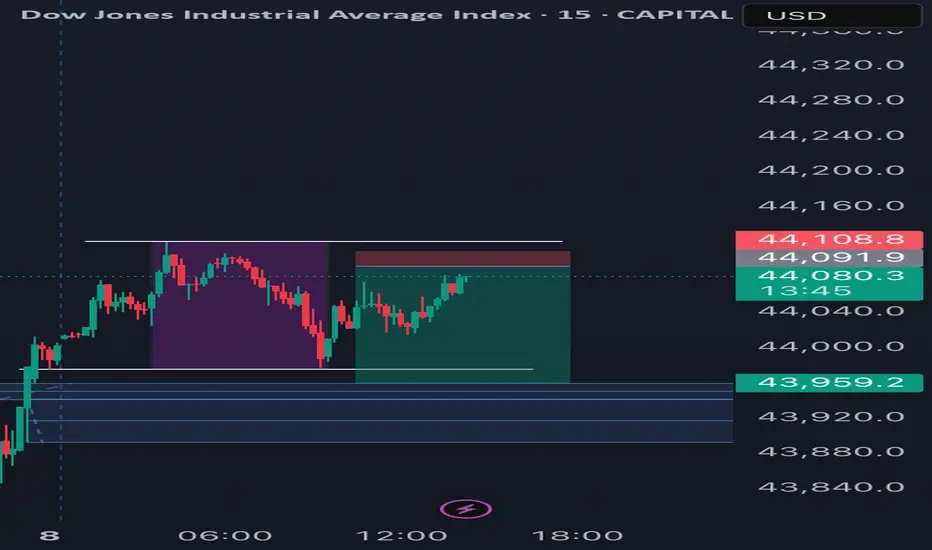
US30 Liquidity Grab Strategy – 15m Chart (1m Precision Entries)Description:
This idea showcases my Liquidity Grab Entry Signals strategy, optimized for US30.
The setup identifies daily high/low liquidity zones with a sensitivity buffer, then confirms reversals using strong engulfing candles.
Key Points:
Daily Liquidity Levels plotted automatically.
Buffer Zone detects price interaction with liquidity.
Engulfing Confirmation for higher probability entries.
Long when price rejects daily low with bullish engulfing.
Short when price rejects daily high with bearish engulfing.
While the precision entries are taken on the 1-minute chart, this 15-minute chart is shown for publication purposes in line with TradingView rules.
Example (Yesterday & Today):
Multiple clean rejections at daily liquidity zones.
Clear 1:15–1:20 R:R potential with minimal drawdown.
Risk Management:
Suggested SL: 10–15 points beyond liquidity zone.
Suggested TP: the next key level.
Precise 1 min entry shown here:
$DJI📊 TVC:DJI – Market Outlook Ahead of Inflation Data
As we head into next week’s inflation report, market sentiment is showing signs of cautious optimism. Recent signals from China suggest a slowing in money supply growth, which could be part of an effort to stabilize domestic markets and control capital flows.
At the same time, the possibility of a 90-day truce in U.S.–China tensions may give investors some breathing room, especially around trade and supply chain concerns. If such a pause materializes, it could help maintain a temporary balance in global supply chains, reducing immediate inflationary pressures.
For the Dow Jones, this combination of monetary restraint in China and geopolitical stability—even if short-lived—may support a steadier market tone in the near term. However, the upcoming inflation data will be the key driver to confirm whether this calm can extend or if volatility will return.
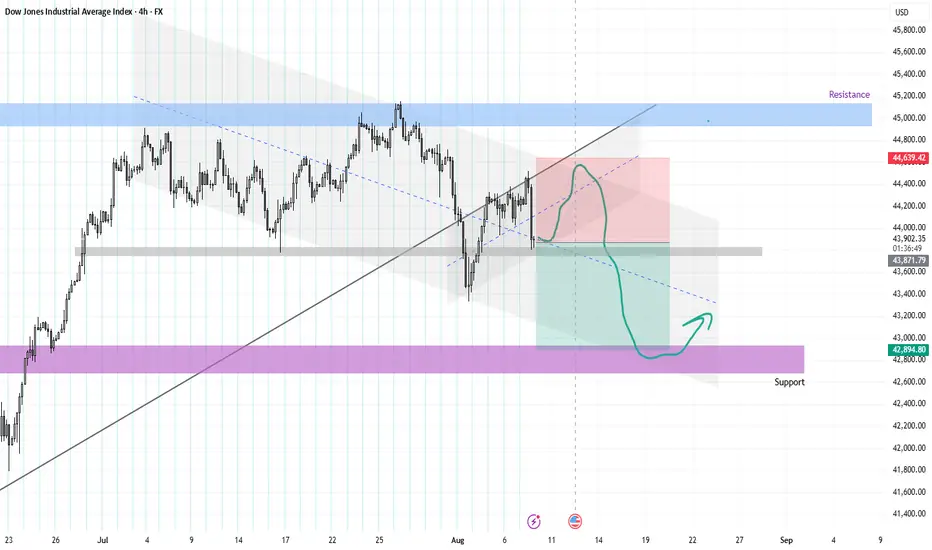
US30This chart displays the Dow Jones Industrial Average Index (4H timeframe), with key technical zones and trendlines marked to illustrate potential price movements. The price is currently at 43,894, just below a key ascending trendline (black) that has been recently broken. The chart also highlights resistance around 45,000 (blue zone) and support near 42,800 (purple zone).
The green curved path drawn on the chart indicates a potential bearish scenario. After a brief consolidation around the current price and broken trendline, the price is expected to fail to reclaim the previous structure, leading to a drop. The projected move suggests a sharp decline toward the support zone around 42,800, where demand might return and trigger a bounce.
This scenario implies bearish pressure in the short term, possibly due to rejection from the resistance zone and loss of trendline support. The suggested bounce near 42,800 implies that this level could serve as a buying opportunity or a reversal point, making it a key area to watch for potential long setups or confirmation of continued weakness.
Short Looking for major bearish momentum when market reaches 44,740 having multiple previous rejections at this level.
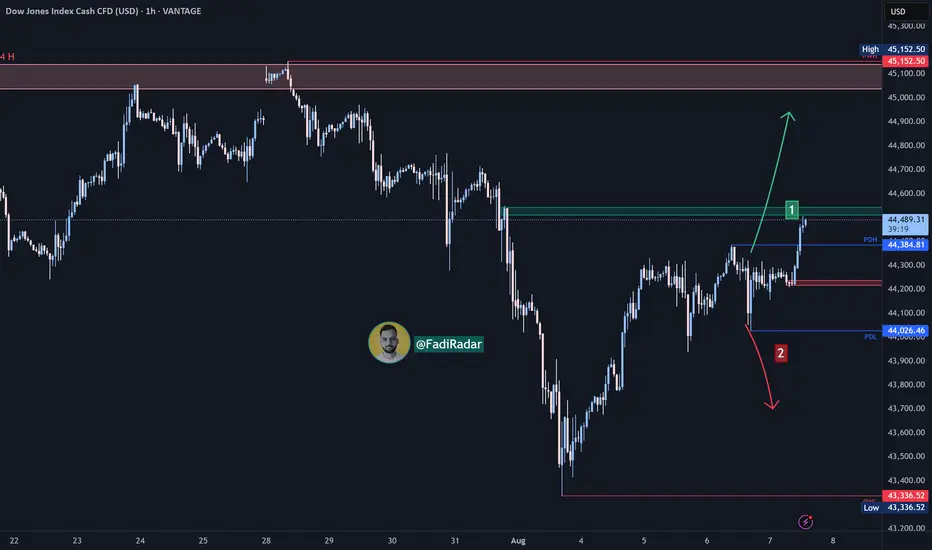
Dow Jones Index (US30 / Dow Jones) Analysis:The Dow Jones index opened the day with bullish momentum and is currently trading near 44,500.
🔻 Bearish Scenario:
If the price fails to break above 44,500 and selling pressure returns, a break below 44,200 could push the index back toward 44,000, which is a key support in the short term. A confirmed break below that level may open the way for a drop toward 43,700.
🔺 Bullish Scenario:
If the price breaks and holds above 44,500, which is the more likely scenario, we could see continued upside movement toward 44,700, followed by the strong resistance zone at 45,000.
⚠️ Disclaimer:
This analysis is not financial advice. It is recommended to monitor the markets and carefully analyze the data before making any investment decisions.
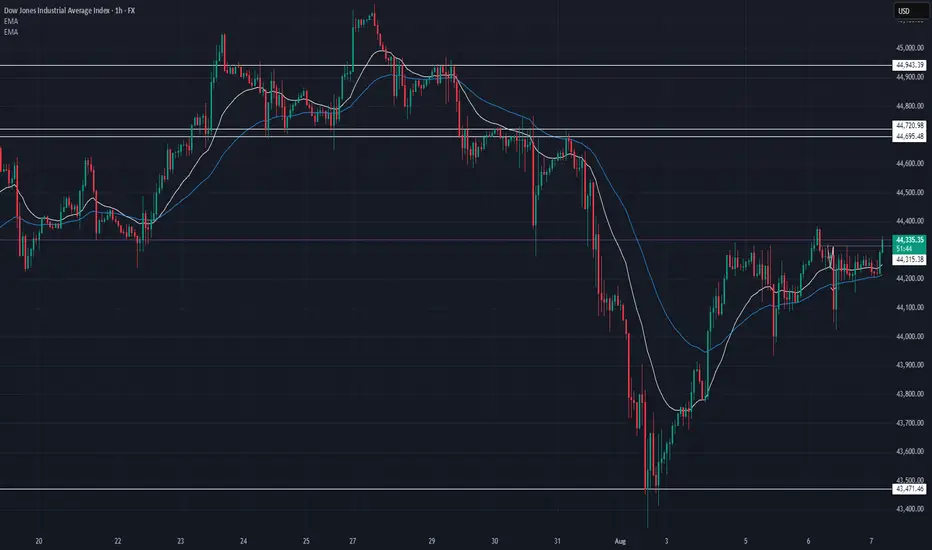
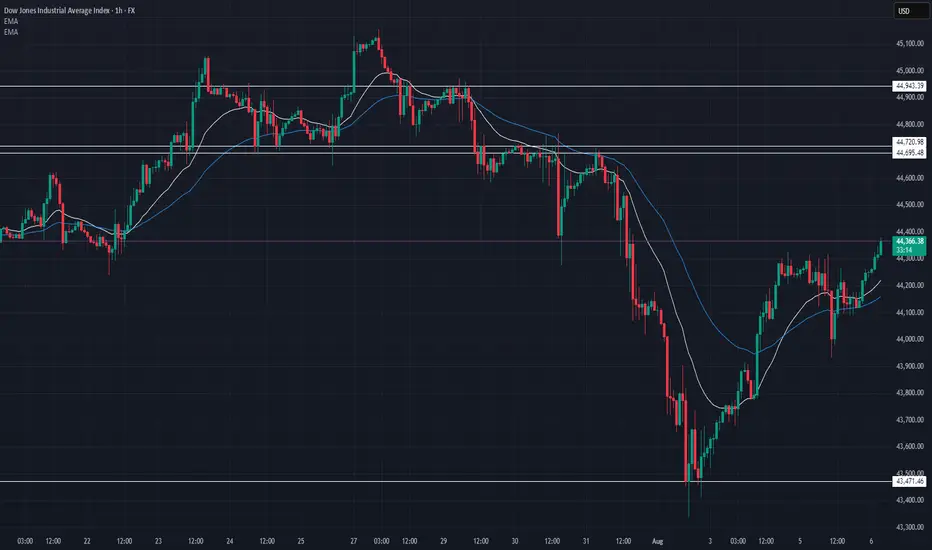
US30 Technical Breakdown – 08/07/2025📍 US30 Technical Breakdown – 08/07/2025
US30 is consolidating below 44,360, continuing to coil tightly after its bounce from 43,500. Bulls have defended the 44,150–44,200 support zone, but upside momentum is stalling ahead of the 44,600–44,720 resistance wall.
This tightening range signals that a breakout—or rejection—is imminent. Volume remains low, suggesting the market is waiting for a catalyst.
📊 Current Market Behavior:
🔄 Sideways chop between 44,200–44,360
📉 Lower volume, tightening price action
🧱 Bulls holding support but struggling to push higher
⚠️ Key resistance test likely in the next sessions
📌 Key Levels:
🔹 Resistance Zones:
44,360 → Immediate breakout pivot
44,600–44,720 → Major supply zone
44,943 → Swing high resistance
🔹 Support Zones:
44,200–44,150 → EMA & structure support
44,000 → Psychological round level
43,471 → Recent bottom
🧠 Bias:
🔄 Neutral Intraday
Range-bound with fading volatility. Watch for breakout above 44,360 or failure to hold 44,200.
Us30S30 is currently respecting a key support zone, showing strong buyer interest. As long as this level holds, the bias remains bullish, with potential for price to push higher toward the next resistance levels.
Dow Jones Index Analysis (US30 / Dow Jones):The Dow Jones index showed a slight improvement at today’s market open and is currently trading near 44,300 USD, attempting to break through a nearby resistance level.
🔻 Bearish Scenario:
If the price fails to break above 44,300 USD and selling pressure returns, a break below 44,000 USD could send the index back toward 43,350 USD, which is considered a critical support zone in the short term.
🔺 Bullish Scenario:
However, if the index breaks above 44,300 USD and holds — which is currently the more likely scenario — we may see continued bullish momentum toward 44,700 USD, followed by the key resistance at 45,000 USD.
⚠️ Disclaimer:
This analysis is not financial advice. It is recommended to monitor the markets and carefully analyze the data before making any investment decisions.

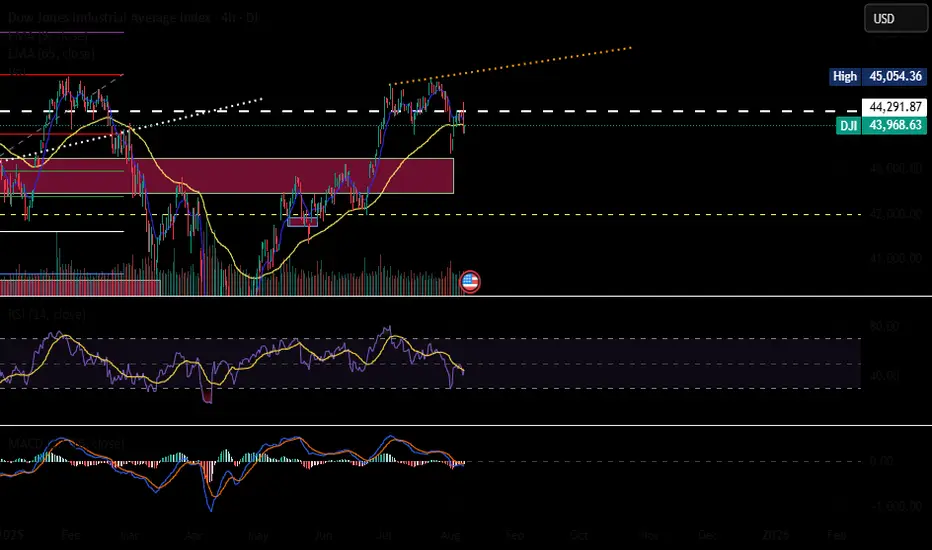
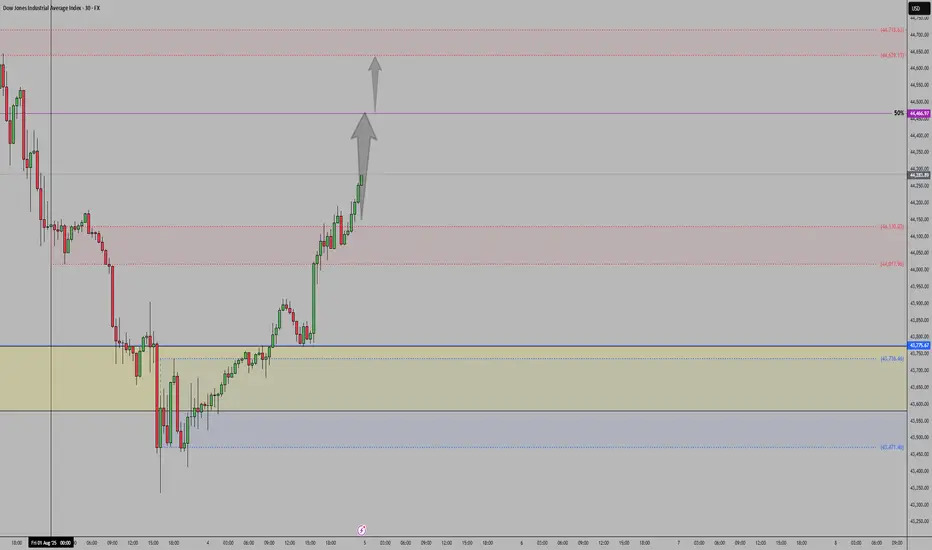
Uptrend It is expected that the resistance level will be broken and after consolidation above the resistance level, the uptrend will continue. Otherwise, a trend change and a continuation of the correction will be likely.
US30 Technical Breakdown – 08/06/2025📍 US30 Technical Breakdown – 08/06/2025
US30 continues its bullish recovery from the 43,500 lows and is now pressing into the 44,360 area. Price is printing higher highs and reclaiming key moving averages, building momentum ahead of the major 44,600–44,720 resistance zone.
A clean break above this range could open the door to 44,943+, while a failure may bring a pullback toward short-term support at 44,150–44,200.
📊 Current Market Behavior:
📈 Bullish momentum accelerating
📊 Price reclaiming structure above 44,300
🧱 Major test ahead at 44,600–44,720
⚠️ Overhead resistance – potential reversal zone
📌 Key Levels:
🔹 Resistance Zones:
44,380–44,400 → Immediate resistance (currently testing)
44,600–44,720 → Major breakout zone
44,943 → Last major high
🔹 Support Zones:
44,219–44,150 → EMA and structure support
44,000 → Psychological and structural support
43,471 → Recent swing low
🧠 Bias:
📈 Bullish Intraday
Momentum remains with buyers as long as price holds above 44,150. Key resistance test ahead.
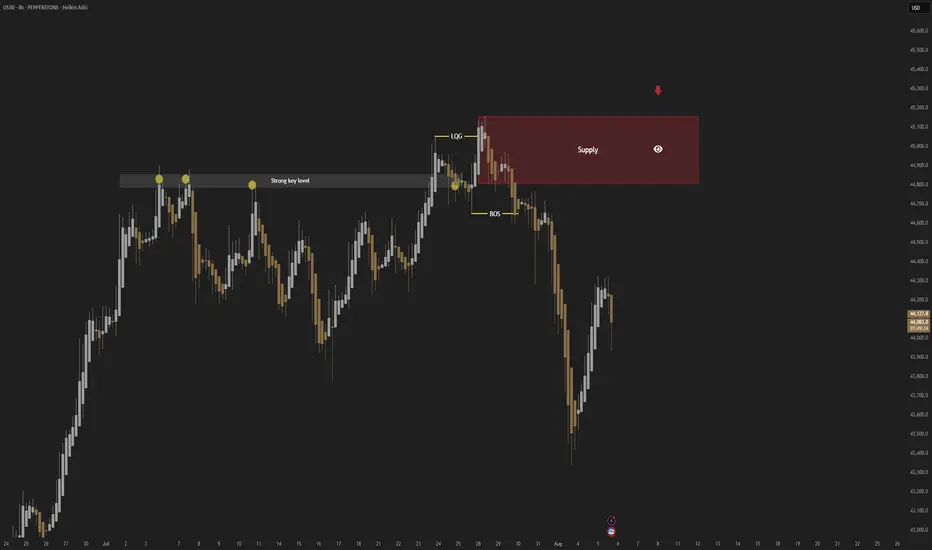
US30; Heikin Ashi Trade Idea📈 Hey Traders!
Here’s a fresh outlook from my trading desk. If you’ve been following me for a while, you already know my approach:
🧩 I trade Supply & Demand zones using Heikin Ashi chart on the 4H timeframe.
🧠 I keep it mechanical and clean — no messy charts, no guessing games.
❌ No trendlines, no fixed sessions, no patterns, no indicator overload.
❌ No overanalyzing market structure or imbalances.
❌ No scalping, and no need to be glued to the screen.
✅ I trade exclusively with limit orders, so it’s more of a set-and-forget style.
✅ This means more freedom, less screen time, and a focus on quality setups.
✅ Just a simplified, structured plan and a calm mindset.
💬 Let’s Talk:
💡Do you trade supply & demand too ?
💡What’s your go-to timeframe ?
💡Ever tried Heikin Ashi ?
📩 Got questions about my strategy or setup? Drop them below — ask me anything, I’m here to share.
Let’s grow together and keep it simple. 👊
