DOWUSD trade ideas

Dow Jones Index (US30) Technical Analysis:The Dow Jones Index has bounced from the 43,350 support after a sharp decline, currently trading near 44,000, testing nearby resistance.
🔹 Bearish Scenario:
If the price fails to break above 44,200 and selling pressure resumes, a drop below 43,800 could push the index back toward the 43,350 support area.
🔹 Bullish Scenario:
If the index breaks and holds above 44,200, the bullish move may continue toward 44,700, with further potential toward the 45,150 resistance zone.
⚠️ Disclaimer:
This analysis is not financial advice. It is recommended to monitor the markets and carefully analyze the data before making any investment decisions.

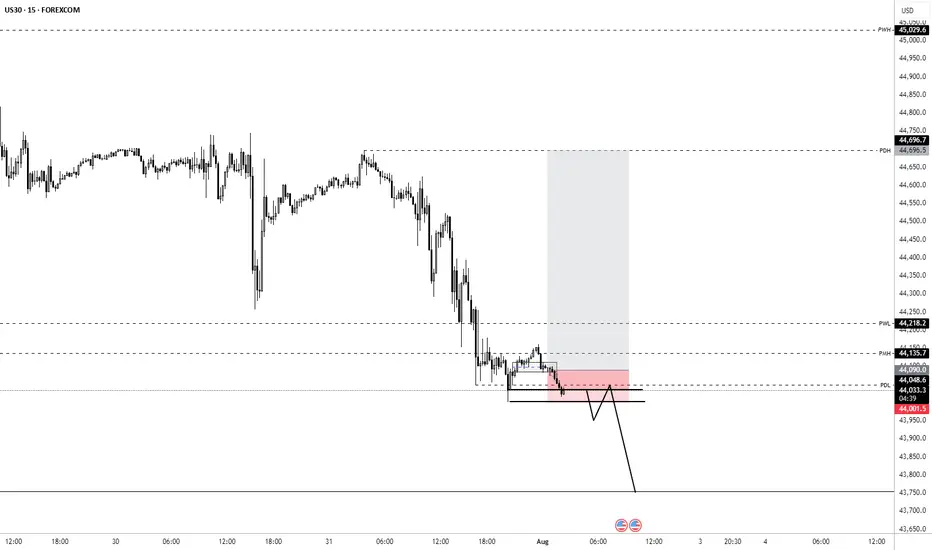
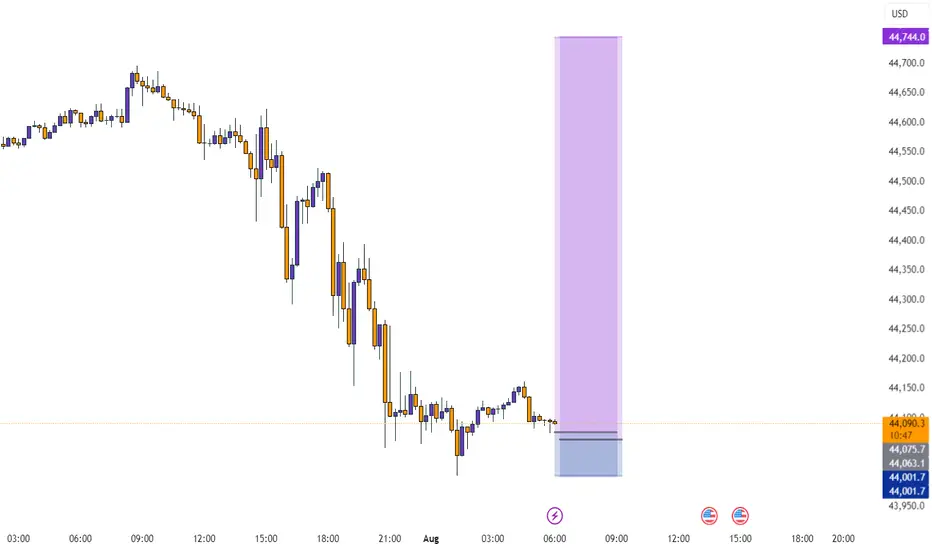
Sell US30US30 Sell Idea
Bearish Flag Pattern at NY open. Price should rapidly decline in the next few hours

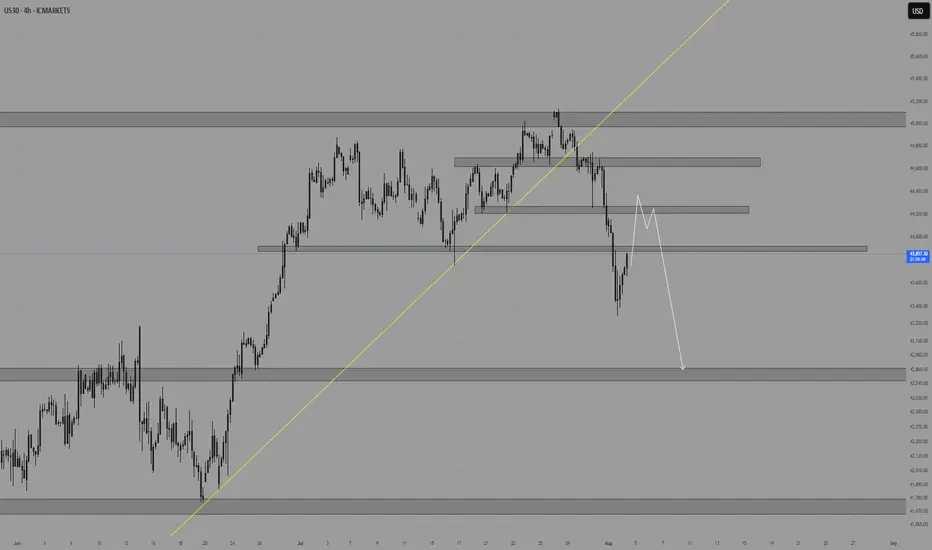
US30 ShortUS30 Short Setup – Bearish Retest Play
Idea: Looking for a short opportunity after a clean break of structure and trendline.
Breakdown:
Trendline Break: The rising trendline (yellow) has been decisively broken, signaling a shift in market structure.
Structure Shift: We saw a strong impulsive move to the downside, breaking previous higher lows and confirming bearish intent.
Key Resistance Zones: Price is now pulling back toward a key supply zone between 44,100 – 44,300, which aligns with previous support-turned-resistance.
Plan: I’m anticipating a potential lower high formation around this zone, followed by rejection and continuation to the downside.
Target Zone: My short target is the demand area around 42,900 – 42,600 where price last consolidated before the previous rally.
Invalidation: If price reclaims and holds above 44,400, the short idea becomes invalid.


US30: Will Go Down! Short!
My dear friends,
Today we will analyse US30 together☺️
The recent price action suggests a shift in mid-term momentum. A break below the current local range around 47,577.1 will confirm the new direction downwards with the target being the next key level of 43,436.6 .and a reconvened placement of a stop-loss beyond the range.
❤️Sending you lots of Love and Hugs❤️

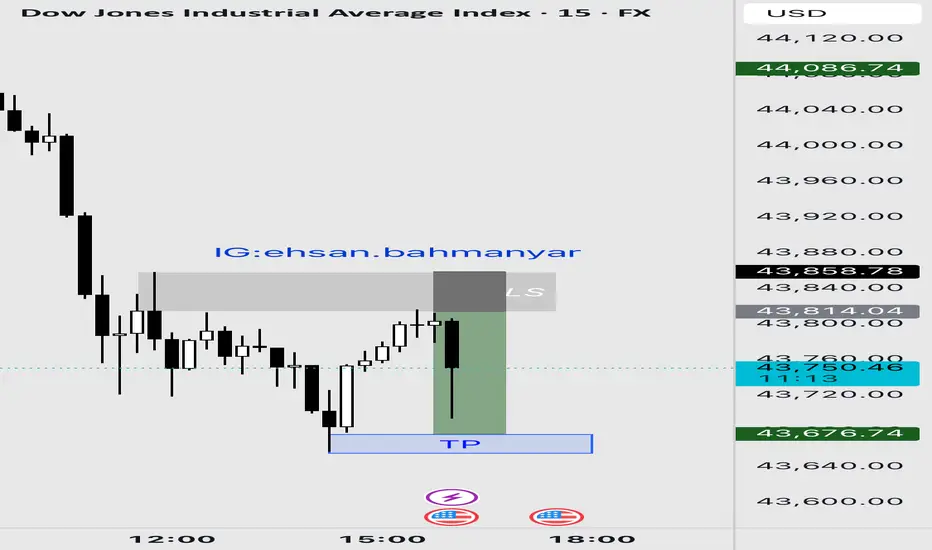
US30 (15M) – Bearish Reversal Setup, Short Opportunity📊 Analysis:
The US30 index on the 15-minute chart is showing signs of a bearish reversal after a recent upward push. Key technical observations:
1. Price Action & Structure
* US30 has been trading in a minor uptrend, but momentum is weakening.
* The latest 15M candles show lower highs forming near resistance, suggesting exhaustion in buying pressure.
2. Resistance Zone
* The price is rejecting a strong intraday resistance zone near 43641.90.
* Multiple failed attempts to break above this level reinforce it as a key barrier.
3. Target Levels
* First support target: 43206.96 – a minor support from previous structure.
* Secondary target: 41911.76.
4. Risk Management
* Suggested stop-loss: Above the recent swing high.
* Risk/reward ratio: Aim for at least 1:2 to ensure proper trade efficiency.
✅ Summary:
US30 on the 15-minute chart is showing a bearish setup.
⚠️ This analysis is for educational purposes only and not financial advice. Always use proper risk management.

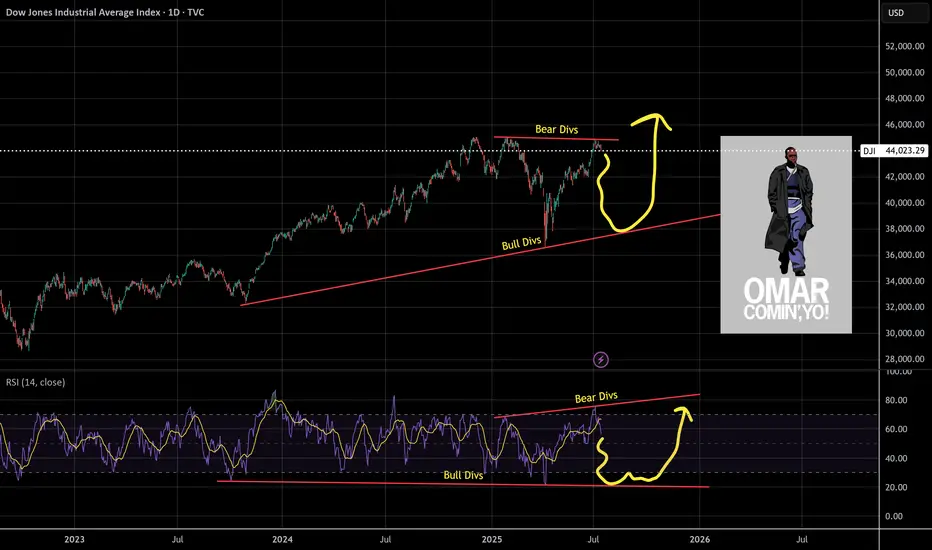
Shakeout On The WayUnlike the SPX, the DJI didn't make a higher-high. Why is this? I think partially because it's price weighted as opposed to market cap weighted like the Nasdaq or SPX. The other part would be CPI numbers.
So what's next for the DJI? I see hidden bullish divs long term and hidden bearish divs short term, this a common shake out tactic I see to liquidate longs and shorts. I'll be looking to load up on the trade at the bottom of the channel and play the range as it develops.
As always: stay calm, don't panic, and don't forget you can always use a stop loss
The fear and green index is at 74, when people are greedy be fearful.
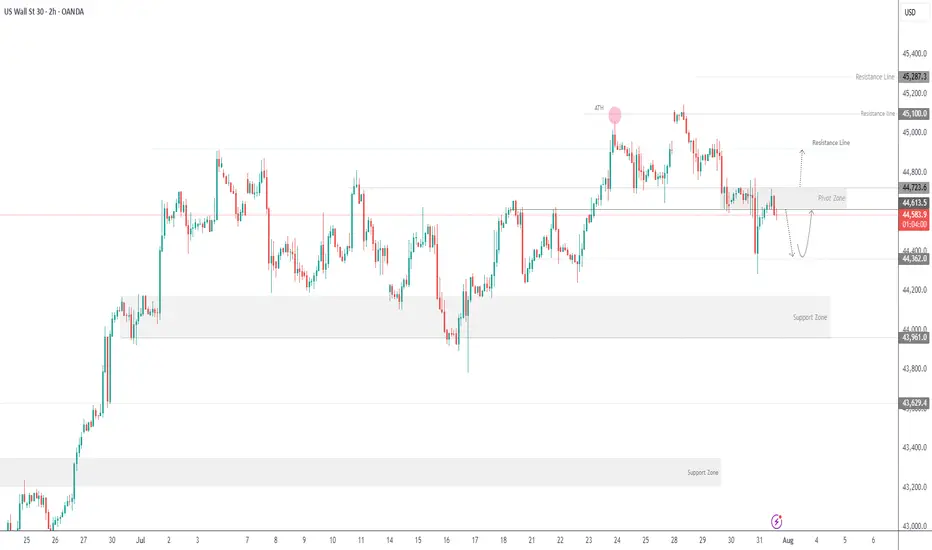
US30 Faces Pressure Below 44610US30 Overview
Technical Outlook:
US30 is showing bearish momentum while trading below the pivot zone at 44610. As long as the price remains under this level, downside pressure may continue toward 44360, with further support at 44180.
However, a confirmed breakout above 44720 would shift the bias to bullish, opening the path toward 44910 and potentially 45100.
Support Levels: 44480 • 44360 • 44180
Resistance Levels: 44720 • 44910 • 45100
Bias: Bearish below 44610, Bullish above 44720
DowJones ahead of US Employment dataKey Support and Resistance Levels
Resistance Level 1: 44390
Resistance Level 2: 44720
Resistance Level 3: 45100
Support Level 1: 43580
Support Level 2: 43360
Support Level 3: 43140
This communication is for informational purposes only and should not be viewed as any form of recommendation as to a particular course of action or as investment advice. It is not intended as an offer or solicitation for the purchase or sale of any financial instrument or as an official confirmation of any transaction. Opinions, estimates and assumptions expressed herein are made as of the date of this communication and are subject to change without notice. This communication has been prepared based upon information, including market prices, data and other information, believed to be reliable; however, Trade Nation does not warrant its completeness or accuracy. All market prices and market data contained in or attached to this communication are indicative and subject to change without notice.

Dow Jones Index Analysis (US30 / Dow Jones):🔹 The Dow Jones index has seen a sharp decline over the past two days, approaching the 43,590 USD support zone.
1️⃣ If the price rebounds from this level and bullish momentum leads to a break and close above 44,100 USD, the index may retest the 44,700 USD area.
2️⃣ However, if the price breaks below 43,600 USD and holds, further downside is likely, with a potential move toward 43,100 USD.
⚠️ Disclaimer:
This analysis is not financial advice. It is recommended to monitor the markets and carefully analyze the data before making any investment decisions.

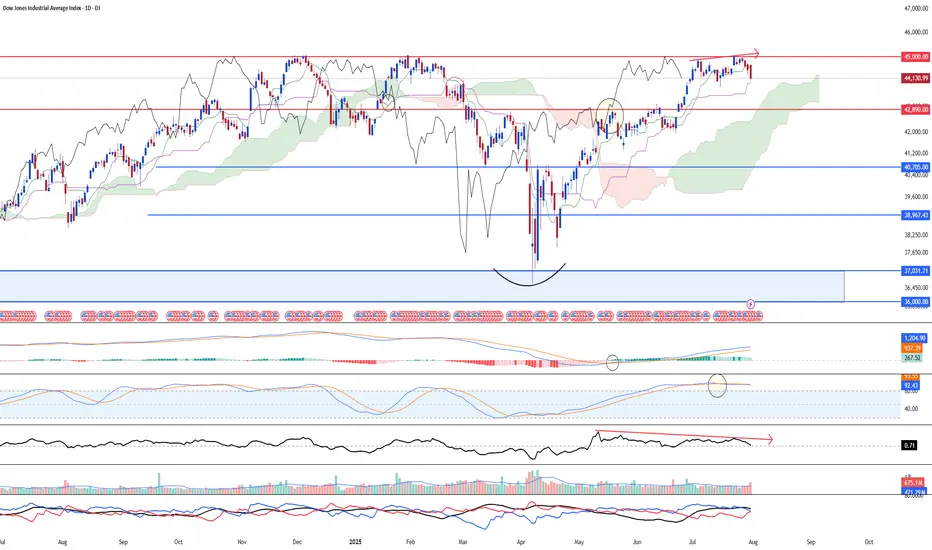
Correction ahead for DJIA, attributed to weak momentumDJ:DJI saw strong potential of a larger degree correction targeting 42,890 or lower support at 41,935. Reason being that there's a bearish divergence between the price chart and 23-period ROC. Furthermore, mid-term stochastic has shown bearish overbought signal. Another worthy price action signal showing weakness is that the index has fail to break above the high at 45,000 psychological level.
Despite the weak outlook, we are looking at a long-term upside targeting 46,200 (6 months and beyond)
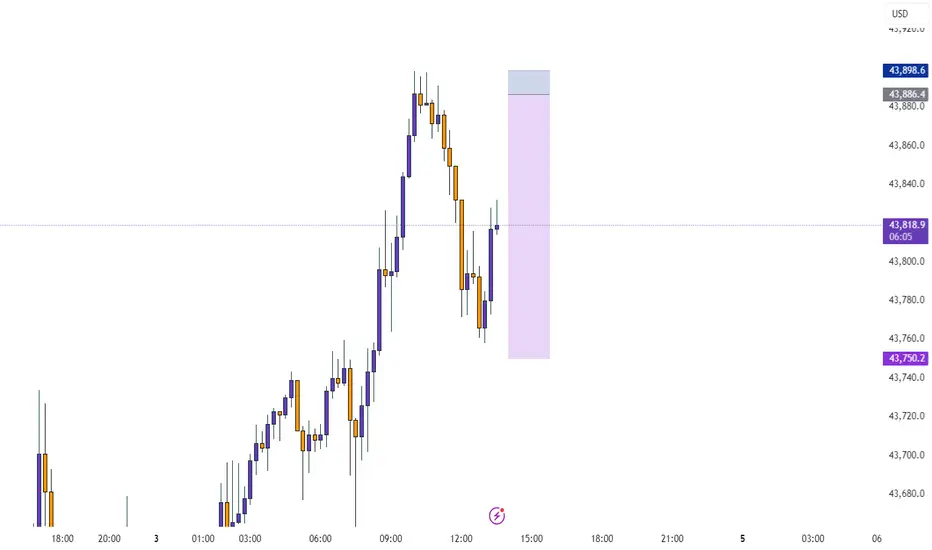
Dow Jones US30 Trend Analysis and Trade Plan Breakdown📈 US30 (Dow Jones) is currently in a strong bullish trend 🔥. This is clearly visible on the 4H chart, where we’re seeing a consistent pattern of higher highs and higher lows 🔼🔼.
👀 I’m watching for a potential long opportunity, especially since the higher timeframes remain firmly bullish 🟢.
🎥 In the video, we break it down:
A quick overview of the 4-hour structure
Then dive into a potential trade setup on the 30-minute chart ⏱️🔍
🧠 This is for educational purposes only and not financial advice ⚠️📚

DOW?
Hi
Decision timee
If you're buyers
WAIT
If you're sellers
WAIT
This week would give a clearer direction
I will have patience.
I am incline to be bullish
All the best
Not a guru

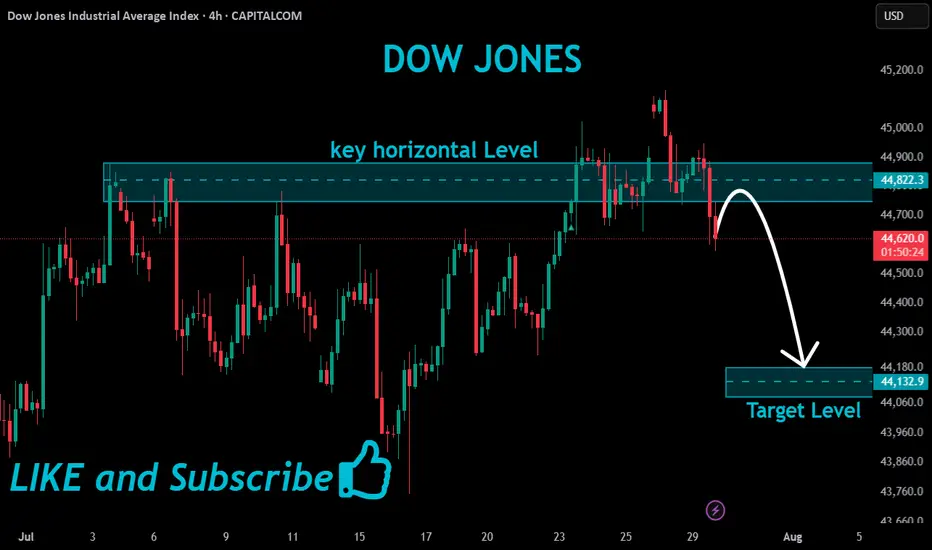
US30 Bearish Breakout!
HI,Traders !
#US30 made a bearish
Breakout of the key horizontal
Level of 44822.3which also
Seems to have been a neckline
Of the small H&S pattern so
We are locally bearish biased
And we will be expecting a
Further bearish move down !
Comment and subscribe to help us grow !
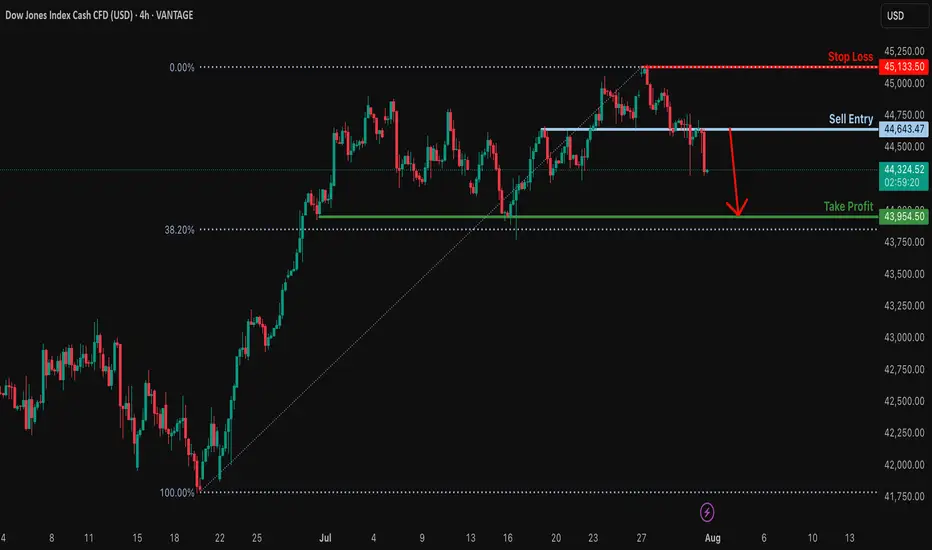
Potential bearish drop?Dow Jones (DJ30) has reacted off the resistance level which is an overlap resitance and could drop from this levle ot our takeprofit.
Entry: 44,643.47
Why we like it:
There is an overlap resistance levle.
Stop loss: 45,133.50
Why we like it:
There is a swing high resistance.
Take profit: 43,954.50
Why we like it:
There is a multi swing low support.
Enjoying your TradingView experience? Review us!
Please be advised that the information presented on TradingView is provided to Vantage (‘Vantage Global Limited’, ‘we’) by a third-party provider (‘Everest Fortune Group’). Please be reminded that you are solely responsible for the trading decisions on your account. There is a very high degree of risk involved in trading. Any information and/or content is intended entirely for research, educational and informational purposes only and does not constitute investment or consultation advice or investment strategy. The information is not tailored to the investment needs of any specific person and therefore does not involve a consideration of any of the investment objectives, financial situation or needs of any viewer that may receive it. Kindly also note that past performance is not a reliable indicator of future results. Actual results may differ materially from those anticipated in forward-looking or past performance statements. We assume no liability as to the accuracy or completeness of any of the information and/or content provided herein and the Company cannot be held responsible for any omission, mistake nor for any loss or damage including without limitation to any loss of profit which may arise from reliance on any information supplied by Everest Fortune Group.
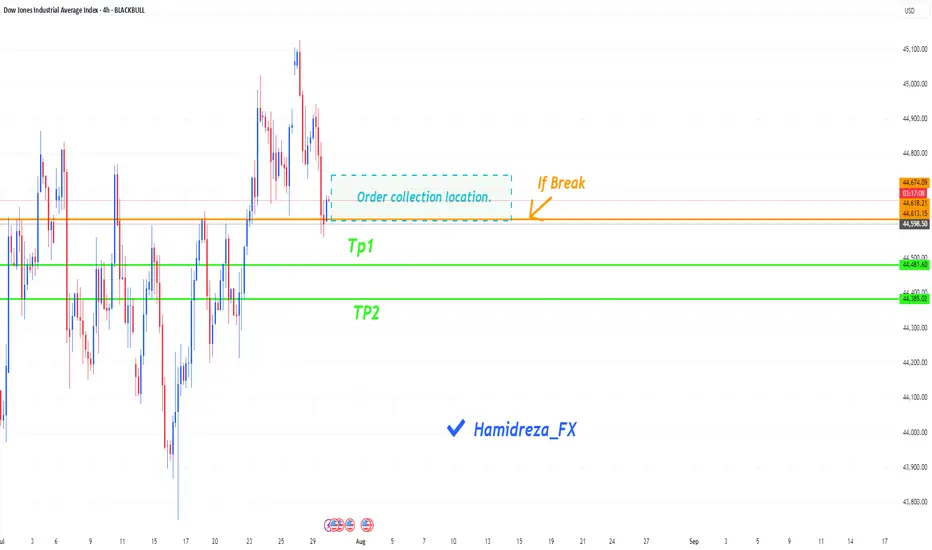
Will the Dow Jones continue its correction?
Hi everyone
The indicator may continue to correct itself by breaking the condition written in the figure (with an orange line). There is a blue box on the figure that shows the place where orders are collected. It is possible that buy orders will be placed in this area and then the downward trend will begin.
What percentage of the probability do you think there is of reaching the specified targets?
Be sure to follow me because you can make good profits from the market.
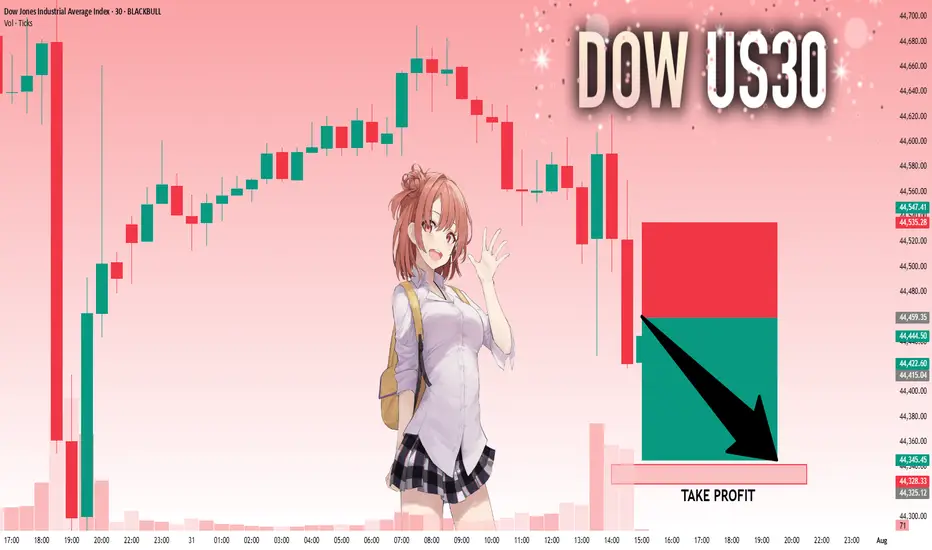
US30: Absolute Price Collapse Ahead! Short!
My dear friends,
Today we will analyse US30 together☺️
The in-trend continuation seems likely as the current long-term trend appears to be strong, and price is holding below a key level of 44,459.35 So a bearish continuation seems plausible, targeting the next low. We should enter on confirmation, and place a stop-loss beyond the recent swing level.
❤️Sending you lots of Love and Hugs❤️