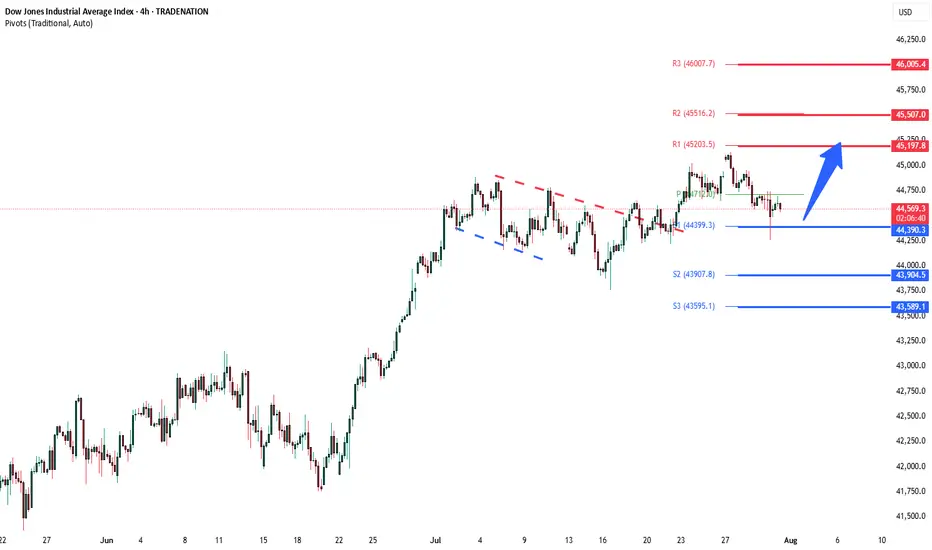
DowJones breakout retest supported at 44390Key Support and Resistance Levels
Resistance Level 1: 45197
Resistance Level 2: 45500
Resistance Level 3: 46000
Support Level 1: 44390
Support Level 2: 43900
Support Level 3: 43590
This communication is for informational purposes only and should not be viewed as any form of recommendation as to a particular course of action or as investment advice. It is not intended as an offer or solicitation for the purchase or sale of any financial instrument or as an official confirmation of any transaction. Opinions, estimates and assumptions expressed herein are made as of the date of this communication and are subject to change without notice. This communication has been prepared based upon information, including market prices, data and other information, believed to be reliable; however, Trade Nation does not warrant its completeness or accuracy. All market prices and market data contained in or attached to this communication are indicative and subject to change without notice.
DOWUSD trade ideas
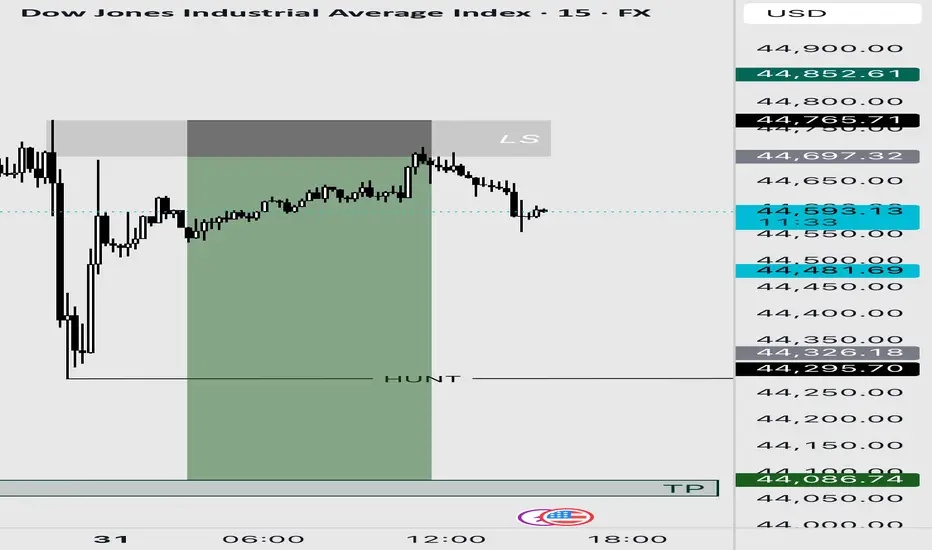
Us30usd sellI entered a sell trade from the LS zone. The PEZ zones were all used up. I set the last one as my TP.
US30 Technical Breakdown – 07/31/2025📍 US30 Technical Breakdown – 07/31/2025
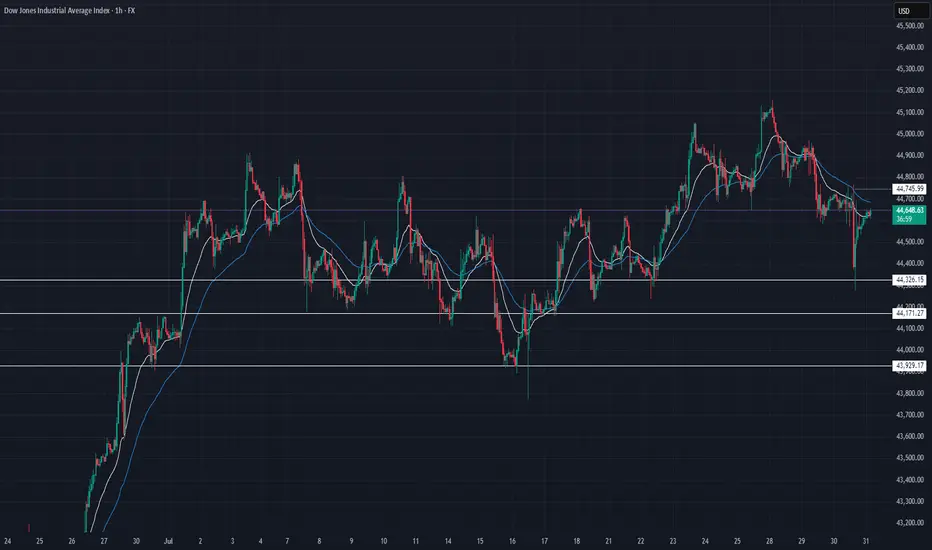
US30 is currently trading at 44,624, showing signs of weakness after failing to hold gains near 45,100. The index has broken down from its recent consolidation range and is hovering just above mid-range support at 44,600.
Momentum has shifted slightly bearish, and price action remains choppy within the broader 44,700–45,000 range. Bulls must defend the 44,600 level to avoid a deeper move into the demand zone below.
📊 Current Market Behavior:
🔄 Choppy consolidation near the lower end of the range
📉 Repeated rejection at 45,100
🧱 Support currently holding around 44,600
⚠️ Downside pressure increasing – caution warranted
📌 Key Levels:
🔹 Resistance Zones:
44,745–44,800 → Immediate intraday ceiling
45,000 → Psychological resistance
45,100 → Previous swing high / heavy rejection area
🔹 Support Zones:
44,600 → Immediate support (currently testing)
44,326 → Strong historical support
44,171–43,929 → Broader demand zone
🧠 Bias:
🔽 Slightly Bearish Intraday
Dow Jones Industrial Average (DJI) – 1H Chart Analysis 1. Structure: Broad Range Consolidation
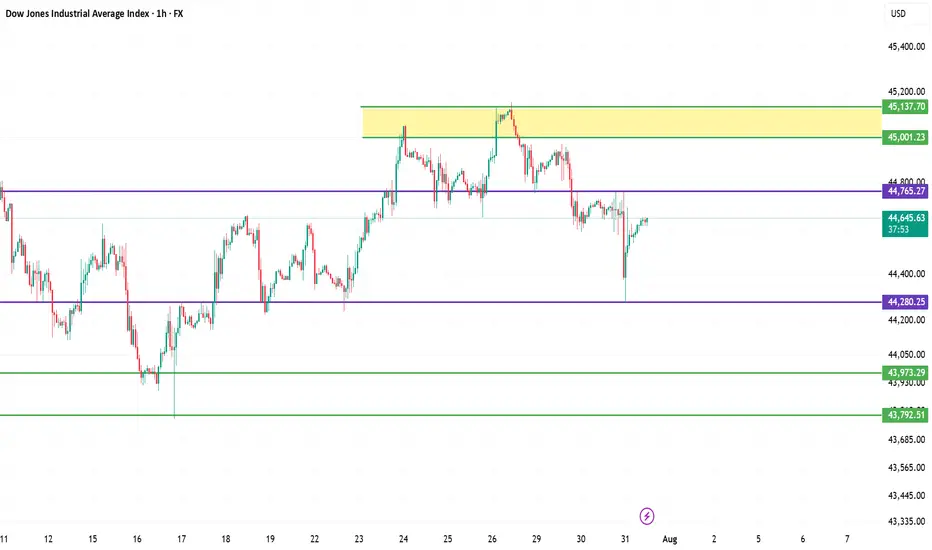
Price remains within a wide horizontal range between 45,137 resistance and 43,792 support. This shows indecision and distribution at highs.
2. Key Rejection Zone
The yellow zone around 45,001–45,137 acted as a strong supply area. Multiple rejections indicate heavy selling interest here.
3. Mid-Zone Compression
Current price is hovering just below 44,765 resistance — acting as a decision point. Break above it may retest the supply zone; rejection could send price lower.
4. Demand Holding at 44,280
The strong bounce from 44,280.25 shows buyers defending this demand zone. It's the key support to watch for bulls.
5. Next Play
Bullish: Break and hold above 44,765 targets 45,001–45,137.
Bearish: Failure leads to 44,280, then 43,973 → 43,792.
Neutral bias unless a clean breakout confirms direction.
DOW/US30 - PATIENCE IS THE KEYTeam, i expect the DOW/ NAS will be selling off due RATE unchange
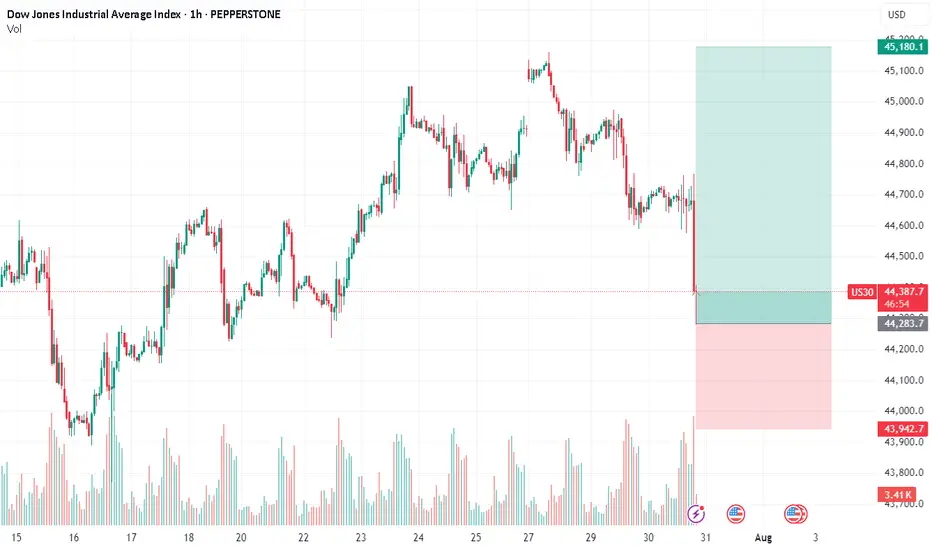
i am going LONG now at 44335-44300 ranges
STOP LOSS at 44195
Target 1 at 44500-44550
Target 2 at 44600-44630
LETS GO
By the way, if you trade AUS200 today, both target hit on SHORT.
US30 Sell analysis/ideathis trade is based on the 4-hour timeframe and executed using reversal trading and trend formation. Complete explanation in the video!

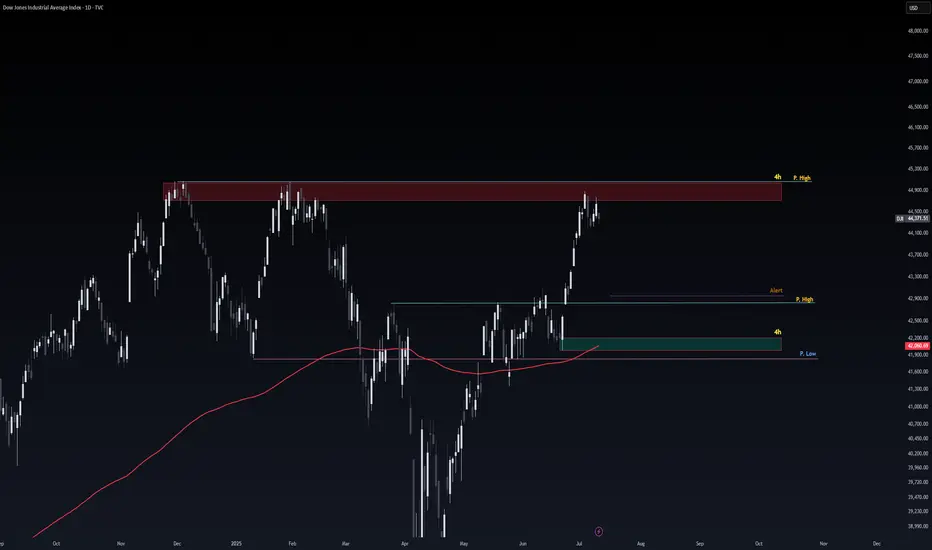
Safe Entry DJIObvious Movement I Guess.
P.High(Previous High) Act As good Support for price to Respect.
Note: 1- Potentional of Strong Buying Zone:
We have two scenarios must happen at The Mentioned Zone:
Scenarios One: strong buying volume with reversal Candle.
Scenarios Two: Fake Break-Out of The Buying Zone.
Both indicate buyers stepping in strongly. NEVER Join in unless one showed up.
2- How to Buy Stock (safe way):
On 1H TF when Marubozu/Doji Candle show up which indicate strong buyers stepping-in.
Buy on 0.5 Fibo Level of the Marubozu/Doji Candle, because price will always and always re-test the
US30 DOWN FOR WHILEWe have seen dramatic gain in most of the indices and US30 being one of them, and i have been tracking it for so long and i have come with this idea from my approach. As you can see on my screen i have labeled those levels and reset to mark up the the half cycle with the aid of the TDI divergence, the last push there is the level 3 moving exactly with the divergence which indicates that the bulls are getting weak and bears are about take over and push price to the downside, so am looking to join the bears 🐻to price down for a while.

Dow Jones Index Analysis (US30 / Dow Jones):🔹 The index broke below a key support zone yesterday and is now consolidating between 44,720 USD and 44,620 USD.
1️⃣ If bullish momentum leads to a break and close above 44,740 USD, the price may retest the 44,970 USD zone.
2️⃣ However, if the price breaks below 44,600 USD and holds, a decline toward 44,350 USD is likely.
⚠️ Disclaimer:
This analysis is not financial advice. It is recommended to monitor the markets and carefully analyze the data before making any investment decisions.
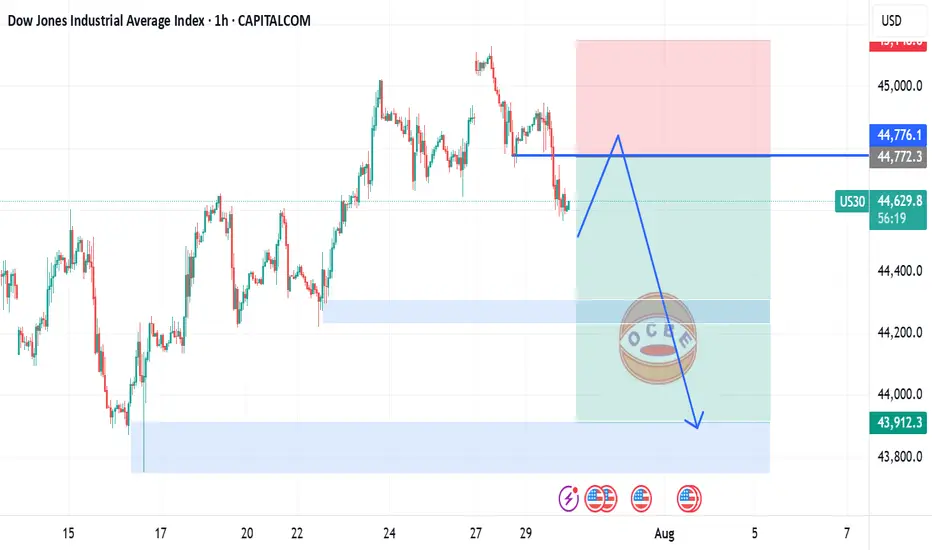
Dow Jones Futures Edge Up Ahead of Fed, GDP & Tech EarningsDow Jones Futures Edge Up Ahead of Fed, GDP & Tech Earnings – Bearish Bias Below 44,770
Dow Jones futures rose slightly overnight as investors brace for a packed session. Key events include the release of Q2 GDP data before the market opens, the Federal Reserve’s policy decision in the afternoon, and earnings reports from major tech firms later in the day.
Yesterday, the Dow Jones managed to break below the ascending channel, which technically indicates a new bearish signal for today.
The price stabilizing below 44,770, along with an attempt to break the support line at 44,610, suggests a potential downward move.
Initially today, before the opening of the New York session, the price may attempt to rise toward 44,770 as a retest. However, we anticipate a decline afterward, aiming to break and pass the support level at 44,610, and then extend the drop toward 44,360.
The bullish scenario becomes valid only if the price stabilizes above 44,770. If it can trade above this level for a longer duration, it may rise further toward 44,910.
Key Levels
• Support: 44,610 - 44,360.
• Resistance: 44,770 - 44,910 - 45,100.
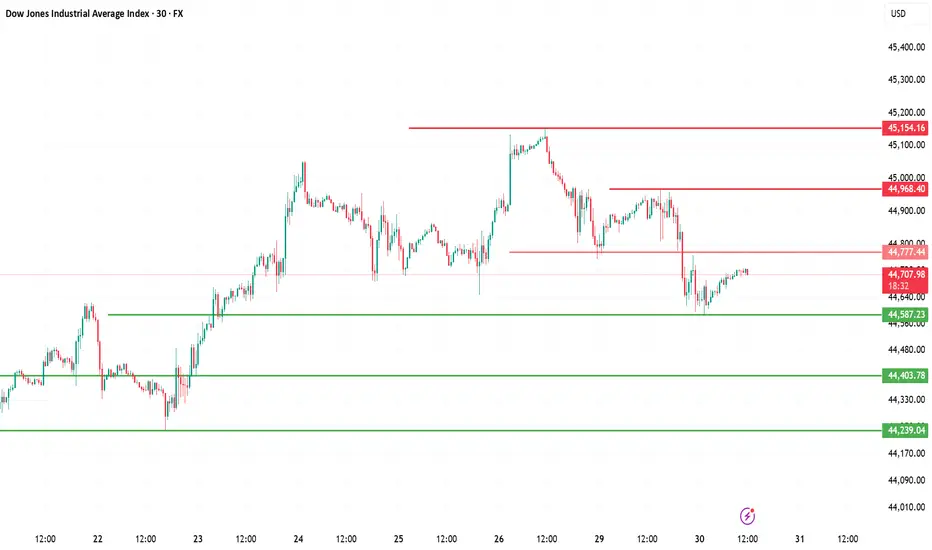
Dow Jones Index (DJI) – July 30, 2025 | 30-Min Chart Analysis
1. Current Market Structure
DJI is consolidating just below the intraday resistance at 44,777. Price is attempting to recover after a sharp drop from the 45,154 high.
2. Supply Zone Rejection
Price faced strong rejection near 45,154 and again at 44,968 — confirming this area as an active seller zone.
3. Support Zone Defense
Buyers stepped in at 44,587 and 44,403, creating a short-term demand base. These levels have provided stability for now.
4. Trend Outlook
The lower high formation and recent sharp sell-off hint at bearish pressure. Price is currently in a retracement — unless 44,968 breaks cleanly, sellers remain in control.
5. Key Levels to Watch
Resistance 44,777 → 44,968 → 45,154
Support 44,587 → 44,403 → 44,239
🔁 Bias: Short-term bearish unless price breaks above 44,968 and holds.
US30 short movePrice had broken our support level and hence i expect a rest to the new formed resistance before resuming its bearish move.
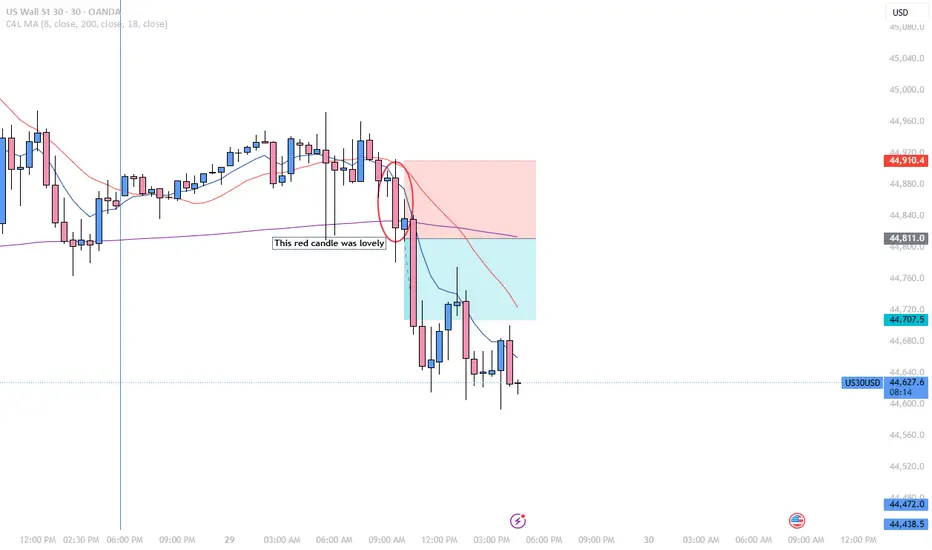
US30 07/29 Sell Trade I don't like sells because I consider myself an optimistic person but the red candle that I mark in red gave me all I needed to know to enter sell and get my target profit filled. So. I know there is variation in this trade but we were on a downtrend and going against the trend is only acceptable when the trend is over( meaning a reversal) . So when I see a big candle break the support of my variation I entered
Dow Jones Wave Analysis – 29 July 2025
- Dow Jones reversed from the long-term resistance level 45000.00
- Likely fall to support level 44000.00
Dow Jones index recently reversed down from the resistance zone between the long-term resistance level 45000.00 (which has been reversing the price from the end of 2024) and the upper daily Bollinger Band.
The downward reversal from this resistance zone created the daily Japanese candlesticks reversal pattern, Bearish Engulfing.
Given the strength of the resistance level 45000.00 and the bearish divergence on the daily Stochastic, Dow Jones index can be expected to fall to the next support level 44000.00 (which reversed the price earlier in July).

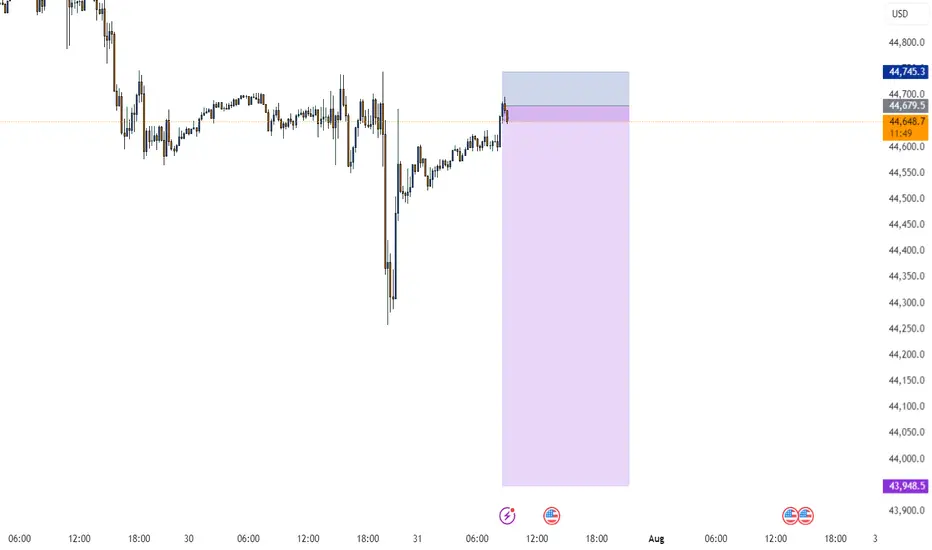
US30 - BUYStrong selling pressure today as price has grabbed a ton of buy side liquidity. As we approach FOMC news tomorrow, I am expecting buyers to take back control and price reach Sundays opening price.

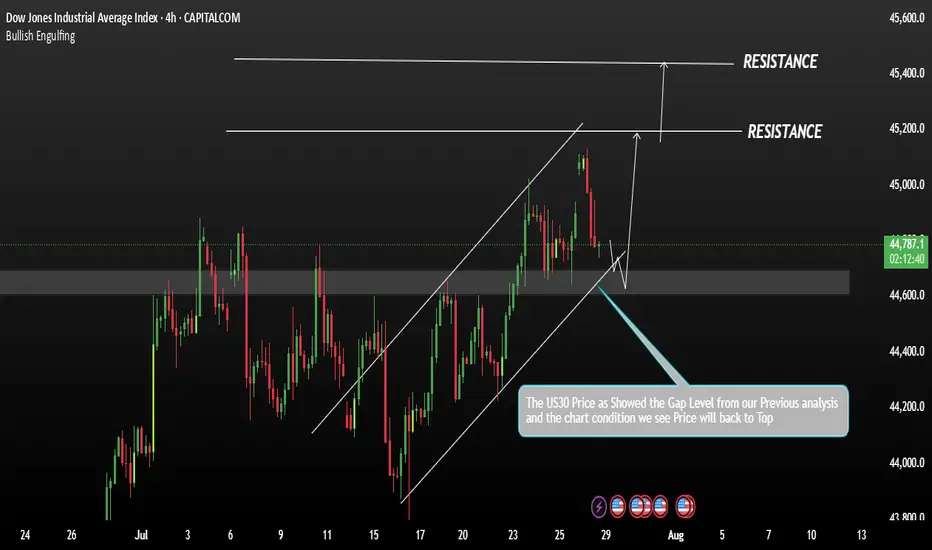
US30 Correction with in a Downtrend ChannelUS30 is currently in a consolidation phase within a broader bullish trend. From our previous analysis, the index has shown strong upward momentum. However, to confirm a potential bearish shift, the price would need to break back below key support levels, potentially leading to a deeper correction.
If the price stabilizes above 44,000 on the 4H timeframe, this would strengthen the bullish momentum. A sustained move above this level could open the path towards the next targets at 45,200 and 45,400.
You May find more details in the chart.
Ps: Support with like and comments for better analysis
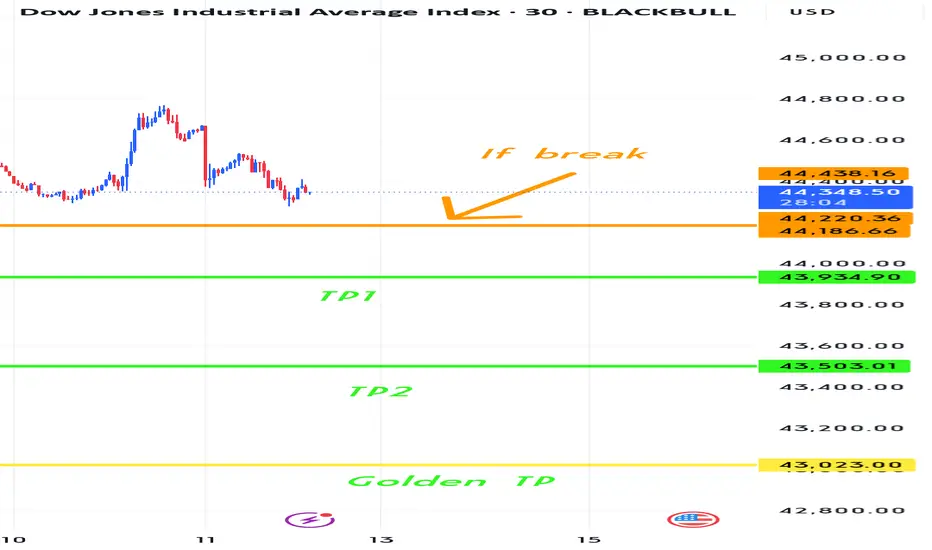
US30The latest COT report shows increased Non-Commercial short positions, indicating bearish sentiment among speculators. Commercial traders are also holding or adding to their short positions, reinforcing the negative outlook. Rising open interest further confirms market expectations of a decline in the US30.

Do you agree with a big profit in US30?
Hello friend
Do you think the orange line will break?
What if it breaks?
Just wait and collect the money.
If you liked my analysis, please support me by liking, commenting and subscribing. Thanks friend
DowJones bullish breakout support at 44390Key Support and Resistance Levels
Resistance Level 1: 45197
Resistance Level 2: 45507
Resistance Level 3: 46000
Support Level 1: 44390
Support Level 2: 43900
Support Level 3: 43590
This communication is for informational purposes only and should not be viewed as any form of recommendation as to a particular course of action or as investment advice. It is not intended as an offer or solicitation for the purchase or sale of any financial instrument or as an official confirmation of any transaction. Opinions, estimates and assumptions expressed herein are made as of the date of this communication and are subject to change without notice. This communication has been prepared based upon information, including market prices, data and other information, believed to be reliable; however, Trade Nation does not warrant its completeness or accuracy. All market prices and market data contained in or attached to this communication are indicative and subject to change without notice.

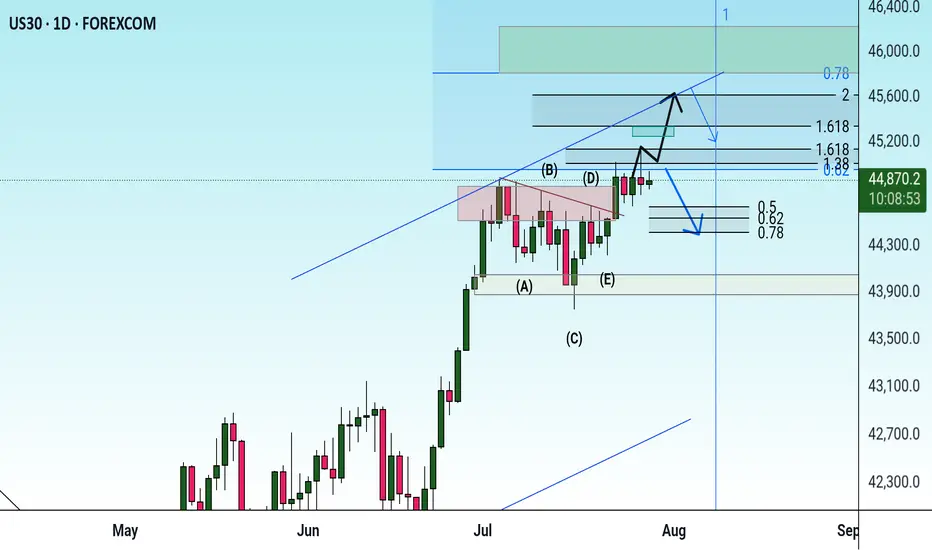
Possibility of uptrend The uptrend is expected to move in the specified direction and advance to the specified targets. If the indicator does not consolidate above the current resistance level, there is a possibility of a double-digit combination pattern. Then a correction is likely.
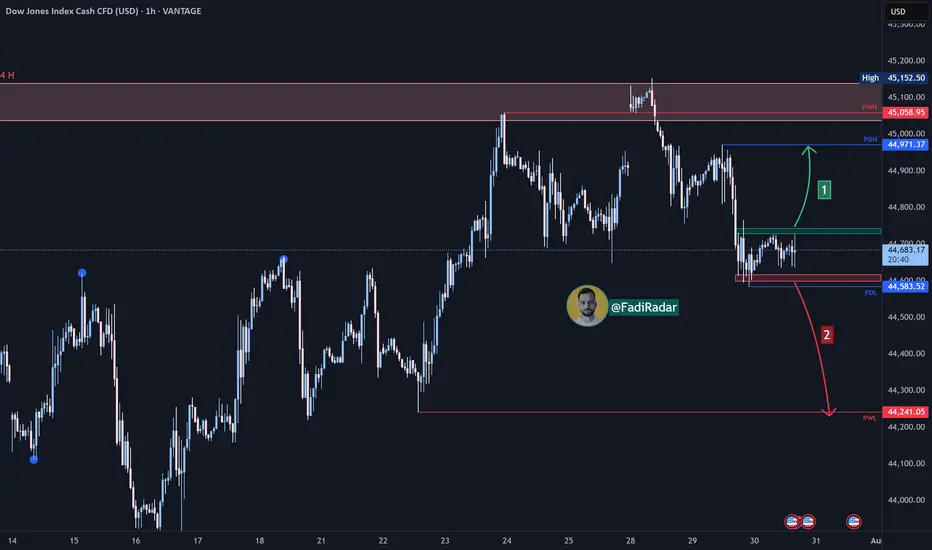
Dow Jones Index Analysis (US30 / Dow Jones):🔹 The index completed the expected correction and successfully retested the PDH level at 44,750 USD.
1️⃣ If bullish momentum leads to a break and close above 44,970 USD, the price is likely to form a new high or retest the previous peak.
2️⃣ However, a break and close below the 44,760 USD support could trigger a decline toward 44,660 USD.
🔻 A confirmed break below that level may resume the bearish trend and open the way toward 44,250 USD.
⚠️ Disclaimer:
This analysis is not financial advice. It is recommended to monitor the markets and carefully analyze the data before making any investment decisions.

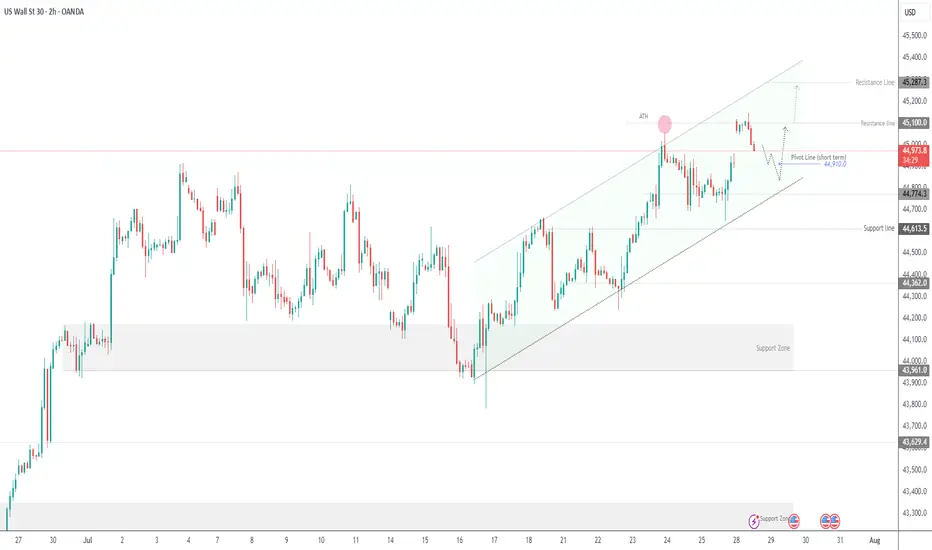
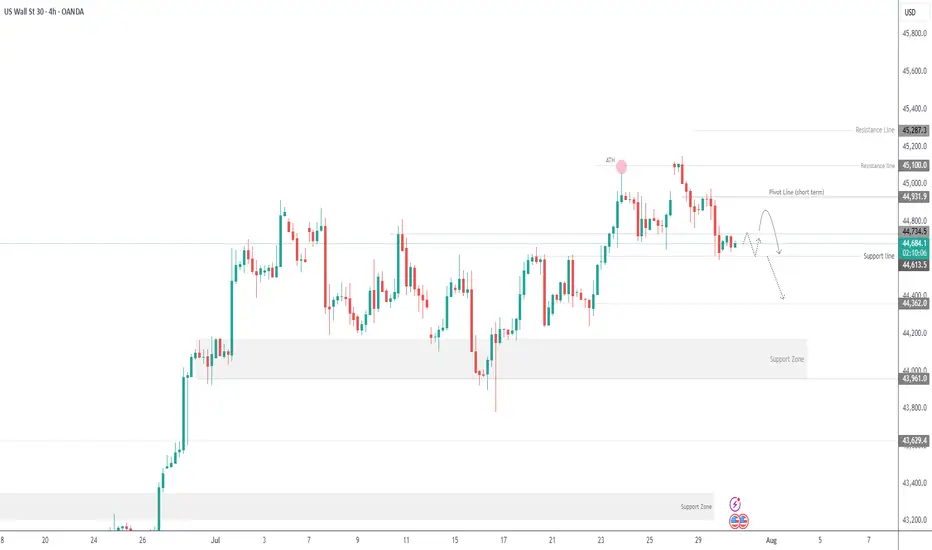
OVERVIEW The price is currently undergoing a bearish correctionUS30 OVERVIEW
The price is currently undergoing a bearish correction, targeting 44910. To confirm a bearish trend continuation, the price must break below 44770, which would likely lead to a move toward 44610.
However, if the price stabilizes above 44910 on the 4H timeframe, a bullish reversal may begin. A confirmed break above 45100 would strengthen bullish momentum and open the path toward 45290.
Key Levels:
• Pivot Line: 45045
• Support: 44910 – 44770 – 44610
• Resistance: 45100 – 45290