US30 Technical Breakdown – 07/29/2025📍 US30 Technical Breakdown – 07/29/2025
US30 is consolidating after last week's bullish breakout. It failed to hold above 45,100, rolled over, and is now ranging between 44,725 support and 45,000 resistance.
Currently sitting at 44,900, price is coiling just below key resistance. The market is waiting for a catalyst—either to reclaim 45,000 or dump back into the 44,700s.
📊 Current Market Behavior:
🔄 Sideways consolidation
📉 Lower highs forming below 45,100
🧱 Strong support building at 44,725
⚠️ No strong momentum yet – patience is key
📌 Key Levels:
🔹 Resistance Zones:
45,000 → Intraday ceiling
45,100–45,160 → Recent high/rejection area
45,250 → Breakout expansion level
🔹 Support Zones:
44,725–44,700 → Crucial support for bulls
44,600 → Mid-range support
44,171 → Demand floor
🧠 Bias:
🔄 Neutral to Slightly Bearish Intraday
Price stuck between 45,000 resistance and 44,700 support
Bears in control unless we break & hold above 45,000
Look for signs of momentum at open
DOWUSD trade ideas

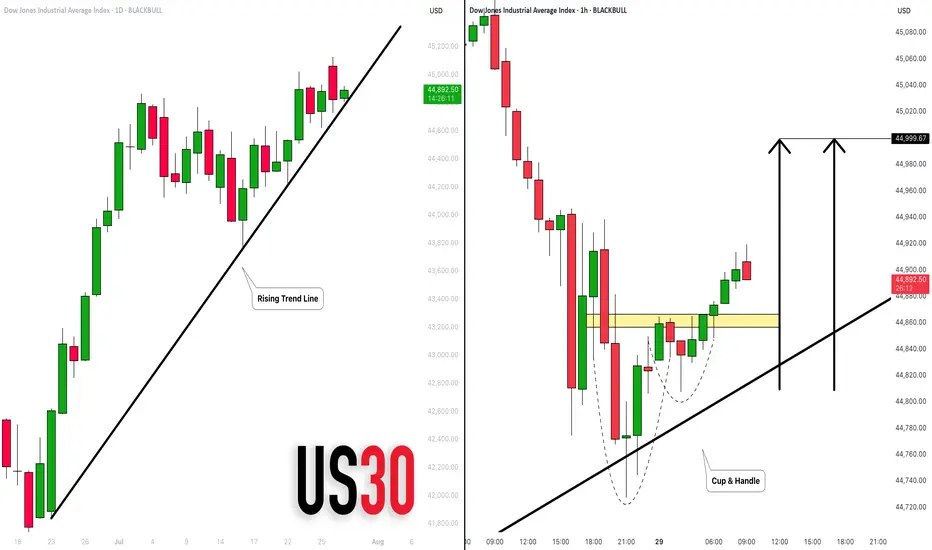
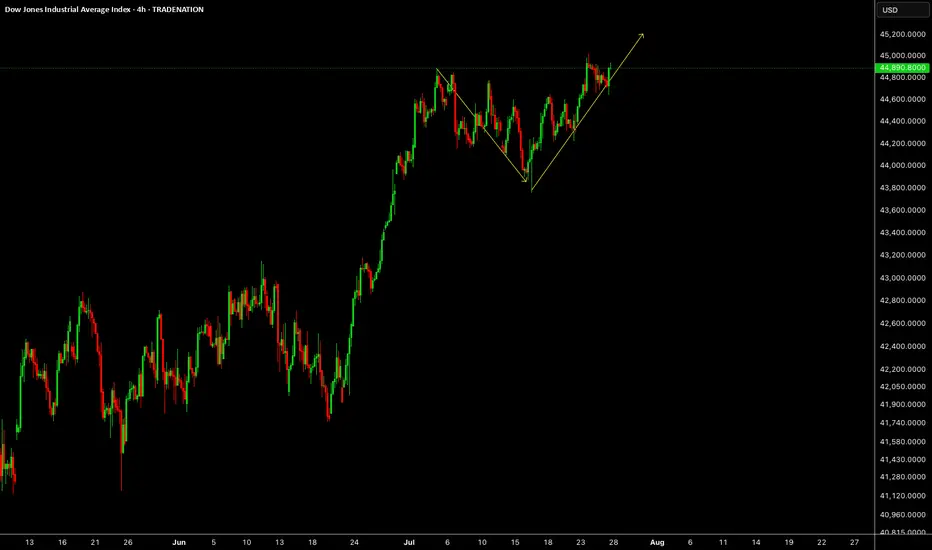
DOW JONES INDEX (US30): Bullish Move From Trend Line
There is a high probability that US30 will continue rising today,
following a test of a solid rising trend line on a daily.
As a confirmation, I see a cup & handle on that after its test
on an hourly time frame.
Goal - 45000
❤️Please, support my work with like, thank you!❤️
US30 DOW JONESwe are stopping losses tiks above previous high, Shorting chasing the last low 1:1, 1:2
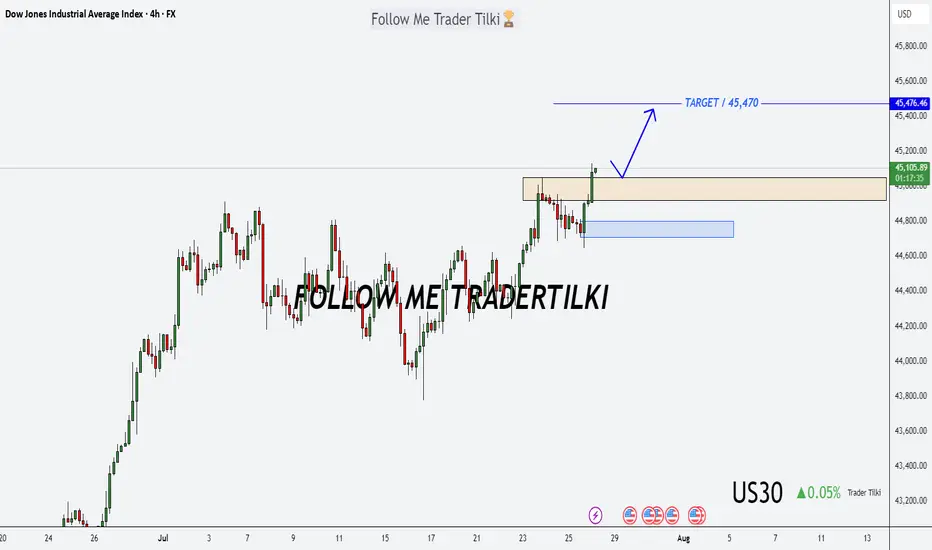
US30 Forecast: Target Locked, Buy Zones in Sight!Good morning friends ☀️
I've prepared a fresh analysis for US30 (Dow Jones).
My current target is 45,470. Even if the price dips to 45,050 or 44,800, I fully expect it to reach that 45,470 mark.
These levels represent strong buying zones and powerful retest regions—don’t forget that.
Every like from you is my biggest source of motivation to keep posting these insights. 💬📊
Big thanks to everyone supporting with a thumbs-up.
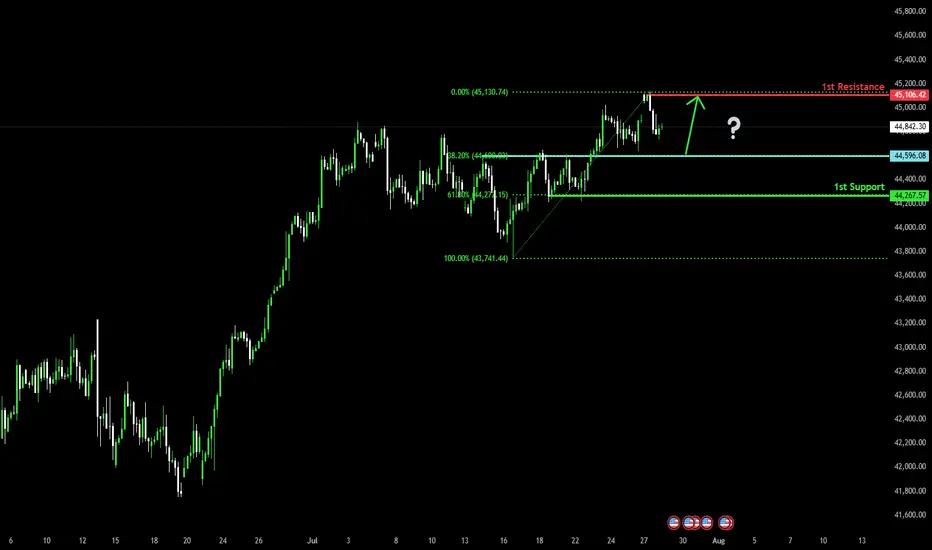
Bullish bounce off overlap support?Dow Jones (US30) is falling towards the pivot and could bounce to the 1st resistance which acts as a swing high resistance.
Pivot: 44,596.08
1st Support: 44,267.57
1st Resistance: 45,106.42
Risk Warning:
Trading Forex and CFDs carries a high level of risk to your capital and you should only trade with money you can afford to lose. Trading Forex and CFDs may not be suitable for all investors, so please ensure that you fully understand the risks involved and seek independent advice if necessary.
Disclaimer:
The above opinions given constitute general market commentary, and do not constitute the opinion or advice of IC Markets or any form of personal or investment advice.
Any opinions, news, research, analyses, prices, other information, or links to third-party sites contained on this website are provided on an "as-is" basis, are intended only to be informative, is not an advice nor a recommendation, nor research, or a record of our trading prices, or an offer of, or solicitation for a transaction in any financial instrument and thus should not be treated as such. The information provided does not involve any specific investment objectives, financial situation and needs of any specific person who may receive it. Please be aware, that past performance is not a reliable indicator of future performance and/or results. Past Performance or Forward-looking scenarios based upon the reasonable beliefs of the third-party provider are not a guarantee of future performance. Actual results may differ materially from those anticipated in forward-looking or past performance statements. IC Markets makes no representation or warranty and assumes no liability as to the accuracy or completeness of the information provided, nor any loss arising from any investment based on a recommendation, forecast or any information supplied by any third-party.
US30: : Local Bullish Bias! Long!
My dear friends,
Today we will analyse US30 together☺️
The recent price action suggests a shift in mid-term momentum. A break above the current local range around 44,802.50 will confirm the new direction upwards with the target being the next key level of 44,914.32 and a reconvened placement of a stop-loss beyond the range.
❤️Sending you lots of Love and Hugs❤️
US30 5M DEMAND SETUPPrice was in a clear bullish trend, consistently printing higher highs. Two demand zones were formed, followed by a clean break of structure. I anticipated a reaction at the most recent demand zone and entered on a strong rejection candle, leaving the wick in zone. Execution was on the break of candle with initial targets set at recent highs. However, unexpected momentum drove price beyond target, allowing me to secure a solid 1:2 R:R. Trade managed with discipline and am satisfied with the outcome.

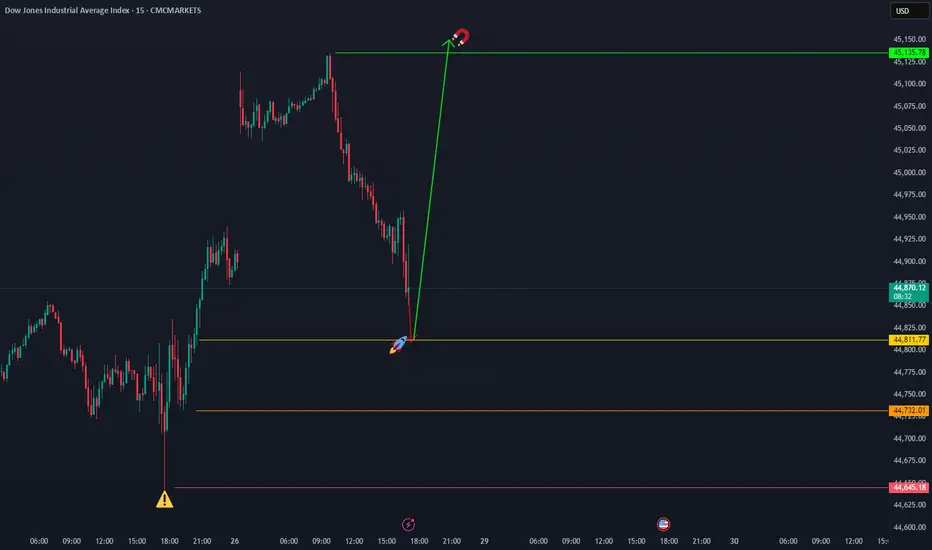
"We are going higher than 45,135.78The Dow Jones has the potential to start an upward move from the 44,811.77 and 44,732 levels, aiming for 45,135.78." CMCMARKETS:US30
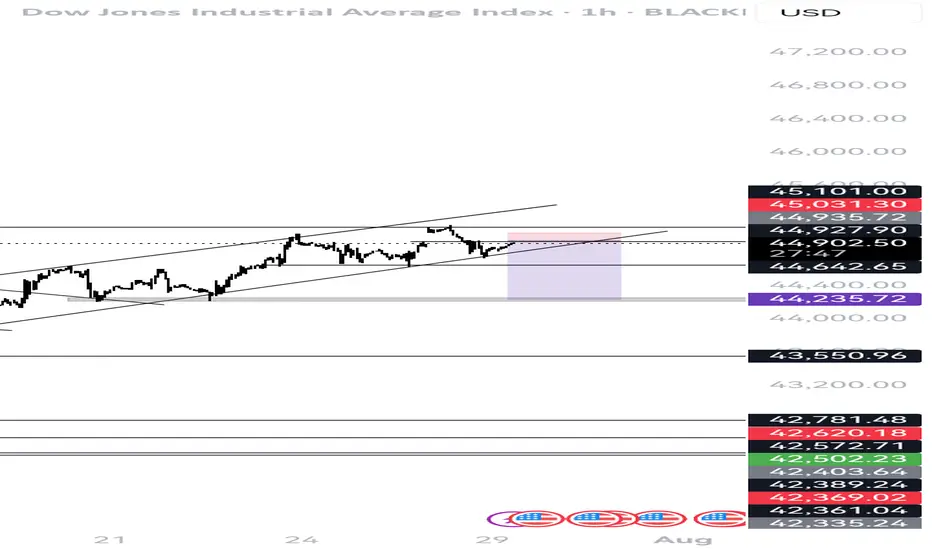
Getting ready for new highs Price tested the 45000 resistance which is the final resistance before new highs, it is now going down to test the trend line support of the uptrend channel

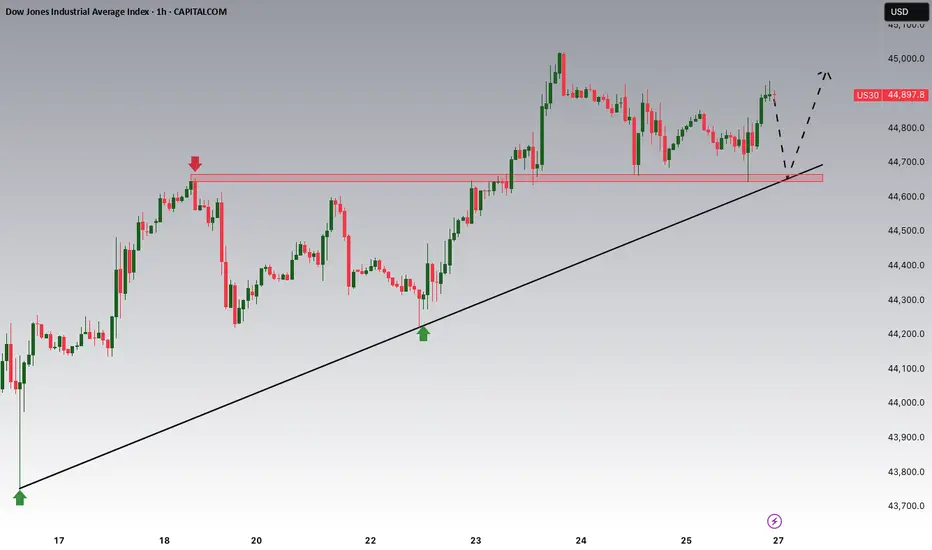
US30 Weekly Forecast – Bullish Bounce or Breakdown?Hope everyone had a great weekend!
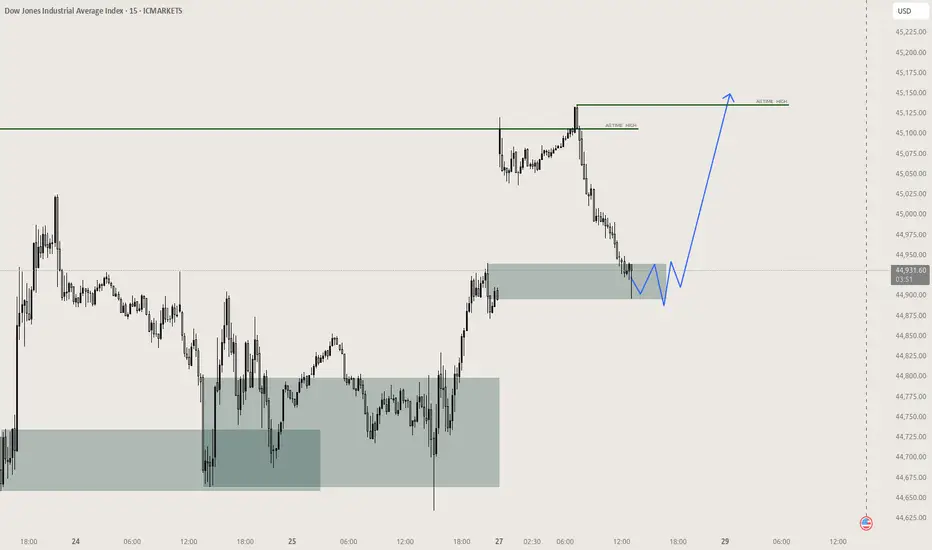
This chart outlines a critical US30 intraday structure with price currently pulling back into a key confluence zone composed of:
A rising trendline from July 23rd
Two stacked demand zones, the upper around 44,850 and lower near 44,700
Bullish Scenario (Preferred Bias):
If price respects the trendline and upper key zone, we may see a bullish continuation targeting the 45,150–45,250 range.
The clean bounce zone, marked by the green arrow, suggests smart money might defend this level.
Watch for bullish engulfing or low-volume traps near 44,850–44,880 to confirm entry.
Bearish Scenario (Alternate Play):
If price fails to hold the trendline, and breaks below the 44,850 key zone with momentum, expect a drop into the lower zone (44,650–44,700).
A breakdown below this lower demand could shift the bias entirely, opening the door for a deeper correction back into the mid-44,000s.
Weekly Playbook:
Early week: Monitor the reaction at the upper key zone for sniper long opportunities with tight stops.
Mid to late week: If structure fails, flip bias and look for supply rejections on retests for shorts.
Risk: Account for FOMC/major U.S. news events that may introduce volatility traps around these zones.
Verdict: Stay patient. Let price dictate bias at the trendline. If it holds, this could be a textbook bounce continuation setup.

US30 Market Breakdown – 07/28/2025📍 US30 Market Breakdown – 07/28/2025
US30 just broke above the prior key zone at 44,950–45,000 and tapped 45,160+ before showing some rejection and pulling back to 45,000.
The move confirms bullish continuation—but the pullback is critical. If bulls defend 44,950–44,900, this could be a textbook higher low and launchpad for more upside.
📊 Current Structure:
✅ Higher highs & higher lows
📈 Clean break and retest of the 45K zone
⏳ Pullback in progress—watching demand areas
🧱 Resistance Zones:
45,160 → Recent local high
45,250 → Psychological resistance
45,400 → Next extension zone
📉 Support Zones:
44,950 → Breakout level (must hold)
44,800 → EMA confluence
44,600–44,500 → Demand base
📉 If price fails to hold 44,950, we could see a fade back to 44,800 or even 44,600.
📈 If 45,160 breaks, expect momentum to accelerate into the 45,300–45,400 range.
🧠 Bias:
🟢 Bullish
Structure favors continuation unless 44,800 breaks
Buy dips into demand zones
Wait for NY open confirmation for intraday momentum

People pay for this!!!If you are a beginner trader struggling with entries then this video is for you.

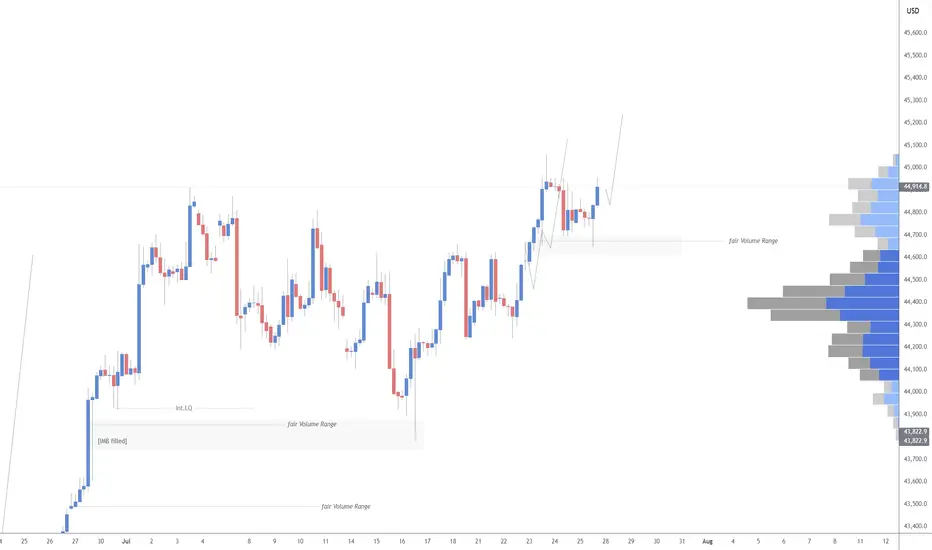
All time high reachedas presented in last post, US30 all time high reached via beautiful bull flag, its not over yet, fill the gap and go for more
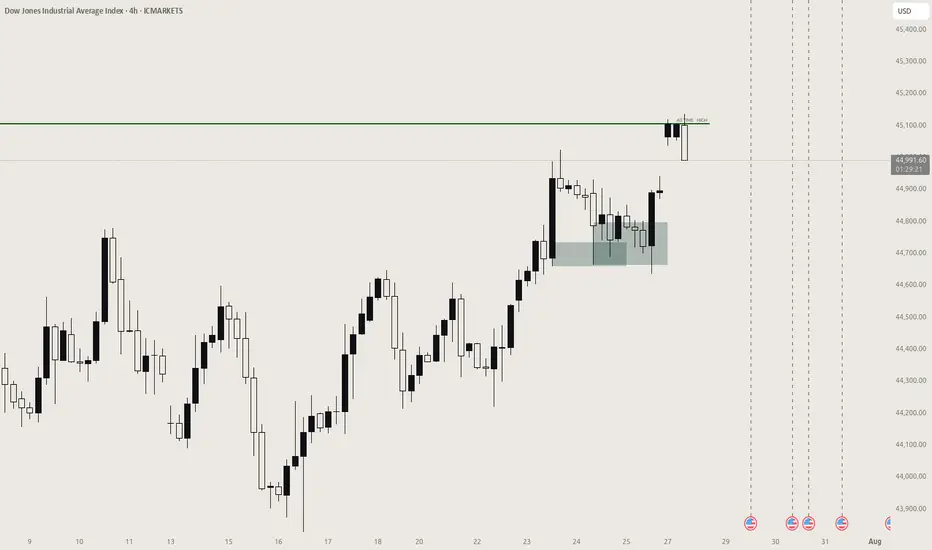
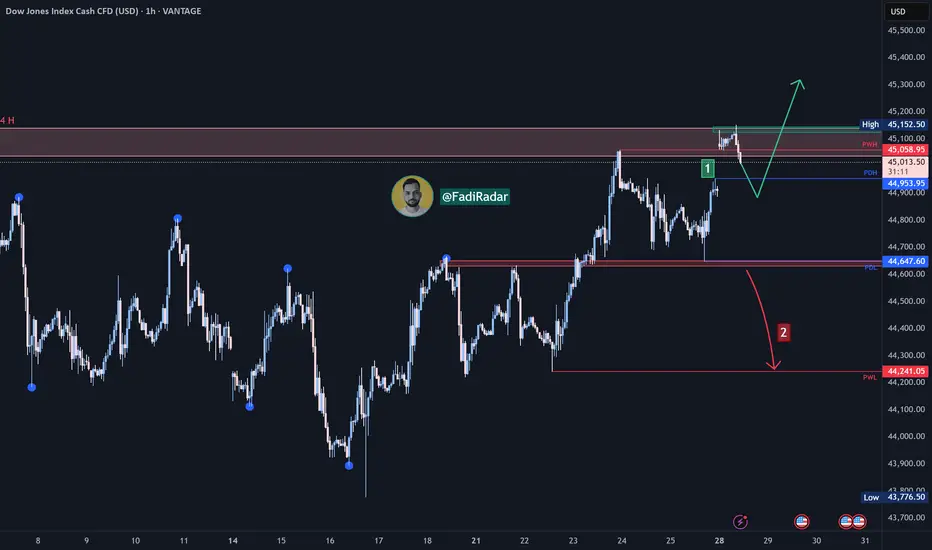
Dow Jones Index Analysis (US30 / Dow Jones):🔹 The index recently tested its all-time high at 45,152 USD, and a short-term correction may occur to retest the PDH level at 44,950 USD.
1️⃣ If strong bullish momentum leads to a break and close above 45,150 USD, the price is likely to push toward forming a new high.
2️⃣ However, a break and close below 44,620 USD could trigger a move toward 44,240 USD.
🔻 A confirmed break below this zone would resume the bearish trend and open the way toward 43,900 USD.
⚠️ Disclaimer:
This analysis is not financial advice. It is recommended to monitor the markets and carefully analyze the data before making any investment decisions.
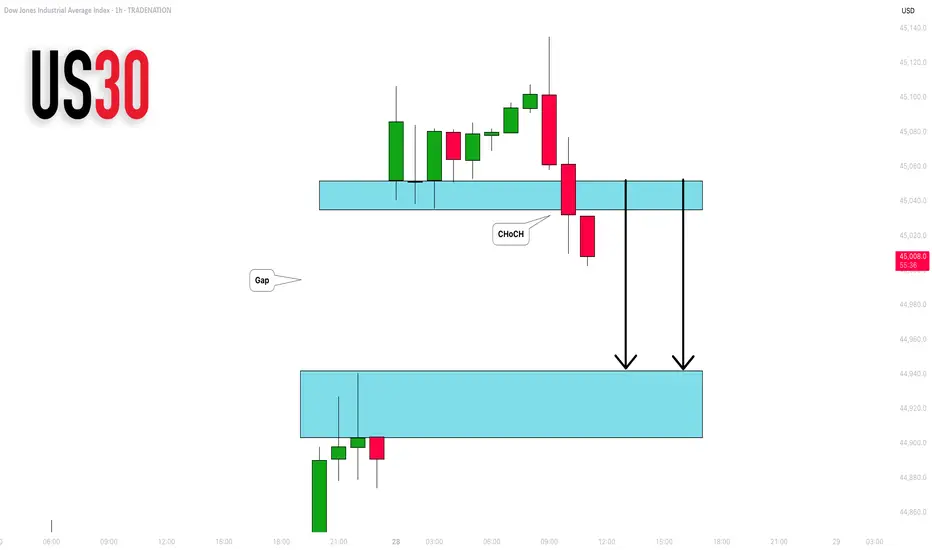
DOW JONES INDEX (US30): Another Gap For Today?
I see another gap up opening on US30 Index.
I think it will be filled today. A formation of an intraday
bearish CHoCH on an hourly time frame suggests
a highly probable bearish continuation.
Goal - 44943
❤️Please, support my work with like, thank you!❤️
I am part of Trade Nation's Influencer program and receive a monthly fee for using their TradingView charts in my analysis.

US30 H4 IdeaThe Federal Reserve meets next week and is widely expected to leave rates unchanged at 4.25%–4.50%. Still, market participants will watch for commentary on inflation and rate-cut prospects, especially after recent criticism of Fed Chair Powell by President Trump.
What Should Traders Watch?
With the major indexes on track for weekly gains, next week’s developments could test the market’s resilience.
US30US30 needs some more upside short term towards 45.2K level.
Disclosure: We are part of Trade Nation's Influencer program and receive a monthly fee for using their TradingView charts in our analysis.
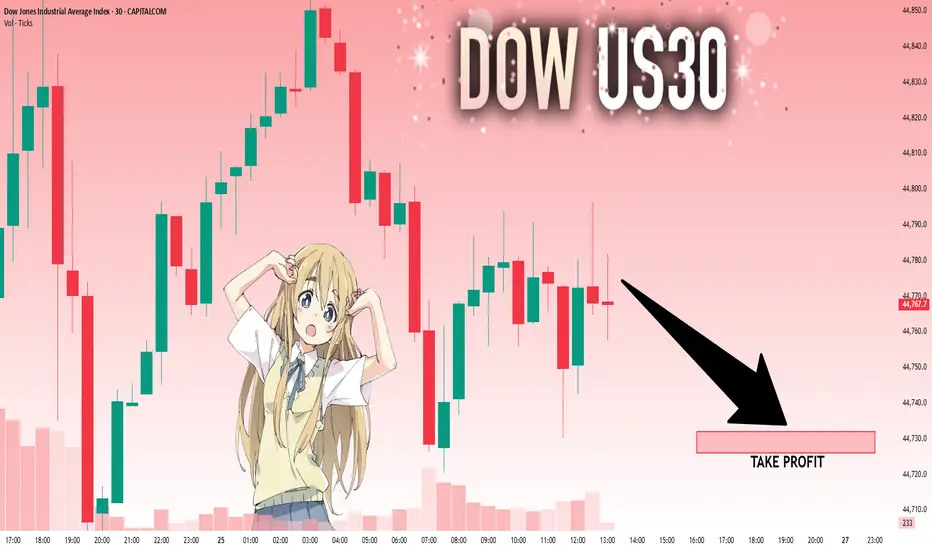
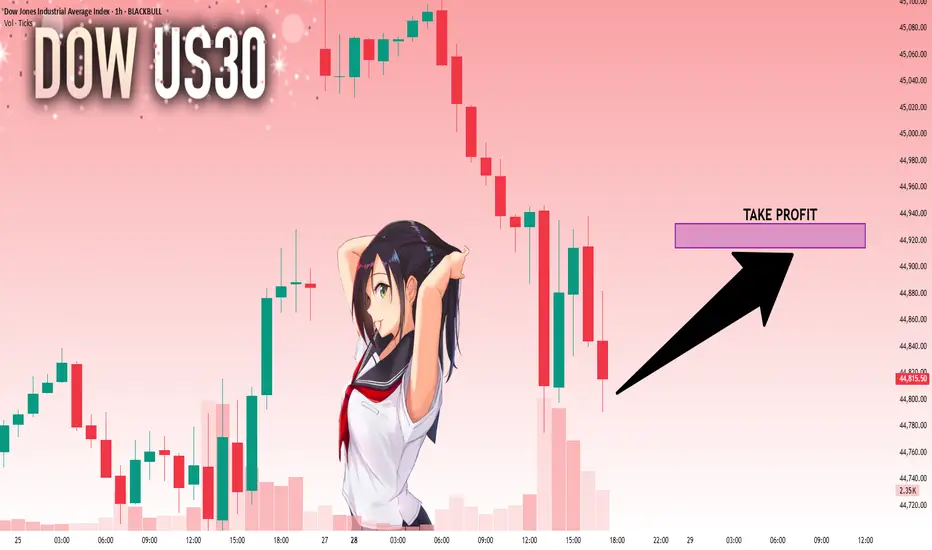
Long Position on Dow Jones Industrial Average
Initiating a long position at 44,456, supported by robust economic data and stronger-than-expected corporate earnings. These indicators point to continued resilience in the U.S. economy, potentially allowing the Federal Reserve to consider rate cuts sooner than previously anticipated — a positive catalyst for equities.
📌 Entry: 44,456
🛑 Stop Loss: 44,207
🎯 Take Profit: 44,900
Monitoring price action closely as market sentiment continues to shift in response to macroeconomic developments.

Dow Jones Potential UpsidesHey Traders, in the coming week we are monitoring US30 for a buying opportunity around 44,650 zone, Dow Jones is trading in an uptrend and currently is in a correction phase in which it is approaching the trend at 44,650 support and resistance area.
Trade safe, Joe.
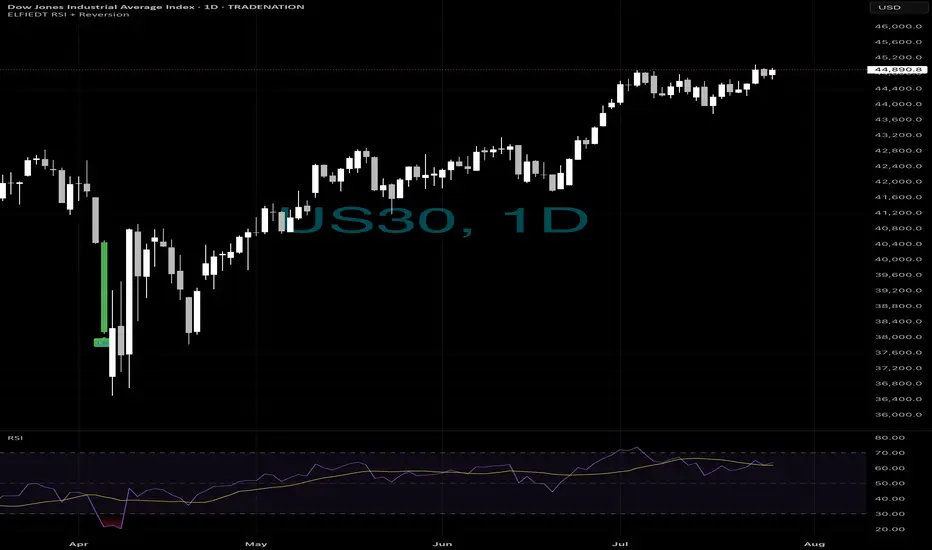
Retirement trading?🏦 LONG-TERM INVESTORS — This Was the Signal.
When fear hit the Dow in April,
most sold.
Our system?
🟢 It bought the dip — and never looked back.
That single green “UP” on the daily US30 chart caught the bottom of the move that led to 5,000+ points and counting.
⸻
This is what long-term confidence looks like:
✔️ Oversold RSI + deep structure
✔️ Clean mean reversion signal
✔️ Daily confirmation = strong foundation
✔️ No lag. No second guessing. Just one entry, held strong.
📈 From panic to new highs — all off one candle.
⸻
🧠 Here’s How Investors Can Use It:
1. Monitor daily charts on major indices
2. Wait for RSI exhaustion + reversion zone tag
3. Let ELFIEDT RSI + Reversion give the green light
4. Enter with size. Ride the trend.
This isn’t about day-trading.
This is about compound wealth with simple conviction.
⸻
💬 DM “DOW ENTRY” to get access
📲 Follow if you want less noise and more clarity
🔐 For investors who want an actual edge, not just advice
Because smart investors don’t time the market —
🚀 They follow signals with structure behind them.
US30: Local Bearish Bias! Short!
My dear friends,
Today we will analyse US30 together☺️
The in-trend continuation seems likely as the current long-term trend appears to be strong, and price is holding below a key level of 44,774.9 So a bearish continuation seems plausible, targeting the next low. We should enter on confirmation, and place a stop-loss beyond the recent swing level.
❤️Sending you lots of Love and Hugs❤️