tomorrow will be a waterfall day yall
US 30 (DOW) / US Dollar forum
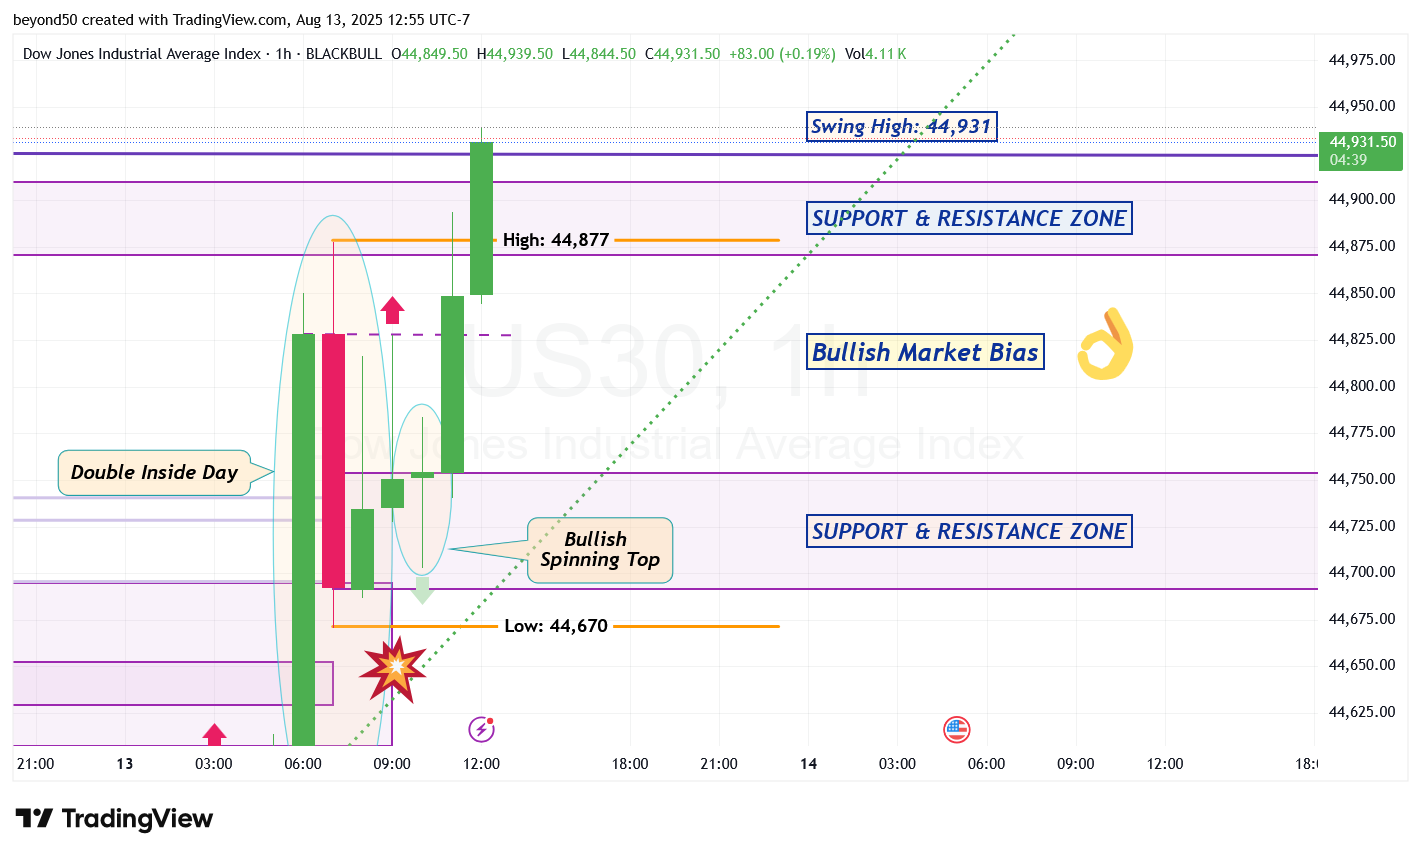
As the bulls rally from the S&R Zone to do a breakout from the high of the Inside Day at 44,877, it will either be a true breakout with more bullish candles to follow OR a fake breakout with a bearish candle to show up next to head down.
The bulls are in Overbought territory, so a retrace is coming. If this bullish candle forming rejects the Swing High of 44,921 with its upper wick, then down it goes for a bearish pullback towards the S&R Zone (that begins at 44,754).
Also, the Bullish Trendline (in green dotted line) is still close to the price action. Through consolidation and a move to the right of the trendline, the bears can take the market down.
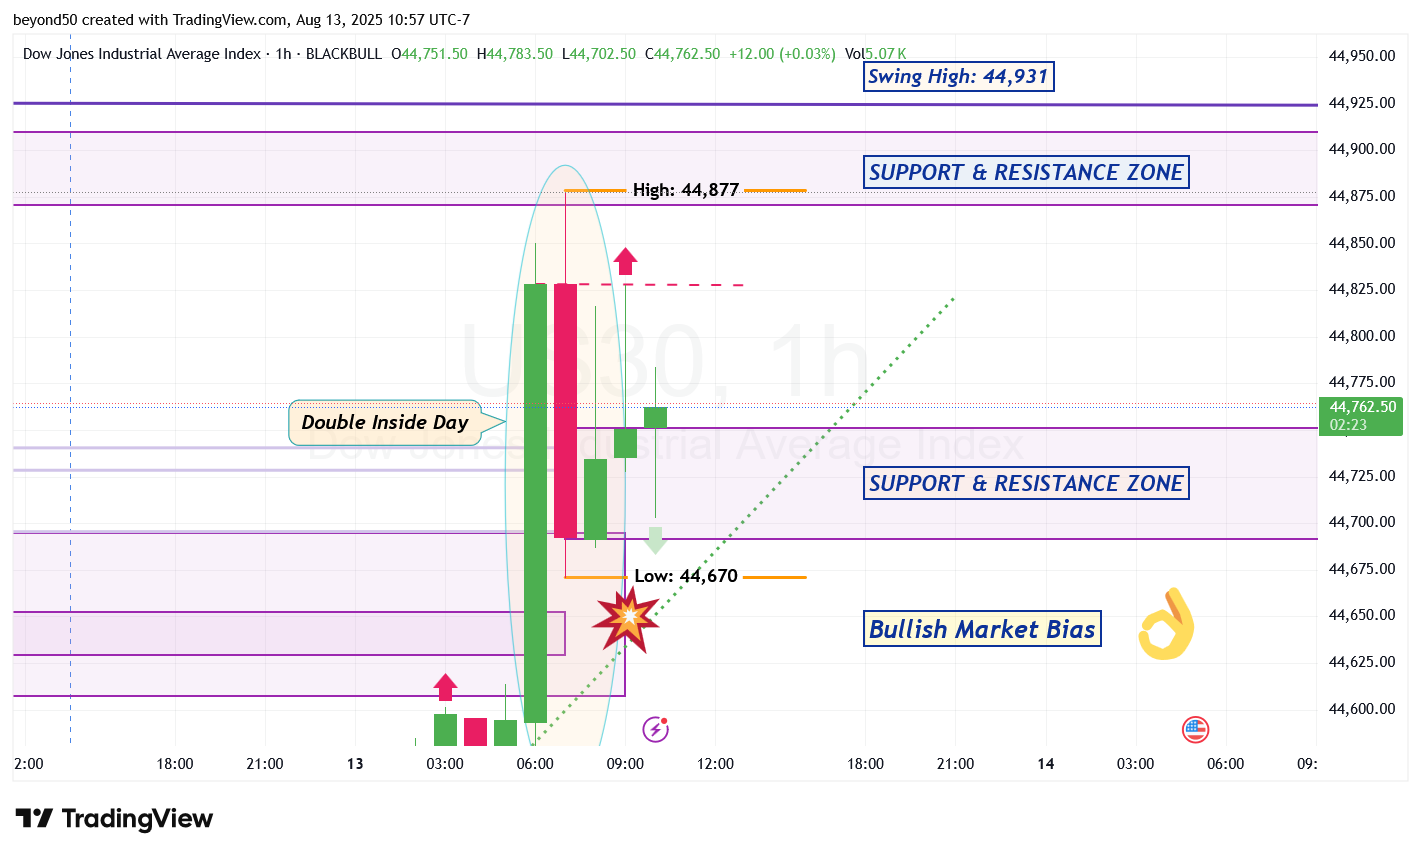
The bulls can either rise up from the S&R Zone and head for another one above them (that starts at 44,871) OR the bears can drop below this Zone and break the Bullish Trendline (in green dotted line) for a greater move down (to 44,572 through mean reversion).
A very BIG move is still coming!
*My Prediction: Price action will consolidate around the S&R Zone to go to the right of the Bullish Trendline, then drop down.
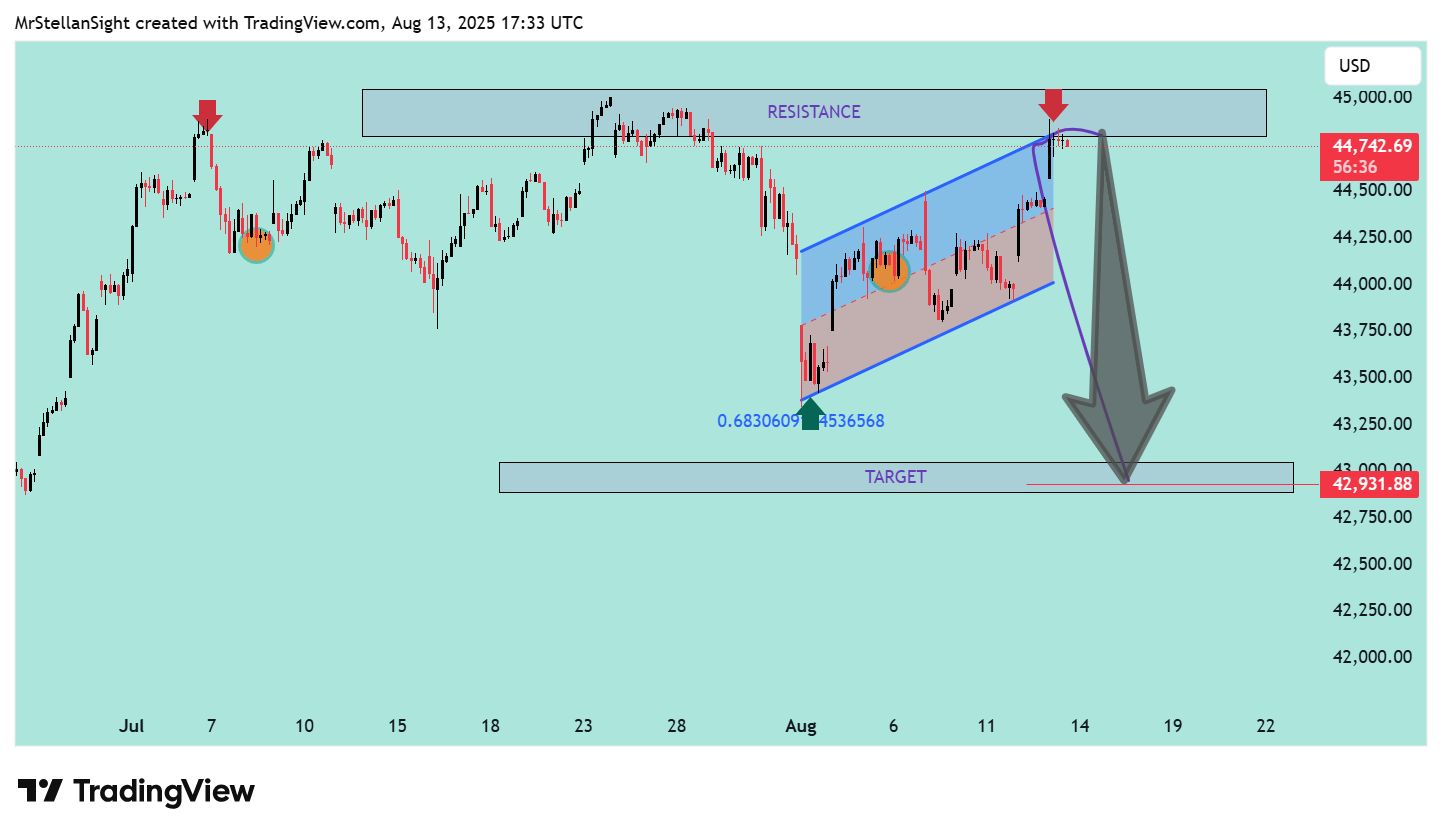
Breakdown from the rising channel
Projected Drop toward ~42,931 USD
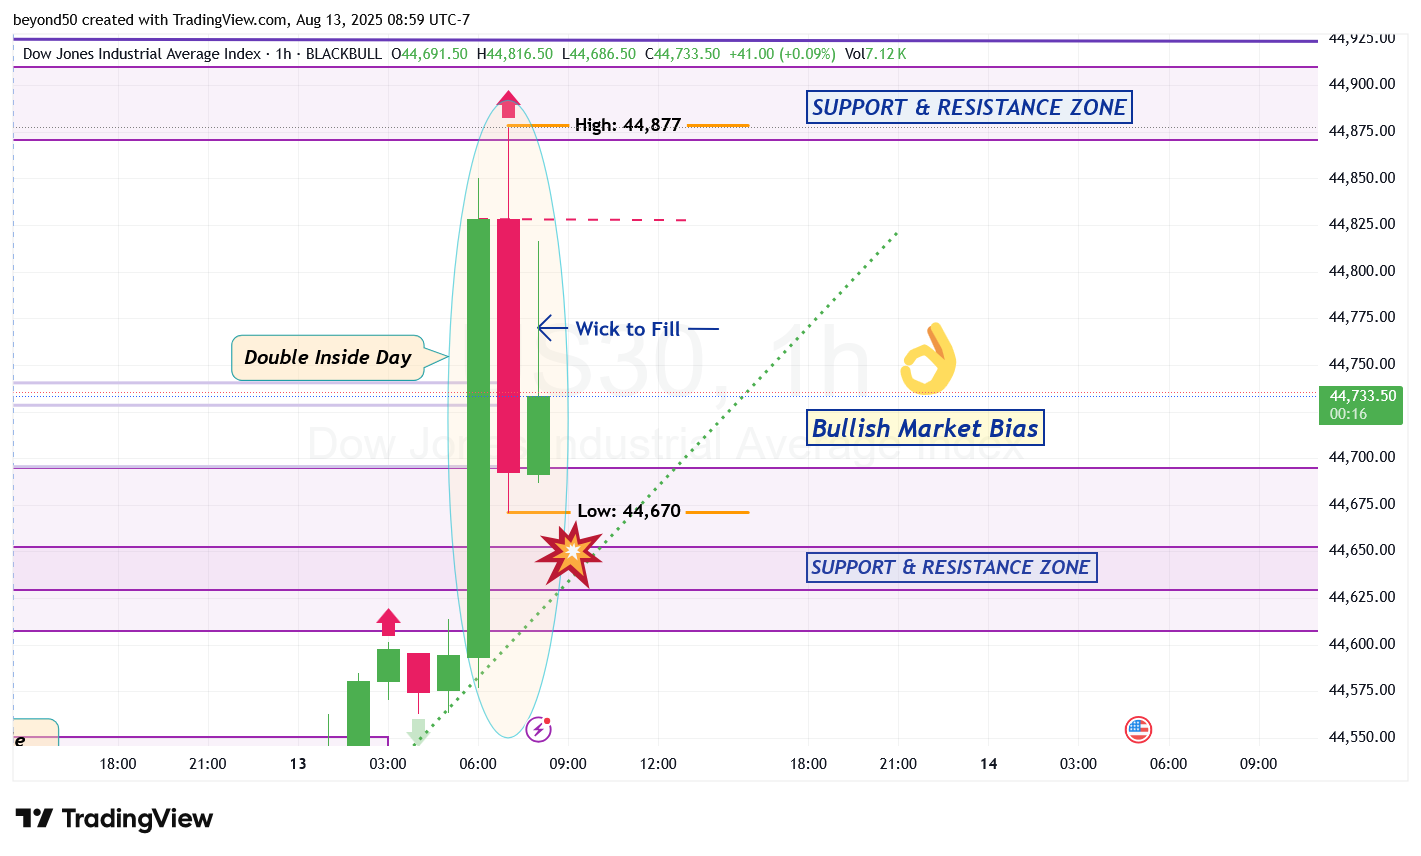
On the Hourly, a Double Inside Day pattern showed up. That means a very BIG move is coming, either during this session or in the After Hours. When you look at the Average True Range between the last three candles, it can potentially be a major move to the upside or downside.
In the new hour, there may be a bullish candle that does an upper wick fill of this bullish candle, then drop down.
An Inside Day pattern also formed, which is a market pause with no true direction. Breakout from this can either be from the pattern's high of 44,877 or low of 44,670 (shown as two orange lines), so watch for that.
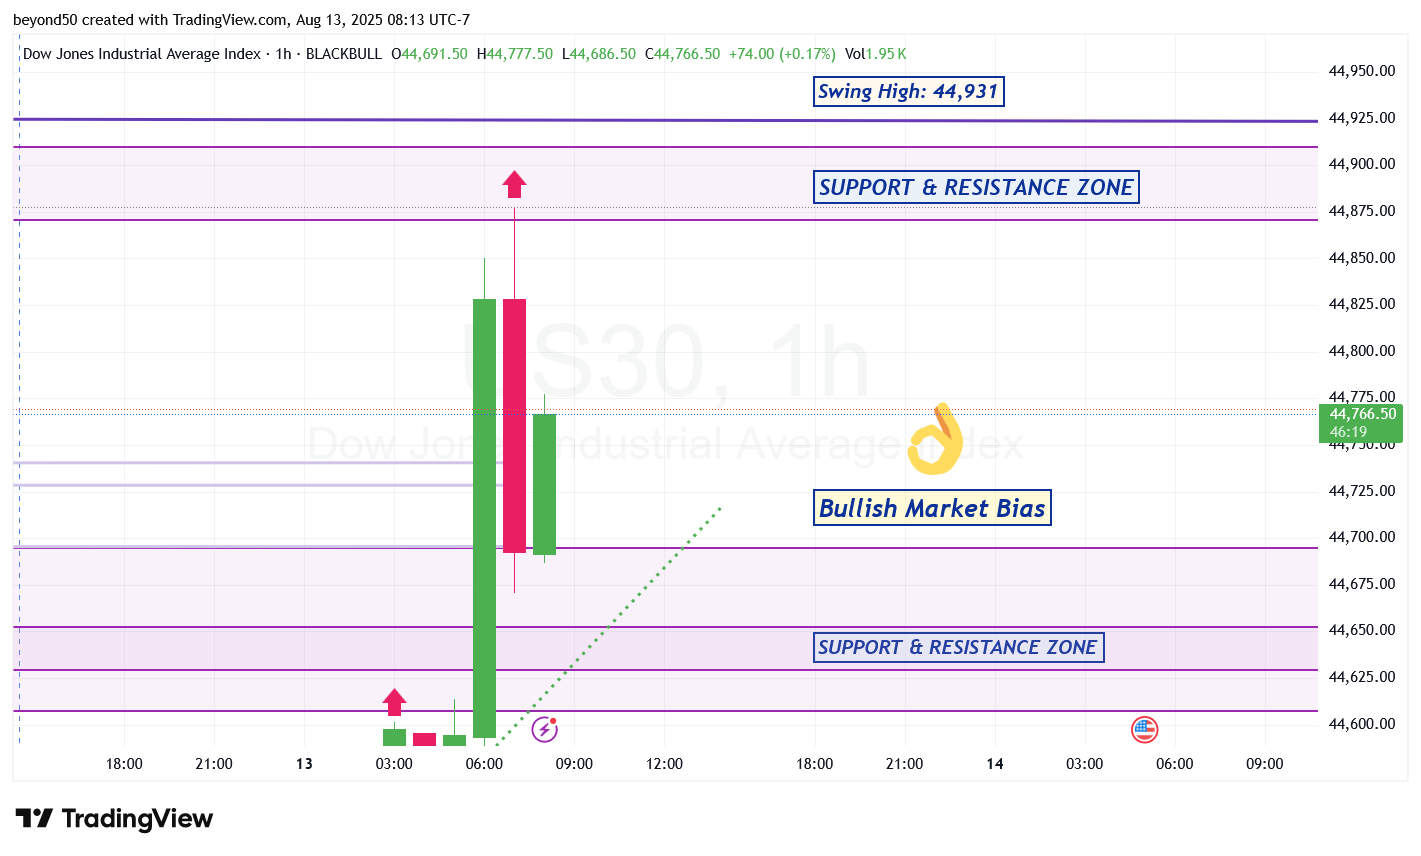
Also, the Bullish Trendline (in green dotted line) is still very close for the bears to break, then drop down.