NextGenTraders81 NAS short swingI have my sell limit set at 23,500 as there is alot of sell limits set there, also at 23,550 hence the SL is above that zone.
I am pretty sure the position will be set on BE before it tries to return to these highs, how long it will take to hit TP, who knows.. a correction within the channel is due after numerous ATHs.
If you will follow, take partials on the way !
Good luck :)
NDQUSD trade ideas
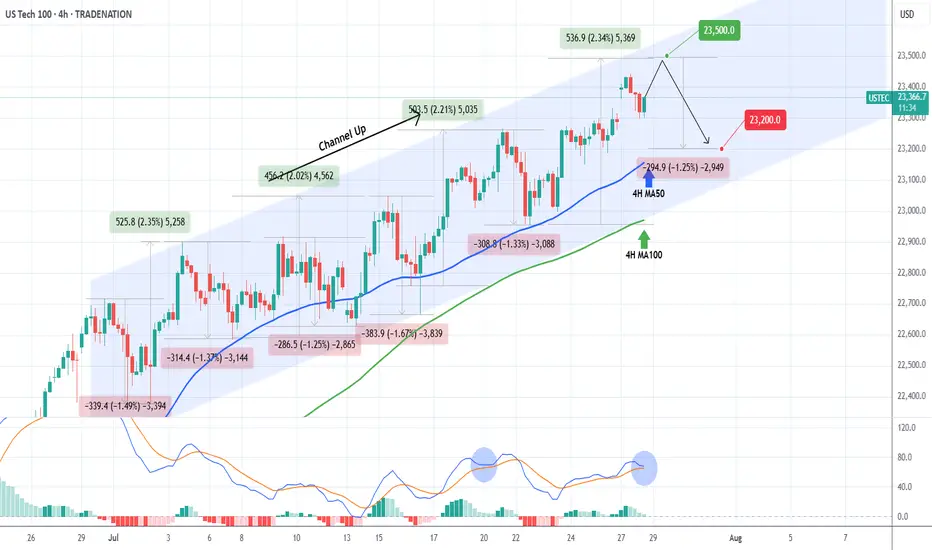
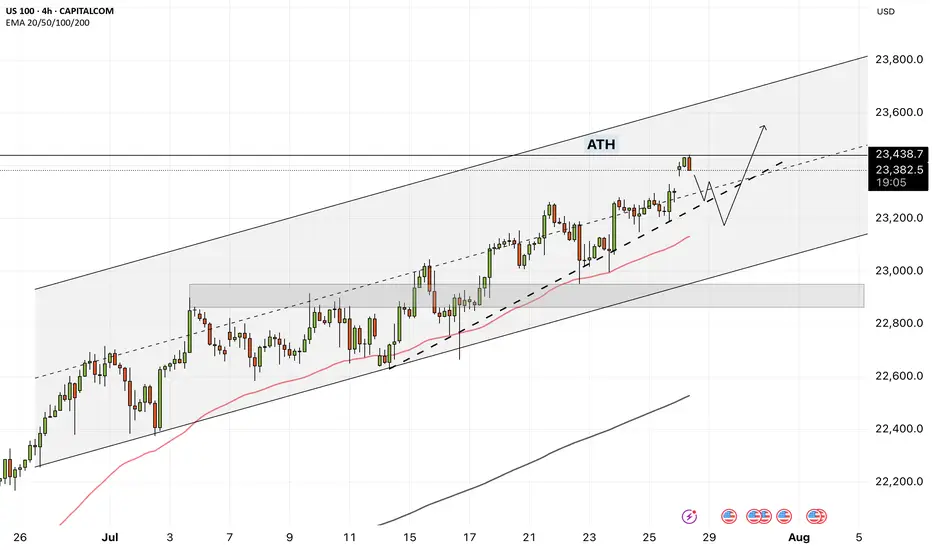
NASDAQ Channel Up to be rejected soon.Nasdaq (NDX) has been trading within a Channel Up since the start of the month. The primary Support level has been the 4H MA50 (blue trend-line), which hasn't closed a 4H candle below it since July 14.
Right now the index is on its latest Bullish Leg, which can technically extend by +2.35% (max such Leg within the Channel Up).
We expect a rejection targeting the 4H MA50 again at 23200, which would represent a -1.25% decline, the weakest such Bearish Leg we had within the Channel Up.
-------------------------------------------------------------------------------
** Please LIKE 👍, FOLLOW ✅, SHARE 🙌 and COMMENT ✍ if you enjoy this idea! Also share your ideas and charts in the comments section below! This is best way to keep it relevant, support us, keep the content here free and allow the idea to reach as many people as possible. **
-------------------------------------------------------------------------------
Disclosure: I am part of Trade Nation's Influencer program and receive a monthly fee for using their TradingView charts in my analysis.
💸💸💸💸💸💸
👇 👇 👇 👇 👇 👇
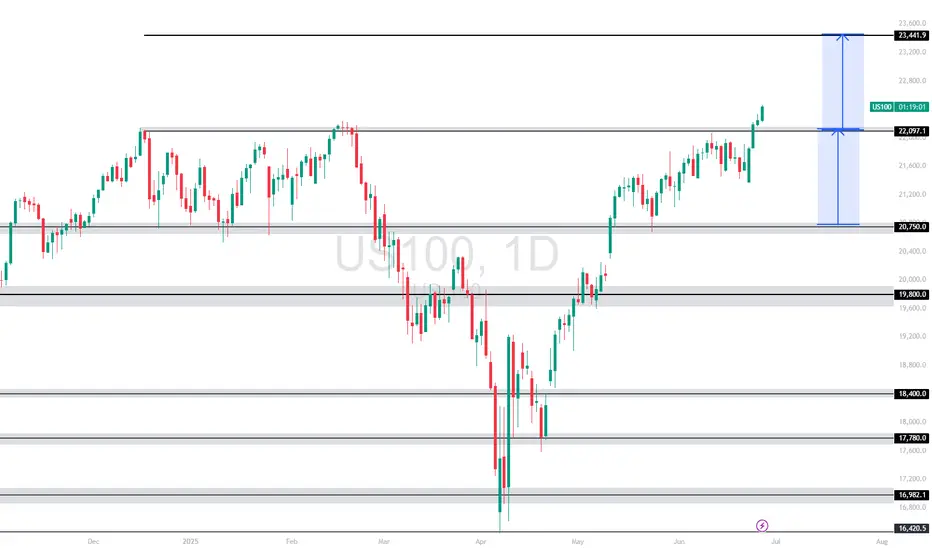
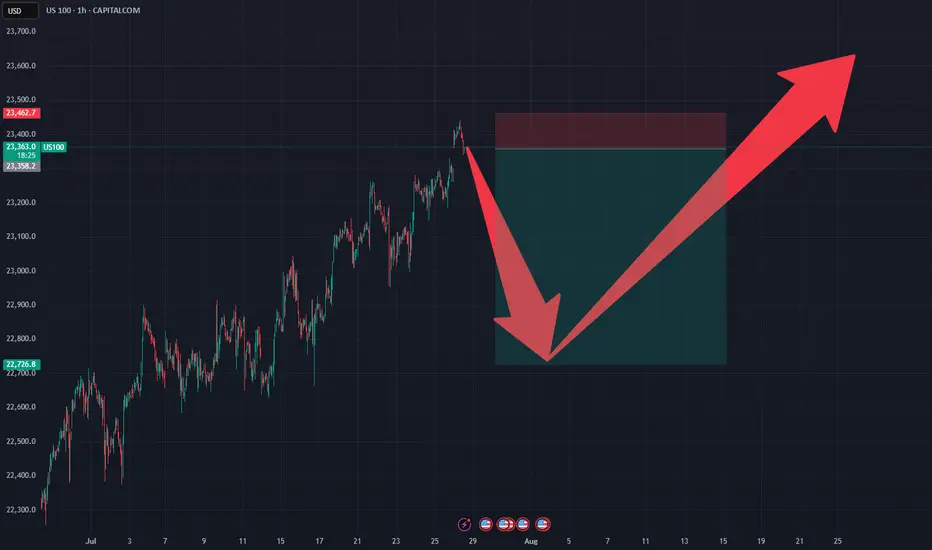
US100 (NASDAQ 100 Index) – Breakout with Clear Upside ProjectionUS100 has broken out cleanly above the key resistance at 22,097.1, indicating bullish continuation. The breakout is supported by strong upward momentum, targeting the next key level around 23,441.9, as illustrated by the projected range.
Support at: 22,097.1 🔽 | 20,750.0 🔽
Resistance at: 23,441.9 🔼
🔎 Bias:
🔼 Bullish: Sustained price action above 22,097.1 keeps the bullish breakout valid, aiming toward 23,441.9.
🔽 Bearish: A drop back below 22,097.1 would invalidate the breakout, possibly pulling price toward 20,750.0.
📛 Disclaimer: This is not financial advice. Trade at your own risk.
NASDAQ Potential UpsidesHey Traders, in today's trading session we are monitoring NAS100 for a buying opportunity around 23,140 zone, NASDAQ is trading in an uptrend and currently is in a correction phase in which it is approaching the trend 23,140 support and resistance area.
Trade safe, Joe.
NASDAQ Potential UpsidesHey Traders, in today's trading session we are monitoring NAS100 for a buying opportunity around 23,300 zone, NASDAQ is trading in an uptrend and currently is in a correction phase in which it is approaching the trend at 23,300 support and resistance area.
Trade safe, Joe.
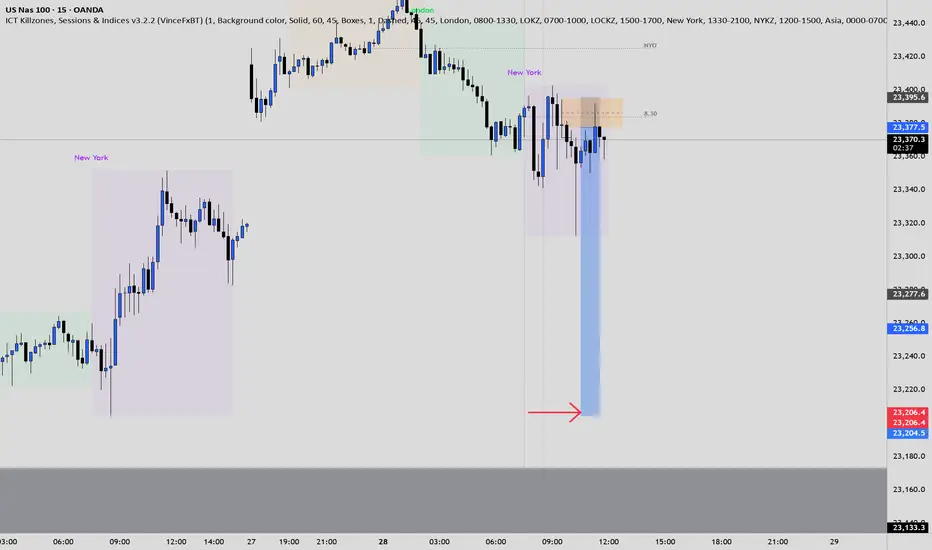
NAS100 shortElite analysis
Confirmed the entire checklist
Targeting lower liquidity pools.
Main Target NY Low.
This was confirmed from Daily all the way down to 1m.
US100US100 is in reversal trend.
Alligator mouth is closed which shows trend will be reversal from here.
Divergence also indicates trend will go down
We sell at CMP.

We Got The Deal - Time To Sell The NewsOkay, so we have the long-awaited deal between the US and the EU. After a large up-gap was announced last night, it now seems as if a “sell the facts” scenario is unfolding.
Such a wave of selling would also fit in well with the typical seasonal weakness that we often see in the markets from August onwards.
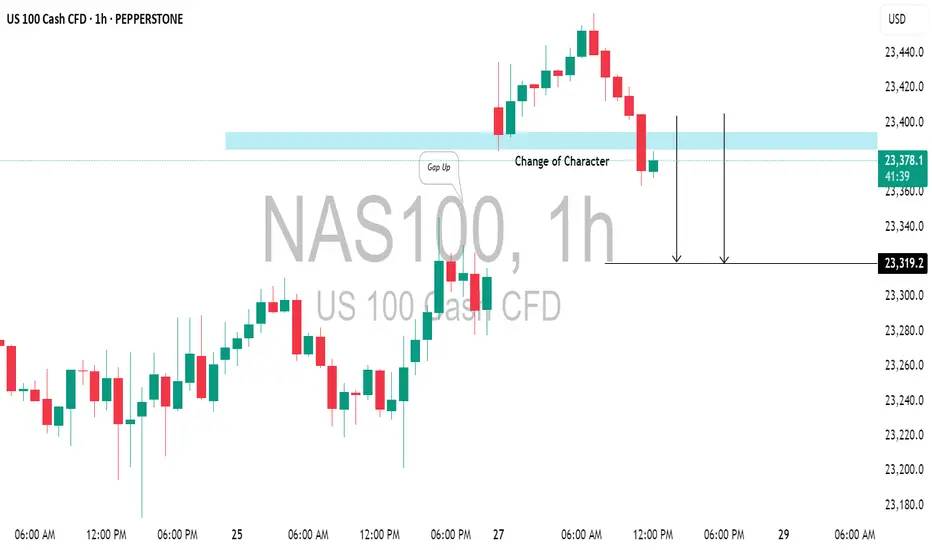
NASDAQ INDEX (US100): Another Gap For Today?I anticipate another gap up opening on the 📉US100 Index, which I believe will be filled today.
The formation of an intraday bearish change of character(CHOCH) on the hourly chart
This indicates a strong likelihood of continued bearish movement, with a target of 23319.
Weekly UpdateBased on how the previous weeks have been running, closing bearish is my anticipation looking into the new Month. Today i will sit out and observe.
NAS100 - How will the stock market react to the FOMC meeting?!The index is trading above the EMA200 and EMA50 on the four-hour timeframe and is trading in its ascending channel. The target for this move will be the ceiling of the channel, but if it corrects towards the indicated support area, you can buy Nasdaq with better reward-risk.
As signs of easing global trade tensions begin to emerge, the Federal Open Market Committee (FOMC) is scheduled to meet this week. Analysts widely expect the Fed to hold interest rates steady for a fifth consecutive time. This anticipated decision comes as the U.S. President continues to push for rate cuts, persistently pressuring the Fed to adopt a more accommodative monetary stance.
So far, the Federal Reserve has kept its benchmark rate within a range of 4.25% to 4.5%. While some officials project two cuts by the end of the year, markets are waiting for the Fed’s patience to run out. According to the CME Group’s FedWatch tool, investors have priced in a 62% chance of a rate cut in the September meeting. By then, the Fed will have access to the July and August employment reports—key indicators of whether the labor market is weakening or remains resilient.
The upcoming week marks the peak of Q2 earnings season, with 37% of S&P 500 companies reporting results, including four major tech firms. In parallel, the August 1st tariff deadline for the EU and other countries is approaching, while legal challenges over existing tariffs remain ongoing.
According to a report by The Wall Street Journal, many large U.S. corporations have so far absorbed the bulk of tariff-related costs without passing them on to consumers. This strategy aims to maintain market share and avoid drawing criticism from President Trump. However, the question remains—how long can this continue?
Examples from the report include:
• General Motors paid over $1 billion in tariffs in Q2 alone without announcing any price hikes.
• Nike expects a $1 billion hit from tariffs this fiscal year and is planning price increases.
• Hasbro is working on a combination of price hikes and cost cuts to offset $60 million in tariff impacts.
• Walmart has made slight pricing adjustments (e.g., bananas rising from $0.50 to $0.54) and managed pressure through inventory reductions.
This week is shaping up to be one of the busiest on the economic calendar in recent months. A flood of key data on growth, inflation, and employment, alongside three major interest rate decisions, has markets on high alert.
On Tuesday, attention will turn to two significant reports: the Job Openings and Labor Turnover Survey (JOLTS) and the U.S. Consumer Confidence Index for July. These metrics will offer a clearer view of labor market dynamics and household sentiment heading into critical monetary policy decisions.
The most anticipated day is Wednesday. That day brings the ADP private payrolls report, the first estimate of Q2 GDP, and pending home sales data. Additionally, both the Bank of Canada and the Federal Reserve will announce rate decisions—events with the potential to simultaneously steer global market trajectories.
On Thursday, the July Personal Consumption Expenditures (PCE) price index will be released—a key inflation gauge closely monitored by the Fed. Weekly jobless claims data will also be published that day.
The week concludes Friday with two heavyweight economic indicators: July’s Non-Farm Payrolls (NFP) report, a crucial input for Fed policy decisions, and the ISM Manufacturing PMI, which offers insights into the health of the real economy.
Some economists argue that a September rate cut may be premature, and even suggest that no rate changes might occur in 2025. Analysts expect Fed Chair Jerome Powell to reiterate a data-dependent stance, consistent with previous meetings.
Still, beyond political dynamics, the July meeting holds independent significance.The Fed’s internal policy tone is gradually leaning more dovish, and subtle signals of this shift may emerge in the final statement. Given that only one meeting remains before September, if policymakers are leaning toward a rate cut then, it’s critical that the groundwork for such communication be laid now.
Nasdaq bearish nasdaq after taking out liquidity short term based and more bearish momentum can be expectected .

Nasdaq Index Analysis (US100 / NASDAQ):The Nasdaq index continues its medium- to long-term uptrend and has recently reached a new high at 23,466 USD.
1️⃣ A break and close below 23,200 USD could lead to a pullback toward 23,000, followed by 22,920 USD.
2️⃣ However, if the price holds above 23,330 USD, further bullish continuation is expected, potentially leading to a new all-time high.
⚠️ Disclaimer:
This analysis is not financial advice. It is recommended to monitor the markets and carefully analyze the data before making any investment decisions.

Beyond the Chart – NAS100 Through Technicals & Fundamentals📊 CAPITALCOM:US100 Analysis
Today, NAS100 opened with a huge gap up following former President Trump’s announcement that the U.S. has officially reached a trade agreement with the European Union.
🕳️ After price rejected the gap zone, and volume gets low low. I’m now looking for a potential test of the 23,540 level.
💼 With Q2 earnings season kicking off, stock-moving news will be hitting fast. While retail traders might scramble to catch up, smart money is already positioning for surprise earnings beats.
Stay sharp, this week could set the tone for the next major move.
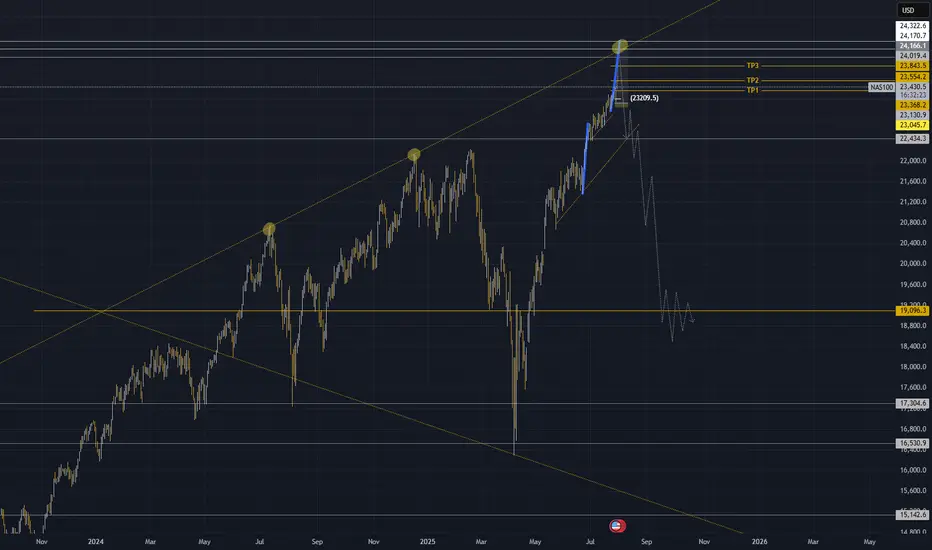
NAS100 Technical Outlook — Final Impulse Before the Fall?
The NAS100 has just completed its 5th touch on a long-term ascending trendline, forming a clear rising wedge pattern. Historically, each touch of this structure has triggered significant bearish reversals — and this time looks no different.
🔹 However, before the major drop, I'm expecting a final impulsive wave of around 1,000 pips— a last bullish move that could stretch toward the 24,300–24,400 zone. This would complete the wave structure and offer a strong sell opportunity.
🔻 After that, a deeper correction is likely, targeting the 19,000 area, which aligns perfectly with:
The midpoint of the wedge on the daily chart
A strong historical support zone
A potential area for medium-term consolidation
⚠️ As long as price remains below 24,400, the bearish scenario remains valid. Any daily close above that level would force a re-evaluation.
🧠 This setup reflects a classic distribution phase followed by a high-probability breakdown.
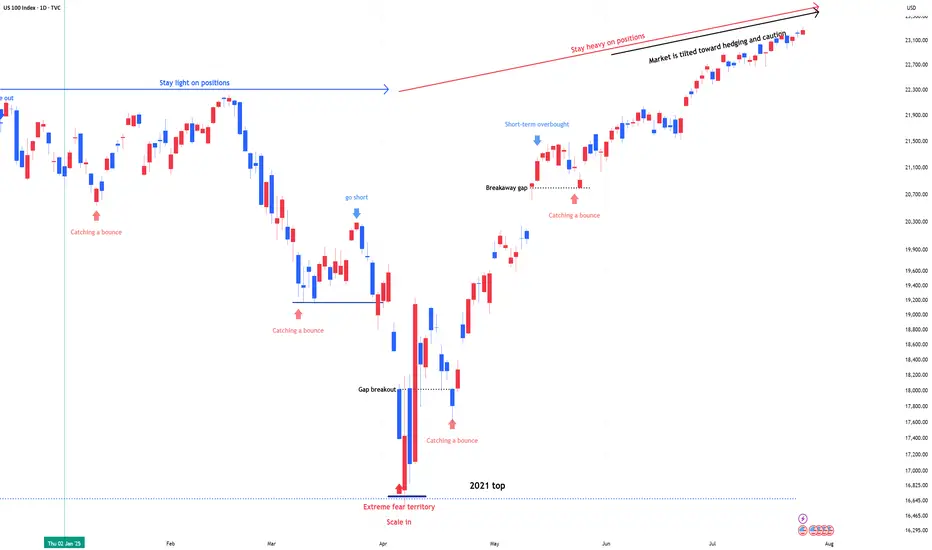
NDX & SPX , Stay heavy on positionsNDX & SPX , Stay heavy on positions (QLD, TQQQ)
Market sentiment is currently tilted toward betting on downside volatility, which ironically supports the case for the stock market to continue its upward trend.
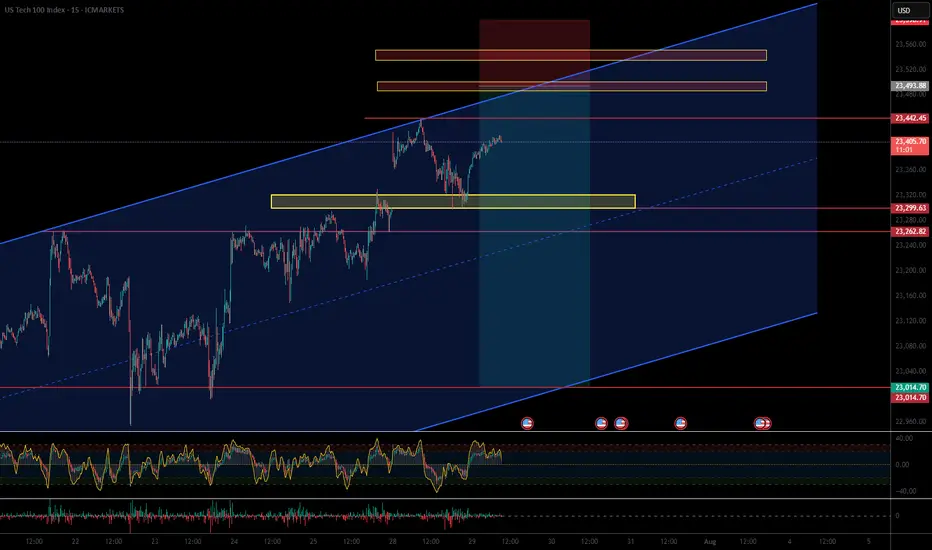
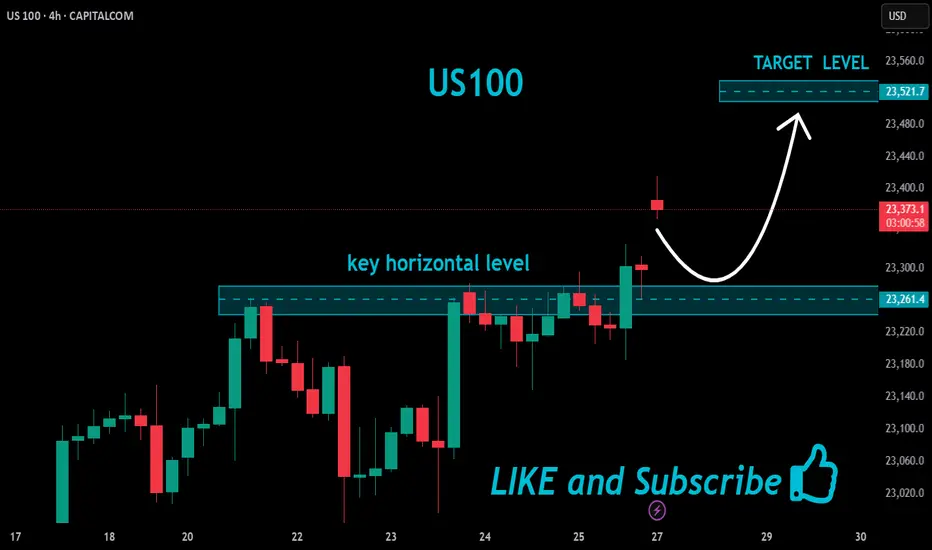
US100 Bullish Breakout!
HI,Traders !
#US100 is trading in a strong
Uptrend and the price made a
Bullish breakout of the key
Horizontal level of 23261.4
So we are bullish biased
And we will be expecting a
Further bullish move up !
Comment and subscribe to help us grow !
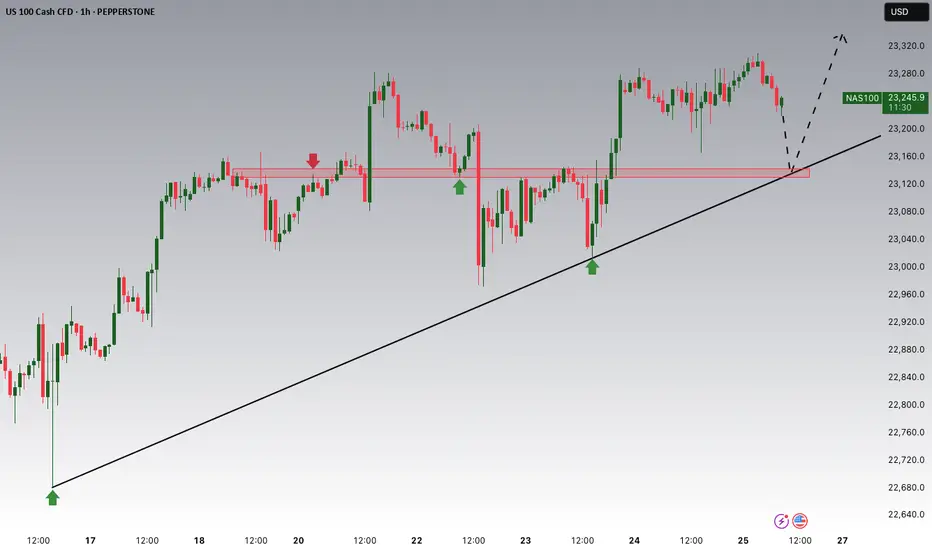
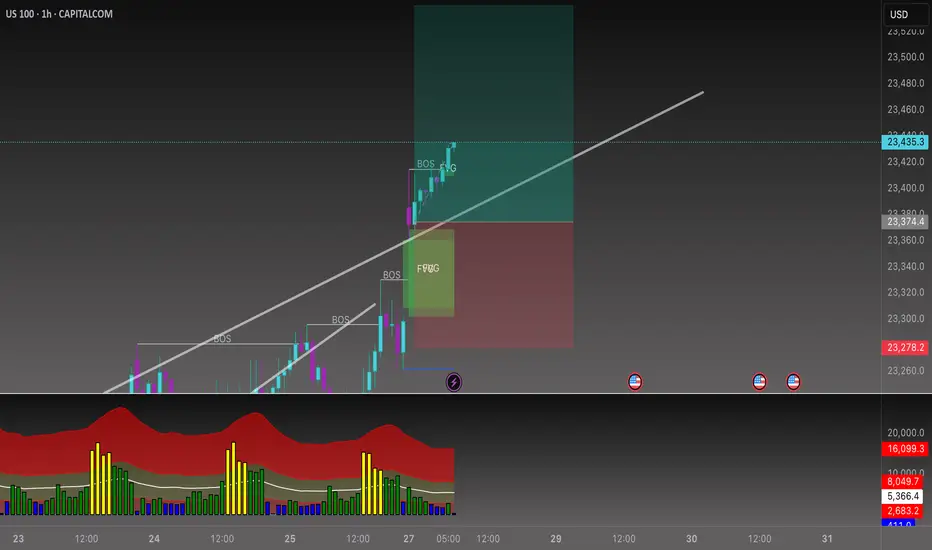
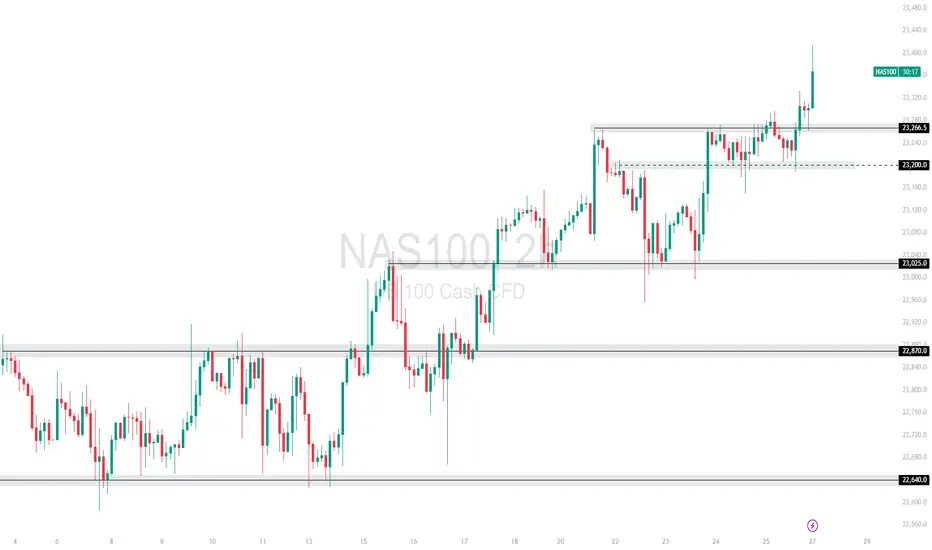
NAS100 Gaps Up on Trump Trade Deal – Bullish Continuation The market opened with a bullish gap after Trump announced new trade deals, sparking investor optimism. Price cleanly broke above the 23,266.5 🔼 resistance level, confirming it as a fresh support zone.
Buyers are now in full control, and price is forming a strong bullish structure with higher highs and higher lows.
Support at: 23,266.5 🔽, 23,200 🔽, 23,025 🔽
Bias:
🔼 Bullish: As long as price holds above 23,266.5, the path is clear for a move toward 23,400 and possibly 23,540+. Watch for minor pullbacks into support for continuation setups.
🔽 Bearish: A break back below 23,266.5 would be the first warning of bullish exhaustion, with downside potential toward 23,200.
📰 News Insight: The bullish gap came after Donald Trump announced new trade deals, boosting risk sentiment across U.S. indices. This has become a key short-term fundamental catalyst.
📛 Disclaimer: This is not financial advice. Trade at your own risk.
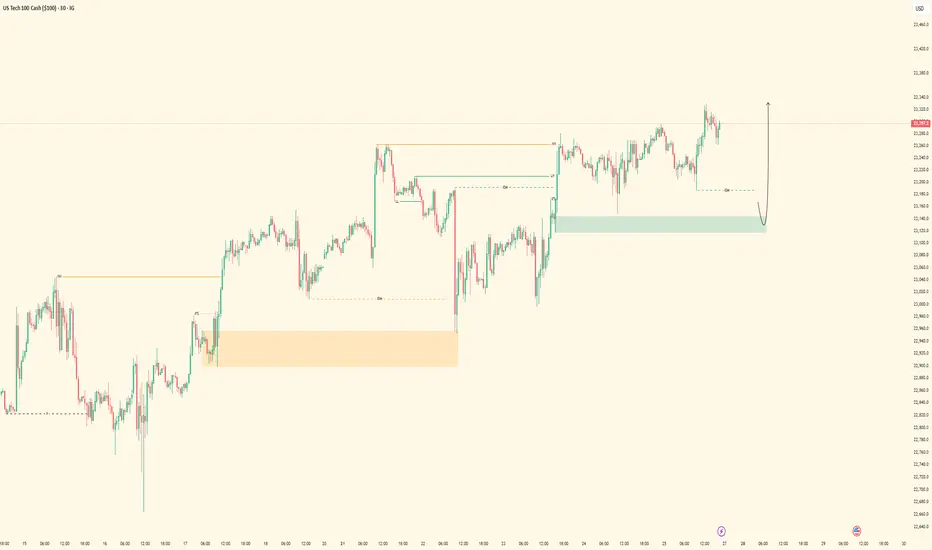
NASDAQ| Bullish Bias - Refined OB Near MitigationPair: NASDAQ (NAS100)
Bias: Bullish
HTF Overview (4H):
Strong bullish structure has been the narrative, and last week’s upside intent confirmed the move. Current action suggests price is preparing for continuation after brief consolidation.
LTF Confirmation (30M):
Structure has been refined with a key OB in play. Price is approaching mitigation, and I’ve been tracking this level closely since last week.
Entry Zone: Waiting for clear 5M shift after OB mitigation. 5M OB already tapped — now I’m watching for confirmation to execute.
Targets: 5M highs first, 30M highs if price maintains momentum
Mindset Note: Focused and flowing. No forcing — I’ve tracked this from HTF to LTF and now I’m just waiting for price to invite me in. Clarity + patience = execution.
Tech stocks are still not out of the woods, priced in gold.Tech stocks are still not out of the woods, priced in gold.
Right now, it looks like a BIG TOPPING pattern morphing into existence.
No man's land.

"NASDAQ 100 Heist – Scalp, Swing, or Hold? (Full Plan)🔥 NASDAQ 100 HEIST PLAN – BULLISH LOOT AWAITS! 🔥
🚨 Attention Market Robbers & Money Makers! 🚨
(Swing/Day Trade Strategy – High-Risk, High-Reward Play)
🎯 Mission Objective: Loot the NDX100/US100 (NASDAQ 100) Like a Pro!
Based on Thief Trading’s ruthless technical & fundamental analysis, we’re executing a bullish heist—targeting the Red Zone (high-risk, high-reward area).
⚠️ WARNING: Overbought market, consolidation zone, potential bear traps—weak bears may get slaughtered! Strong hands only!
🔐 ENTRY: The Vault is OPEN!
"SWIPE THE BULLISH LOOT!" – Any price is a steal, but smart thieves use:
Buy Limit Orders (15m-30m TF) near recent swing lows/highs.
DCA/Layering Strategy – Multiple limit orders for max loot.
Breakout Confirmation – Don’t jump in early; wait for the real move!
🛑 STOP LOSS: Protect Your Stash!
Thief’s SL Rule: Nearest 4H swing low (22,600) – WICK LEVEL ONLY!
DO NOT place SL before breakout! (Patience = Profit.)
Adjust SL based on risk, lot size, and number of orders.
🎯 TARGETS: Escape Before the Cops Arrive!
Main Take-Profit: 24,400 (or exit early if momentum fades).
Scalpers: Longs ONLY! Use trailing SL to lock in profits.
Swing Traders: Ride the wave like a true market pirate!
📰 FUNDAMENTAL BACKUP: Why This Heist Will Work
Bullish momentum in NDX100 driven by:
Macro trends (Fed, inflation, tech earnings).
COT Report & Institutional positioning.
Geopolitical & Sentiment Shifts.
Intermarket correlations (USD, Bonds, Tech Sector).
(Stay updated—markets change FAST!)
⚠️ TRADING ALERT: News = Danger Zone!
Avoid new trades during high-impact news.
Trailing SL = Your best friend.
Lock profits early if volatility spikes!
💥 BOOST THIS HEIST! 💥
👉 Hit LIKE & FOLLOW to strengthen our robbery crew!
🚀 More heists coming soon—stay tuned, thieves! 🚀

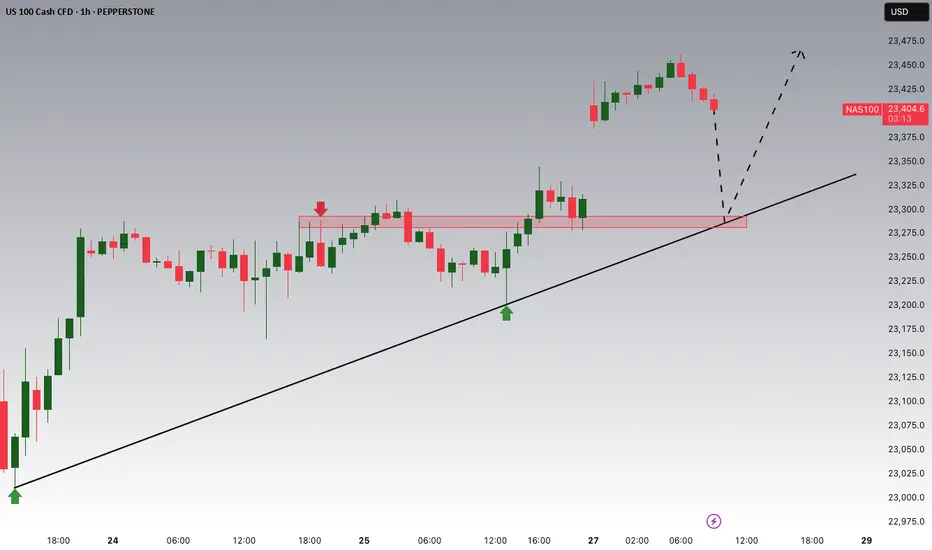
US100 LONGWe can see that there is a strong resistance zone, and the US30 has made a pullback into that zone. Based on the SK system, the outlook appears more bullish for this week.
