Nas100 today movement another down trend but we have to follow up according the trendline and candle readings
NDQUSD trade ideas
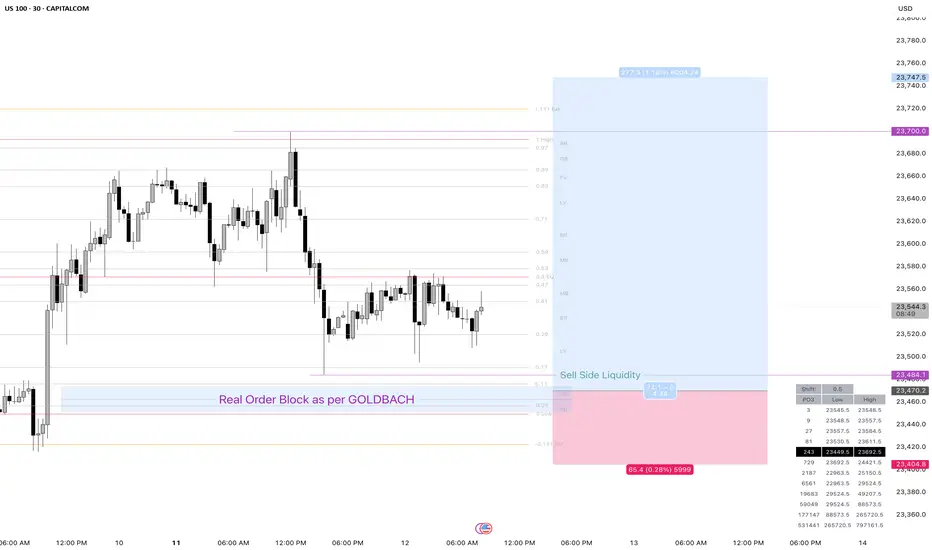
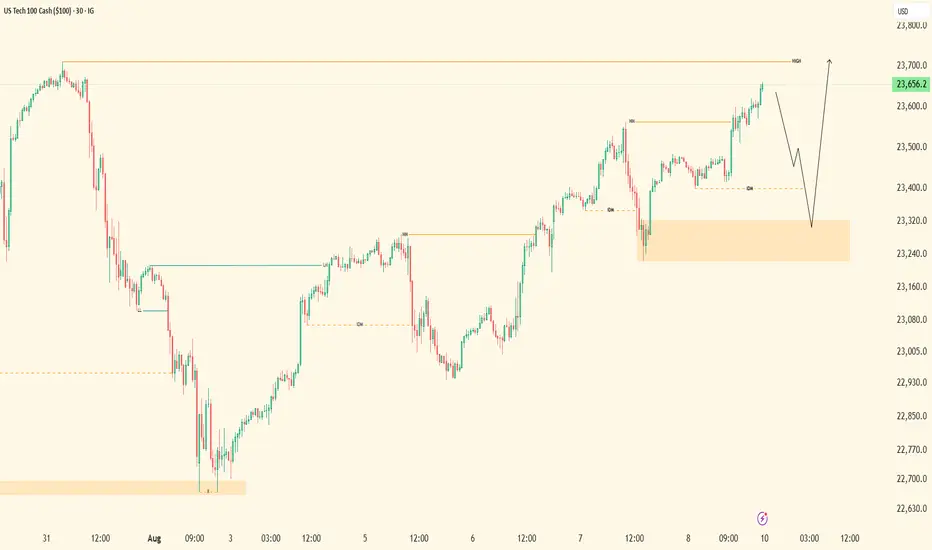
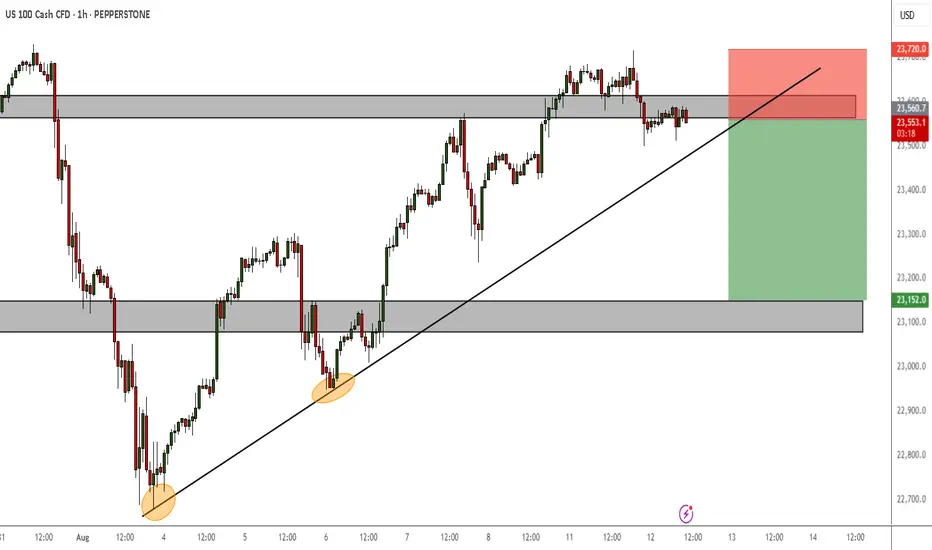
Nasqad Us100-NQ. Buy setup CPI -12-aug-2025Expecting to hit sell side liquidty first and test the order block as per GOLDBACH and move upside
Good Luck
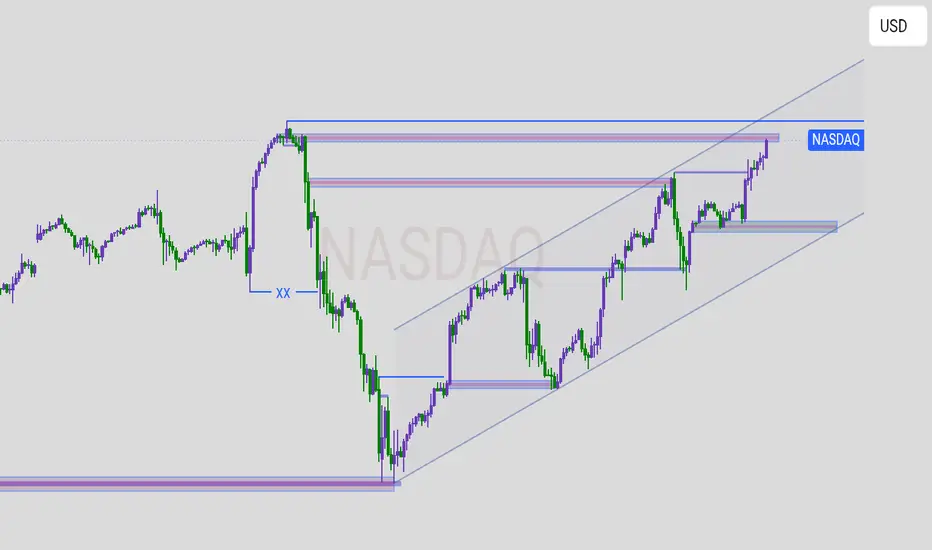
NASDAQ (US Tech 100) chart
Here’s the simple breakdown:
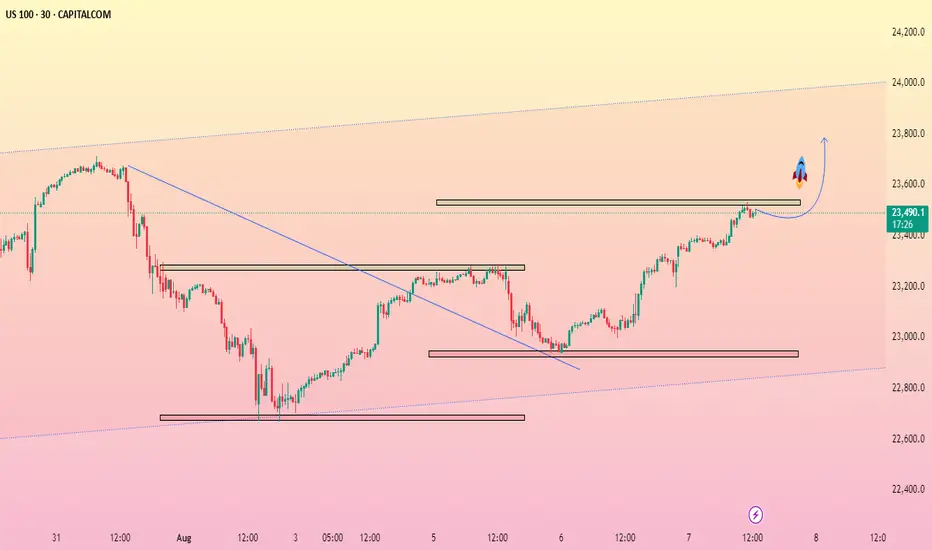
* Price is moving upward inside a rising channel
* This means NASDAQ is currently bullish.
* The price is **near the top resistance** of the channel.
* There’s a **horizontal blue resistance zone** where price has struggled before — it’s testing that level again.
* If price **breaks above** this zone, it could continue climbing toward the upper channel line.
* If price **fails** to break, it may drop back to the **nearest support zone** (the lower rectangle).
Resistance:
The top horizontal blue zone — price must break and hold above it for more upside.
* **Support:** Two blue rectangles below show where price might bounce if it drops.
* The middle support is also in line with the **channel’s lower trendline** — a strong bounce area.
* **Bullish bias**
while inside the channel.
* Watch for a **break above resistance** for a big push up, or a **rejection** for a short-term pullback to support.
NASDAQ-100| Bullish Bias📌 Higher Time Frame (4H/2H) Context
• Market remains bullish, currently in push phase toward 4H highs.
• No sweep or mitigation at the previous 4H order block — price pushed higher with strong momentum.
• 4H Demand Zone: 22,576 – 22,376
• Liquidity at 22,955 cleared → room for continuation to higher targets.
⸻
⏳ Lower Time Frame (30M/5M) Confirmation
• 30M structure refined, bullish order flow intact.
• Current liquidity resting near 23,400.
• Watching 30M OB: 23,322 – 23,222 for a pullback, liquidity sweep & inducement.
⸻
🎯 Execution Plan
• Entry Zone: 23,321 – 23,221 (refined OB)
• Stop-Loss: 23,225
• TP1: 5M + 30M structural highs
• 30M Structural High Target: 23,714
⸻
🧠 Mindset Note
Patience is key — wait for price to pull back into the OB zone and give lower time frame confirmation. No chasing. Let liquidity sweep first, then execute.
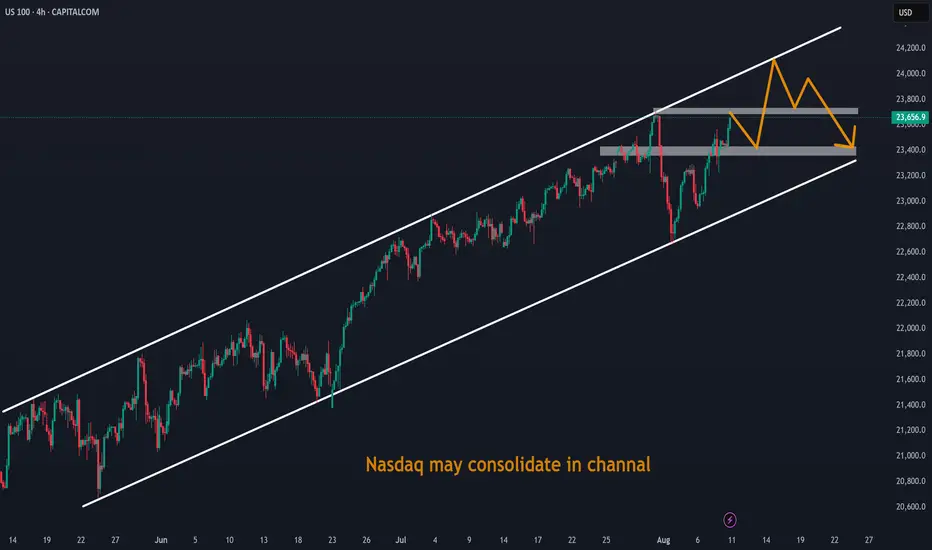
Nasdaq may consolidate in channalNasdaq may consolidate in channal. Waiting some big news to trigger.
Trading update on NASDAQ 100
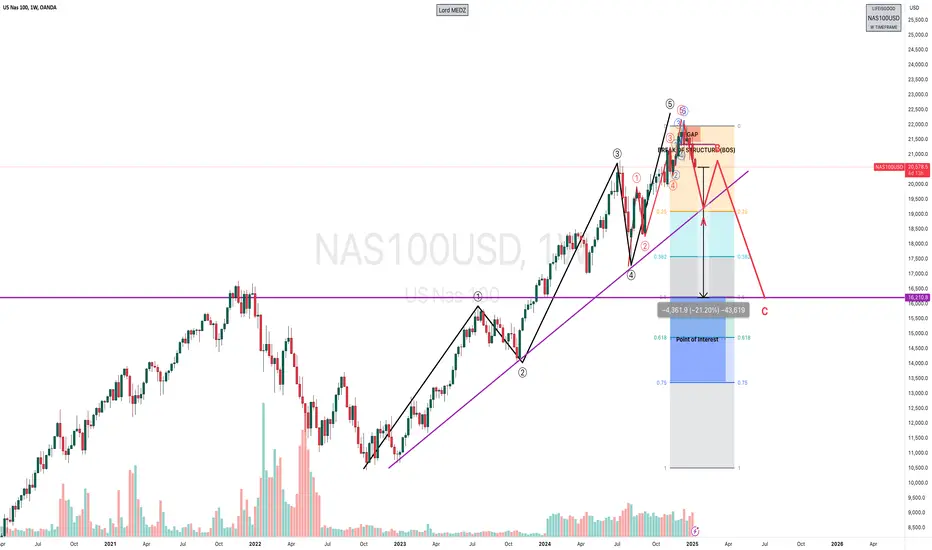
MEGA Cycle ended?
Greetings, traders!
The markets are at a critical juncture, and it's essential to prepare for what could be a significant correction in the NASDAQ 100 and, by extension, the broader stock market. Here's my analysis and outlook based on current price action, key levels, and technical indicators.
Potential for a 21% Decline in the NASDAQ 100
As I highlighted in the attached daily and weekly charts:
Elliott Wave Analysis:
The NASDAQ has completed its five-wave impulsive structure, signaling the potential end of a major bullish cycle. We are now in the midst of a corrective phase, which appears to be unfolding in the form of an ABC correction. This correction suggests that Wave C, the final leg down, is still in progress, with room for further downside.
Break of Structure (BOS):
A Break of Structure has occurred, confirming the bearish sentiment. Coupled with the presence of an unfilled gap overhead, it's clear that sellers are currently in control.
Key Fibonacci Levels:
The 0.618 Fibonacci retracement at 16,210 is a critical level to watch. A break below this support could open the door for a more extended drop to the 0.75 retracement at 13,200, representing a 21% decline from current levels.
Trendline at Risk:
The ascending trendline that has supported the NASDAQ since its 2022 lows is being tested. If this trendline breaks, it will likely trigger a cascade of selling pressure, accelerating the move to our projected downside targets.
Broader Market Implications
The NASDAQ often serves as a barometer for risk appetite in the financial markets. A sharp decline here could have ripple effects across other indices and sectors, particularly tech-heavy and growth-focused stocks. Watch for potential spillovers into the S&P 500 and Dow Jones Industrial Average, which could amplify market-wide volatility.
Key Levels to Watch
Resistance:
Gap area near 21,600–21,800.
This zone is likely to act as a supply area if the market attempts any retracement.
Support:
16,210 (0.618 retracement) – Initial target and a potential temporary bounce zone.
13,200 (0.75 retracement) – Ultimate target if bearish momentum persists.
Trading Strategy
For traders looking to capitalize on this potential move:
Short Positions:
Consider shorting retracements into resistance zones like the gap area or the 0.25 Fibonacci level.
Use 16,210 as a primary profit target, with a portion of the trade left to run toward 13,200 if bearish momentum accelerates.
Risk Management:
The markets remain volatile, so ensure you have clear stop-losses in place to protect against unexpected reversals.
Watch for Confirmations:
Monitor volume spikes, candlestick patterns (e.g., bearish engulfing), and breaks of key levels like the ascending trendline for additional entry confirmations.
Final Thoughts
The NASDAQ and broader markets are entering a critical phase. While the correction presents risks, it also provides opportunities for traders and investors who stay vigilant and disciplined.
Remember, patience and preparation are key to navigating volatile markets like these.
Stay sharp, stay informed, and trade smart.
Lord MEDZ


NasdaqAs said before, nasdaq going down, can take out highs then plummet, but time will tell. PS: my previous posts got removed. View auto supply and demand zones indicator. Dm me free for a month free. (It draws snd zones).
NASDAQ 100| Bullish OutlookHTF (4H)
Price has broken major external structure highs, currently trading near the 23,712 zone with strong bullish momentum. My focus is on buying opportunities after a clean pullback — ideally sweeping sell-side liquidity into the 4H OB. Price action is being monitored closely for confirmation.
LTF (30M/5M)
Structure remains clean and respected. I’m watching for a liquidity sweep into the 23,444 – 23,399 OB zone.
Execution Plan
Targeting 5M highs for intraday delivery or 30M highs if momentum extends. Trade will be managed in alignment with internal framework structure and market delivery behavior.

Nasdaq Short Again (nth time): Fibo Extension Level and 5-wavesOver here, I attempt to short Nasdaq again after another failure yesterday. This time, the 5-waves structure is supported by Fibonacci Extension level at 2.618x sub-wave 1 against entire wave 5 structure.
However, take note the circled area where I pointed out 2 imperfections in the wave structure:
1. Wave 4 overlaps Wave 1
2. Sub-wave 4 overlaps Sub-wave 1 (a comparison with S&P500 increases the odds that it may still be a valid count)
Given the imperfections of the wave counts, we still need to set our stop above the all-time-high to protect ourselves.
Good luck!

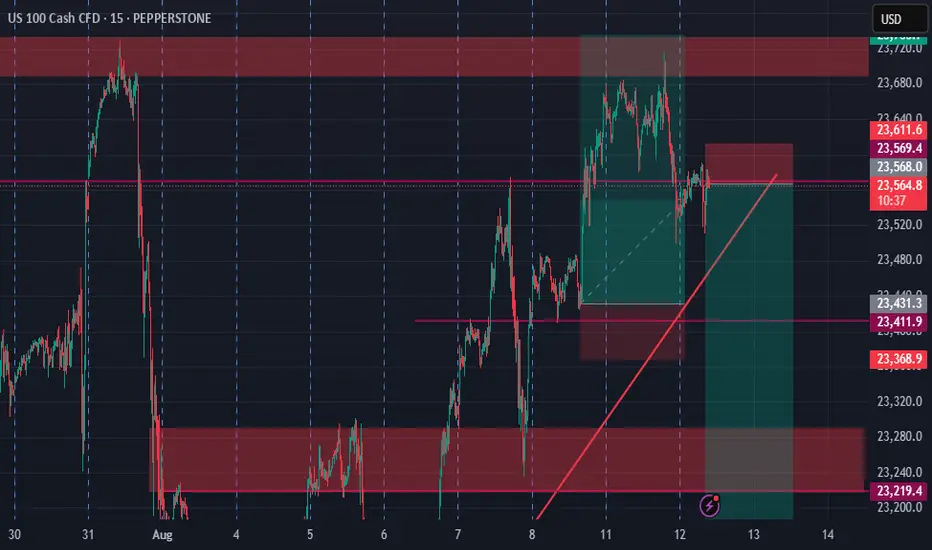
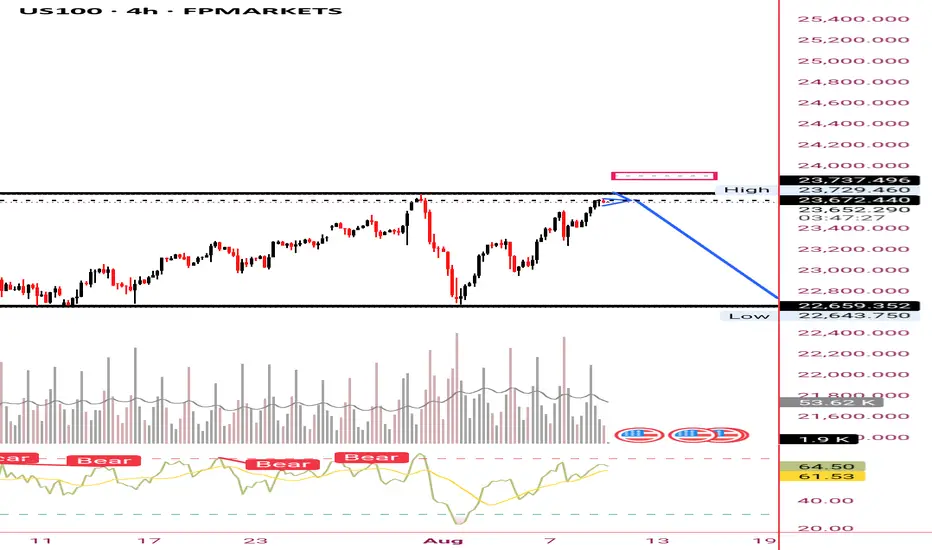
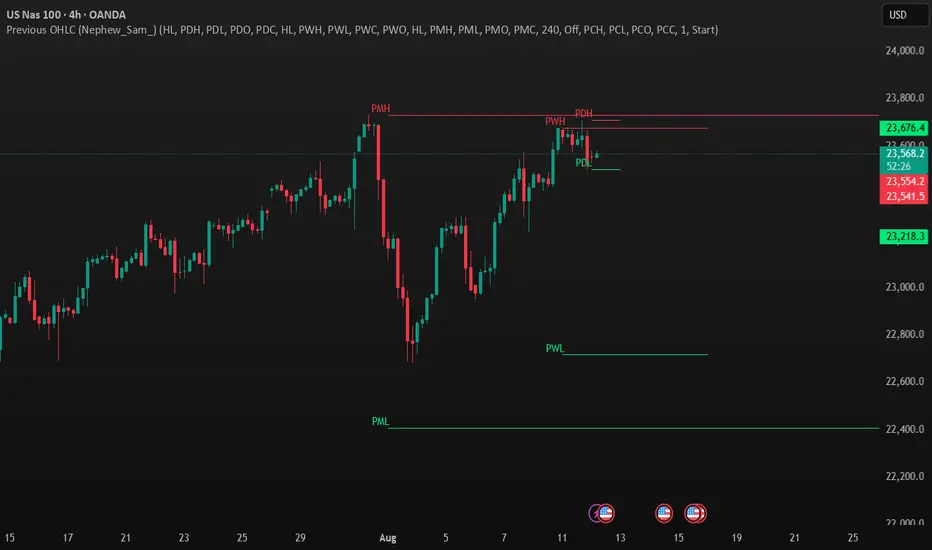
"NAS100USD – Bearish Reversal Setup Forming Below PDH with Key SOn the 4H timeframe of the NAS100USD index, after registering a new high around the **PMH** zone, price faced strong resistance near **PDH** and has recently formed a **Lower High (LH)** and **Lower Low (LL)** pattern. This behavior, along with repeated rejections from the 23670–23710 area, indicates weakening bullish momentum and the potential start of a short-term correction or pullback.
The **PDL** level currently acts as a key short-term support; a confirmed break and close below this level could open the path toward the significant support at **PWL**, followed by the 22940–23218 zone.
From an indicator perspective, decreasing volume near the top, combined with rising volume on recent bearish candles, confirms stronger selling pressure. The overall market structure, after the recent sharp bullish wave, is now in a time–price correction phase that may lead to the breakdown of these supports.
Therefore, if **PDL** is decisively broken, a short entry with a stop-loss above **PDH** and targets in the mentioned zones is the preferred scenario; however, sustained trading back abovEntry: sellstop @ 23,540.00 | Asset=NAS100USD | Side=Sell
SL: 23,676.00
TP1: 23,218.00
TP2: 22,940.00
Conf: 81%
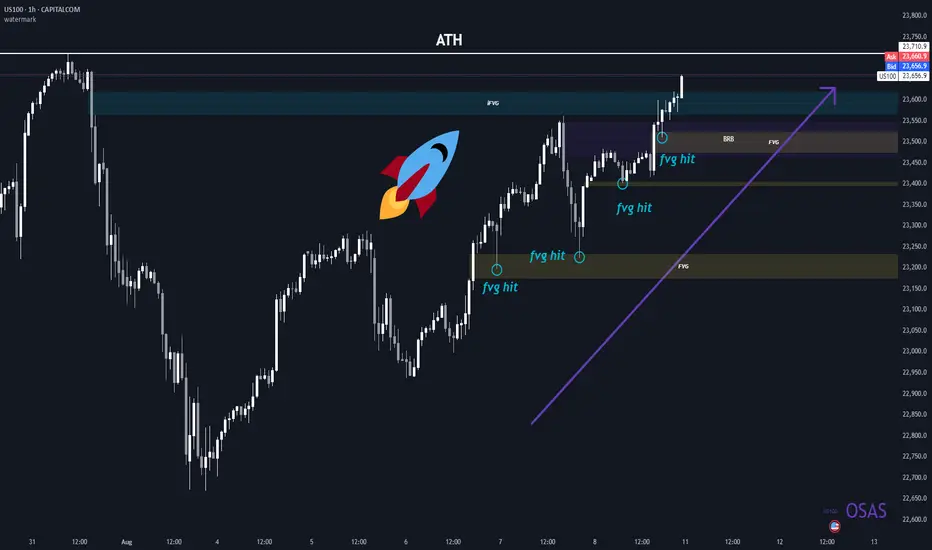
NQ ATHYou can see as clear as possible that we are in an uptrend and we're getting a NEW ATH BABYYYY!!! <3
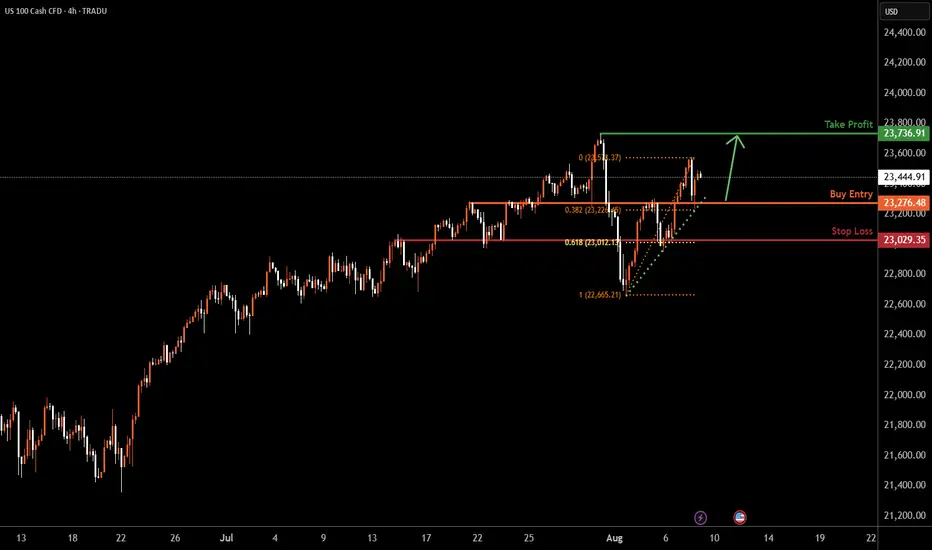
NAS100 H4 | Bullish bounce offUS100 (NAS100) has bounced off the buy entry which is a pullback support that is slightly above the 38.2% Fibonacci retracement and could rise to the take profit.
Buy entry is at 23,276.48, which is a pullback support that is slightly above the 38.2% Fibonacci retracement.
Stop loss is at 23,029.35, which is an overlap support that aligns with he 61.8% Fibonacci retracement.
Take profit is at 23,736.91, which is a swing high resistance.
High Risk Investment Warning
Trading Forex/CFDs on margin carries a high level of risk and may not be suitable for all investors. Leverage can work against you.
Stratos Markets Limited (tradu.com ):
CFDs are complex instruments and come with a high risk of losing money rapidly due to leverage. 65% of retail investor accounts lose money when trading CFDs with this provider. You should consider whether you understand how CFDs work and whether you can afford to take the high risk of losing your money.
Stratos Europe Ltd (tradu.com ):
CFDs are complex instruments and come with a high risk of losing money rapidly due to leverage. 66% of retail investor accounts lose money when trading CFDs with this provider. You should consider whether you understand how CFDs work and whether you can afford to take the high risk of losing your money.
Stratos Global LLC (tradu.com ):
Losses can exceed deposits.
Please be advised that the information presented on TradingView is provided to Tradu (‘Company’, ‘we’) by a third-party provider (‘TFA Global Pte Ltd’). Please be reminded that you are solely responsible for the trading decisions on your account. There is a very high degree of risk involved in trading. Any information and/or content is intended entirely for research, educational and informational purposes only and does not constitute investment or consultation advice or investment strategy. The information is not tailored to the investment needs of any specific person and therefore does not involve a consideration of any of the investment objectives, financial situation or needs of any viewer that may receive it. Kindly also note that past performance is not a reliable indicator of future results. Actual results may differ materially from those anticipated in forward-looking or past performance statements. We assume no liability as to the accuracy or completeness of any of the information and/or content provided herein and the Company cannot be held responsible for any omission, mistake nor for any loss or damage including without limitation to any loss of profit which may arise from reliance on any information supplied by TFA Global Pte Ltd.
The speaker(s) is neither an employee, agent nor representative of Tradu and is therefore acting independently. The opinions given are their own, constitute general market commentary, and do not constitute the opinion or advice of Tradu or any form of personal or investment advice. Tradu neither endorses nor guarantees offerings of third-party speakers, nor is Tradu responsible for the content, veracity or opinions of third-party speakers, presenters or participants.
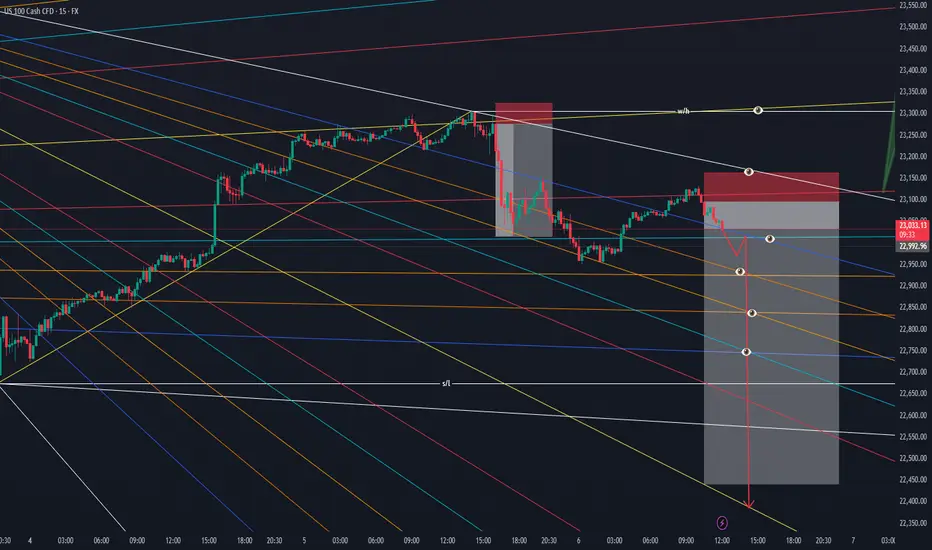
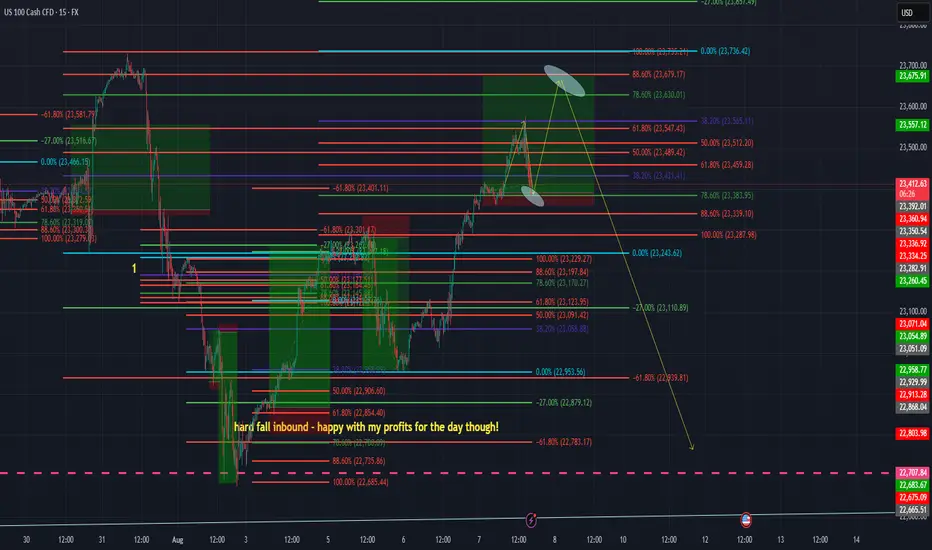
A slight push to the upside - inboundWe're going to see a slight push to the upside, before NASley will do a proper drop for us to a position that has been support for a long time.
I'm of the opinion that she'll break that support, re-test it and then drop even further - motivated by the current political instability within the US and world in general.
Watch this move - It's going to be one for the books!

Technical Analysis of US100 on TradingView A trader is analyzing the US100 (Nasdaq 100 Index) using a 4-hour chart on TradingView. The chart displays a clear upward channel, with price action bouncing off the lower boundary and heading toward the upper trendline. A blue arrow indicates a bullish prediction, anticipating further upward movement. Support and resistance zones are highlighted, and the setup suggests a continuation of the bullish trend.
📊 Chart Overview:
Timeframe: 4-hour (H4)
Instrument: US100 (Nasdaq 100 Index)
Platform: TradingView via Capital.com
Date/Time in Chart: 25th August, 10:00 (likely UTC)
---
📈 Trend Analysis:
The price is moving within an upward parallel channel, indicating a strong bullish trend.
The chart shows multiple touches of both the upper and lower bounds of the channel, confirming its validity.
---
🟩 Support and Resistance:
Support Zone: Around 22,850–23,050 (highlighted by the green rectangular box).
Price bounced sharply from this area, showing buyers are defending it.
Resistance Area (Projected): Upper bound of the channel, which aligns with the 24,000 level.
---
🕊️ Current Market Behavior:
The price recently bounced off the lower channel boundary and the key support zone.
A strong bullish candle broke through a mini pullback area, suggesting momentum is favoring buyers.
The blue arrow indicates an expected continuation upward toward the upper resistance line.
---
📌 Technical Implications:
Bullish Bias: As long as price remains inside the channel and above the support zone, the bullish trend is intact.
A retest of the upper channel line (~24,000) is a realistic target if momentum continues.
Invalidation Level: A clean break below the support zone (~22,850) and out of the channel could shift sentiment to bearish.
---
✅ Possible Trade Idea (for Educational Purposes):
Entry: Around 23,400–23,500 (already in motion)
Target: 23,900–24,000 (upper channel line)
Stop-loss: Below 22,850 (beneath the support zone)
Sell US100US100 Sell idea. This trade setup is based on a bearish flag pattern seen on the 4HR chart. Let us see how price reacts from this resistance.

NSDQ100 rally on rate cuts expectation US equities rallied, with the S&P 500 hitting a new high (+1.13%) after July CPI matched expectations, keeping hopes alive for a September Fed rate cut. Headline CPI was +0.2% MoM / +2.7% YoY, helped by falling gasoline prices, while core CPI rose +0.32% MoM, lifting the YoY rate to 3.1% — the highest core reading in six months. Markets shrugged off the stickier services inflation, focusing instead on the relief that inflation wasn’t hotter. Treasury Secretary Bessent backed the idea of a 50bp cut, further boosting rate-cut bets. Geopolitical headlines — including Putin–Trump summit plans and ongoing Ukraine tensions — were largely ignored by risk assets.
Conclusion for Nasdaq 100 trading
The inflation data reinforced expectations for Fed easing, keeping risk appetite strong and likely supporting further upside in the Nasdaq 100 in the near term. However, the hotter core services figure is a reminder that any sharp rally could face headwinds if upcoming data challenge the rate-cut narrative.
Key Support and Resistance Levels
Resistance Level 1: 23965
Resistance Level 2: 24120
Resistance Level 3: 24290
Support Level 1: 23665
Support Level 2: 23533
Support Level 3: 23422
This communication is for informational purposes only and should not be viewed as any form of recommendation as to a particular course of action or as investment advice. It is not intended as an offer or solicitation for the purchase or sale of any financial instrument or as an official confirmation of any transaction. Opinions, estimates and assumptions expressed herein are made as of the date of this communication and are subject to change without notice. This communication has been prepared based upon information, including market prices, data and other information, believed to be reliable; however, Trade Nation does not warrant its completeness or accuracy. All market prices and market data contained in or attached to this communication are indicative and subject to change without notice.


Nasdaq and S&P500 Short: Completed 5-wave structureIn this video, I explain my analysis of the Nasdaq and S&P 500 chart together with Gold (the risk-off indicator).
I point out 3 main reasons why I labelled the 5-wave structure as W-X-Y-X-Z instead of 1-2-3-4-5:
1. Wave 3 overlaps Wave 1.
2. 5th Wave did not make new peak.
3. Gold structure still supports a 5th Cycle level wave higher.
Regardless of how confident we are, remember to set your stop and respect it.
Good luck!

NASDAQ TP Adjusted for ShortingNow it is very clear that price will likely fall beyond my initial TP. So if you took the trade yesterday hold it for much longer. And don't let CPI intimidate you.
US100 SHORTI see a short on Nas100 ahead of US CPI but we can monitor closely and keep those small positions. THE MARKET MIGHT BE VERY VOLATILE