NDQUSD trade ideas

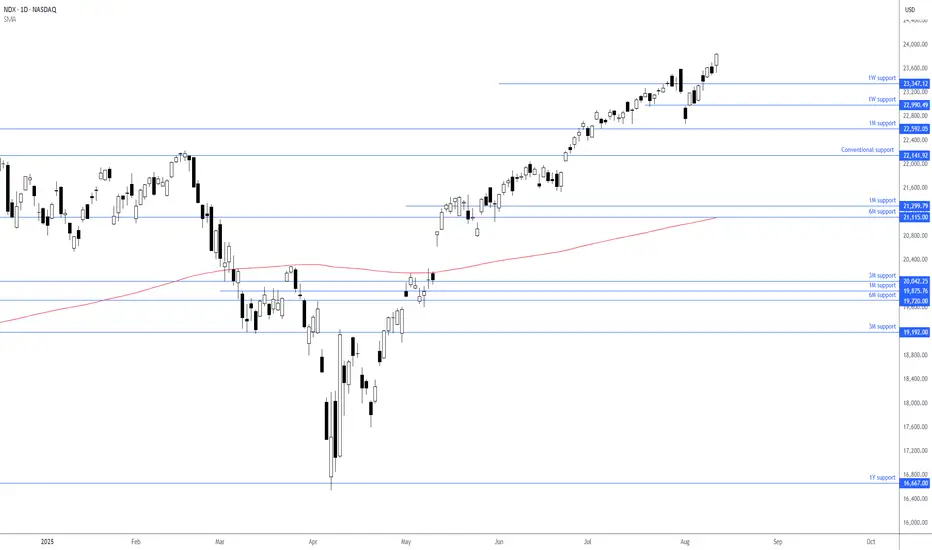
Dip-buying on the Nasdaq?The Stock market rallied following the July US CPI inflation data, with the Nasdaq 100 climbing to an all-time high of 23,849. Overlooking the economic picture for now, price action has exhibited a clear uptrend since early April this year. This is evident from the price, which has chalked up a series of higher highs and higher lows, trading above the 200-day simple moving average at 21,100, and with the dynamic value pointing higher.
Traders seldom attempt to buy at record highs; they tend to buy into retracements from support levels. Therefore, support levels of note right now include 23,347 (1W), 22,990 (1W), and 22,592 (1M).
Written by the FP Markets Research Team

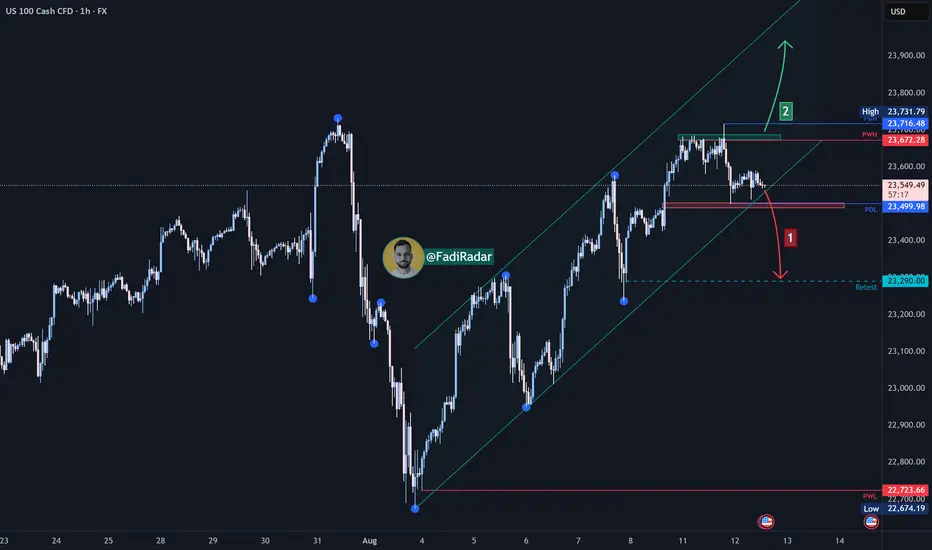
NASDAQ Index Analysis (US100 / NASDAQ)The index is moving within an upward channel in the broader trend and is currently trading near the 23,550 area, which is a pivotal zone between two possible scenarios:
🔻 Bearish Scenario:
If support at 23,500 breaks and holds below this level, we could first see a decline toward 23,400, followed by a potential drop to the 23,290 test zone.
Breaking this level may open the door for further downside corrections.
🔺 Bullish Scenario:
If the price successfully breaks and holds above 23,680, this could support a continued rally toward 23,800, and with sustained momentum, the market may target a new high.
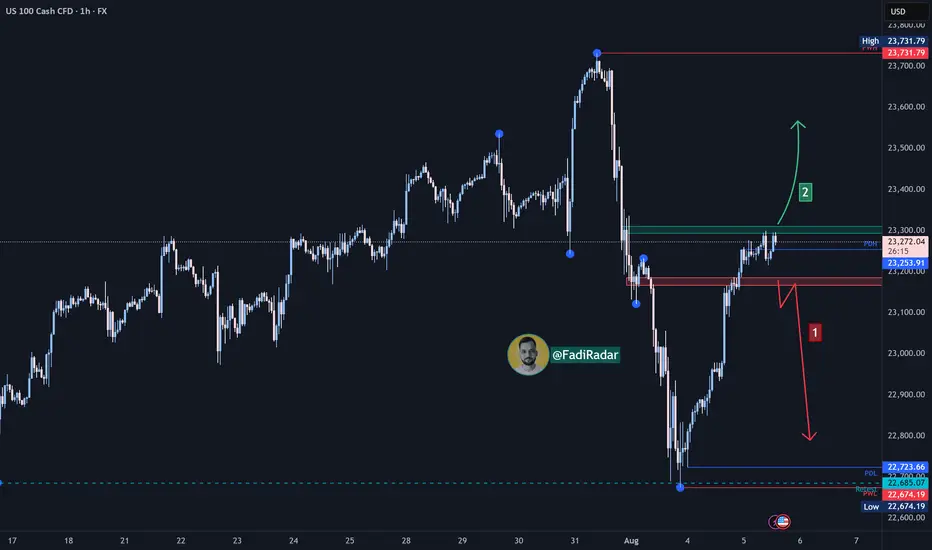
US100 Local Short!
HI,Traders !
#US100 made a retest
Of the horizontal resistance
Of 23266.0 and we are already
Seeing a bearish reaction and
We will be expecting a further
Bearish move down !
Comment and subscribe to help us grow !

Potential Shorts for NAS100After Last weeks NFP, price displaced very strongly to the downside. I would be considering shorts at the Daily CISD, which price is approaching rapidly.

Nasdaq 100 Analysis: Index Rebounds After Friday’s DeclineNasdaq 100 Analysis: Index Rebounds After Friday’s Decline
The release of disappointing US labour market data on Friday unsettled both stock market participants and the President of the United States:
→ Donald Trump promptly dismissed Erica McEntarfer, Commissioner of the Bureau of Labor Statistics, accusing her of falsifying employment data.
→ Stock indices accelerated their decline, with the Nasdaq 100 Index falling below its 16 June low.
However, US stock indices staged a strong recovery on Monday. According to Reuters, yesterday marked the largest daily percentage gain since 27 May.
Why Did Stock Indices Rise?
Possible reasons include:
→ Buyers were attracted by the falling share prices of companies that, for the most part, had delivered strong quarterly earnings;
→ Market participants are betting on a potential rate cut by the Federal Reserve in September (a move strongly advocated by Trump), which could support both the economy and the stock market.
Technical Analysis of the Nasdaq 100 Chart
In our earlier analysis of the Nasdaq 100 Index, we:
→ Identified a primary ascending channel (marked in blue);
→ Highlighted that the price had risen above the upper boundary of the channel (a sign of excessive optimism);
→ Anticipated a potential correction towards the 23,020 level.
However, the correction turned out to be more substantial than initially expected.
As a result of the price movements on Friday and Monday:
→ The blue channel was widened twofold;
→ The price found support at its new lower boundary and reversed upwards;
→ As of today, the Nasdaq 100 index is trading near the median line.
This can be interpreted as the market aggressively digesting recent corporate earnings reports and the prospects of a rate cut in light of a deteriorating labour market. Demand and supply may reach a new equilibrium, potentially leading to a consolidation phase around the median of the widened channel.
It is also possible that the area marked in orange—where the price previously rallied strongly, indicating a buyer-driven imbalance—may now act as support. Resistance levels might include:
→ Former support at 23,320;
→ 23,440 – the level at which bears broke through the purple channel.
This article represents the opinion of the Companies operating under the FXOpen brand only. It is not to be construed as an offer, solicitation, or recommendation with respect to products and services provided by the Companies operating under the FXOpen brand, nor is it to be considered financial advice.
NAS100 Trade Idea: Liquidity Sweep & Bullish Reversal Potential📊 NASDAQ 100 (NAS100) Trade Outlook 📈
The NASDAQ 100 is holding a strong bullish trend on the higher timeframes 🟢. However, we’re currently seeing a notable pullback into a key support zone ⚠️ — price has dipped beneath previous lows, tapping into what appears to be an institutional accumulation range 🏦.
This move is likely targeting the liquidity resting below those lows 💧, where sell stops are positioned. Price is also reacting off a significant bullish order block 🧱 — a confluence area that could produce a strong reversal.
🎯 What to look for next:
Wait for a bullish break in market structure 🔁 to confirm a potential entry. If that occurs, consider a long setup with your stop loss below the swing low 🛑 and a 1:2 risk-to-reward target 🎯.
🚫 This is for educational purposes only and not financial advice.

NASDAQ technical analyse.📉 NAS100 Technical Analysis – Potential Reversal Zone Identified (4H Chart)
Price has seen a strong bearish move, breaking through multiple support levels. Currently, it is approaching a key demand zone between 22,600 – 22,420, which previously acted as strong support in early July.
I'm watching two potential scenarios from this level:
🔹 Scenario A (Blue Path): A bullish reversal from the current zone, targeting the 23,400 area. This would require confirmation with bullish candlestick patterns or momentum divergence.
🔸 Scenario B (Red Path): A deeper dip into the demand zone (towards 22,420), followed by a stronger bounce. This could offer a better risk-to-reward long entry if bullish structure forms.
🔻 Invalid if price closes decisively below 22,400, breaking structure and invalidating the reversal setup.
Let me know your thoughts. Are you going long or still waiting for confirmation?

Is the NASDAQ Vault Open for a Full Bullish Heist?🧠 NASDAQ Heist Masterplan: Thieves Eye on 24,500 🎯💰
🚨 Asset: NASDAQ100 / US100 / NDX
📊 Plan: Bullish | 🔁 Layering Strategy
🎯 Target: 24,500
🛑 Stop Loss: 22,600
📍 Entry: Any level – the vault’s wide open!
💼 Thief Trader's NASDAQ High-Stakes Robbery Is LIVE! 🤑📈
Welcome, money bandits & market looters! 💼💰
The time has come to launch a full-scale bullish raid on the NASDAQ fortress. We’re not just taking entries — we’re stacking them like a pro with our layered limit order strategy across swing zones. 🔫📉➡️📈
🔓 Entry:
Pick any price! We break in anytime, anywhere.
🔁 Stack your buy limits on 15m–30m swing lows.
🔔 Set your alerts – don’t let the opportunity slip.
🛑 Stop Loss:
Guard your loot at 22,600.
Risk management is the bulletproof vest in this raid. 🎯
Adjust your SL based on lot size and order volume. 📏🔐
🎯 Profit Target:
Thieves retreat at 24,500.
But hey – smart robbers use trailing SL to squeeze every last drop of gold! 🏆💸
💡 Scalpers & Swingers:
Stick to the long side only.
If your pockets are deep – full-send mode ON.
If not, tag along with swing entries. Patience pays big! 💎⏳
📢 Heads Up, Heist Crew:
News drops = landmines. Step carefully.
🚷 No new entries during major announcements.
🛡️ Use trailing SL to defend your profit bags.
🚨 Daily Reminder:
This market isn’t a playground. It’s a battlefield.
Use COT data, macro reports, sentiment scans, and index-specific triggers to fortify your robbery blueprint. Stay smart, stay updated! 📊🧠
💥 Boost Our Loot Crew 💥
Hit that LIKE ❤️ to support the Thief Army!
Stronger visibility = Bigger Loots = More Victory Runs.
See you at the next robbery – we move in silence, but the market hears us loud! 🐱👤💸🔥🚀

NASDAQ: Bears In Control! Sell it!Welcome back to the Weekly Forex Forecast for the week of Aug 4 - 8th.
In this video, we will analyze the following FX market:
NASDAQ (NQ1!) NAS100
The NAS 100 was weakened by bad job numbers, mixed earnings reports, and tariff wars. In the short term, it is bearish. Sell it down to the Weekly/daily +FVG for high probability buys from those levels.
Buying at current levels is not advised. Wait for a valid market structure shift to the upside before going long.
Enjoy!
May profits be upon you.
Leave any questions or comments in the comment section.
I appreciate any feedback from my viewers!
Like and/or subscribe if you want more accurate analysis.
Thank you so much!
Disclaimer:
I do not provide personal investment advice and I am not a qualified licensed investment advisor.
All information found here, including any ideas, opinions, views, predictions, forecasts, commentaries, suggestions, expressed or implied herein, are for informational, entertainment or educational purposes only and should not be construed as personal investment advice. While the information provided is believed to be accurate, it may include errors or inaccuracies.
I will not and cannot be held liable for any actions you take as a result of anything you read here.
Conduct your own due diligence, or consult a licensed financial advisor or broker before making any and all investment decisions. Any investments, trades, speculations, or decisions made on the basis of any information found on this channel, expressed or implied herein, are committed at your own risk, financial or otherwise.

Nasdaq: End of Bullish Wave, 10%+ Downside in Sight?Hey Realistic Traders!
Has CAPITALCOM:US100 (Nasdaq) Finally Peaked? A Reversal Signal Just Flashed. Is This the Turning Point Toward a Deeper Pullback?
Let’s dive into the technicals to see what the chart is really telling us.
Technical Analysis
On the daily chart, the Nasdaq is starting to show signs of weakness. A bearish divergence has formed between the MACD and price movement , which is a classic signal that bullish momentum may be fading. This often indicates the potential for a trend reversal or a deeper correction.
A recent drop, confirmed by a strong bearish full-body candlestick, suggests that selling pressure is increasing. If this continues, we expect a breakdown from the current bullish channel.
In this scenario, the extended Wave 3 may have reached its peak. A correction could follow, with the first target at 21484, which lines up with the 0.382 Fibonacci retracement level. If the decline continues, the next downside target would be around 20067, where a previous gap may be filled.
This bearish outlook remains valid as long as the price stays below 23800 . A move above that level would invalidate the setup and return the outlook to neutral.
Support the channel by engaging with the content, using the rocket button, and sharing your opinions in the comments below.
Disclaimer: "Please note that this analysis is solely for educational purposes and should not be considered a recommendation to take a long or short position on Nasdaq.


NAS100: Bullish Reversal from Key Support ZoneFirstly, our Algo-based indicators are used to create this analysis:
This 1-hour chart for NAS100 highlights a strong bullish reversal from a critical support level, suggesting a potential move back towards recent highs.
Analysis:
Support Bounce: The index experienced a sharp sell-off but found significant buying pressure within a key support zone marked between 22,677 and 22,829. This area, labeled "LSQB" (Liquidity Sweep Order Block) and including the "Daily Open," acted as a strong floor, triggering a V-shaped recovery.
Momentum Shift: The oscillator at the bottom of the chart confirms this shift in momentum. After dipping into the oversold "BUY" zone, the indicator has sharply reversed and is trending upwards with conviction, as indicated by the projected black arrow. This suggests that buyers have taken control in the short term.
Moving Averages: The price has decisively reclaimed the EMA 200 (the main green line), a key indicator often used to gauge the longer-term trend on a given timeframe. Holding above this level is a strong bullish sign.
Price Projection: The drawn black line illustrates the expected price path—a continued rally from the current level back towards the red resistance zone near the recent high of approximately 23,700.
Strategy:
Position: Long (Buy)
Entry: The bounce from the support zone has already been confirmed. Current levels could be seen as an entry, or traders might look for a minor pullback that holds above the EMA 200.
Target: The primary target is the red resistance zone around the 23,700 level.
Conclusion:
With the price reacting strongly to a key liquidity zone and momentum indicators confirming a bullish reversal, the path of least resistance for NAS100 appears to be upwards. The immediate target for this recovery is the recent high near 23,700.
Disclaimer: This analysis is for educational purposes only and should not be considered financial advice. Always conduct your own research and manage risk appropriately.

NAS100 Slammed by Fed Data and Trump Trade Remarks Can 22,640 ?The NAS100 plunged after strong US economic data fueled expectations of tighter Fed policy, and Trump's renewed push for aggressive trade deals rattled tech sentiment. After rejecting the 23,665 🔼 resistance, the index dropped sharply through multiple support levels.
Price is now consolidating just above the 22,640 🔽 zone, a key near-term support.
Support: 22,800 🔽, 22,640 🔽, 22,500 🔽
Resistance: 23,025 🔼, 23,277 🔼, 23,332 🔼
Bias:
🔽 Bearish: A breakdown below 22,640 could trigger a move toward 22,500. If that fails, 22,400 becomes the next target.
🔼 Bullish: A reclaim of 23,025 would be the first sign of bullish recovery.
📛 Disclaimer: This is not financial advice. Trade at your own risk.

Nasdaq Index (US100 / NASDAQ) Technical Analysis:The Nasdaq Index showed improvement at the market open today and is currently trading near the $23,300 level, with price action building at a key resistance zone.
🔹 Bearish Scenario:
If the price retraces to $23,170 and breaks below it, a move toward $22,970 could follow as the next support target.
🔹 Bullish Scenario:
If the price breaks above $23,300 and holds, bullish momentum could drive the index toward $23,600.
⚠️ Disclaimer:
This analysis is not financial advice. It is recommended to monitor the markets and carefully analyze the data before making any investment decisions.
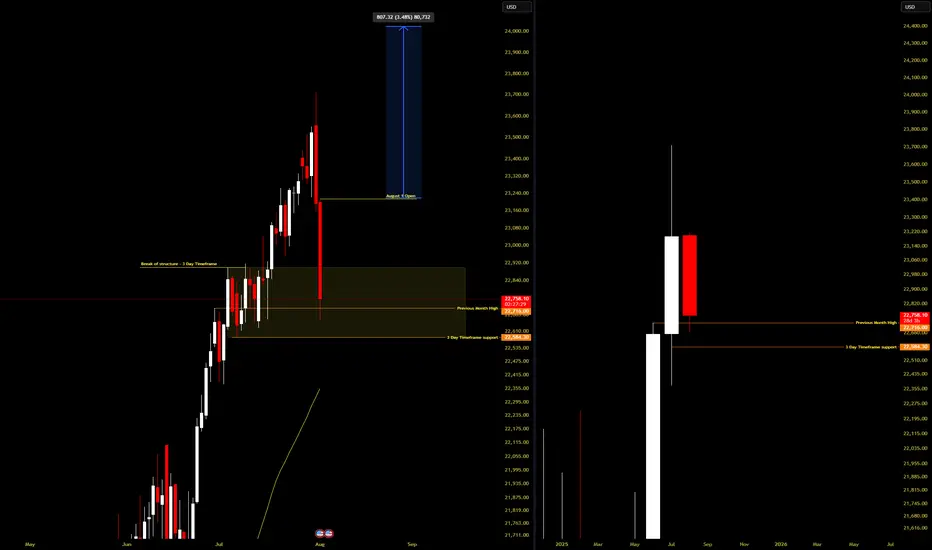
SWING TRADE NASDAQIs this another case of Trump moving the markets so his buddies can get better entries? 👀
Not saying anything... but July candles were way too friendly in that yellow box. Institutions were loading up like it was Black Friday.
I jumped in too—snagged a clean 10RR 😎📈
Now, with seasonality (August 3.5% average past 10 years) + Commitment of traders data backing me up( July COT is heavy longs), I’m risking light for a tiny 27RR setup.
Will it work? No clue.
Will I be dramatic about it? Absolutely. 🎭📉📈
NASDAQNASDAQ is showing strength as price reacts from a key weekly support zone, aligning with the latest COT report indicating increased institutional long positions. This confluence supports a continued bullish outlook.

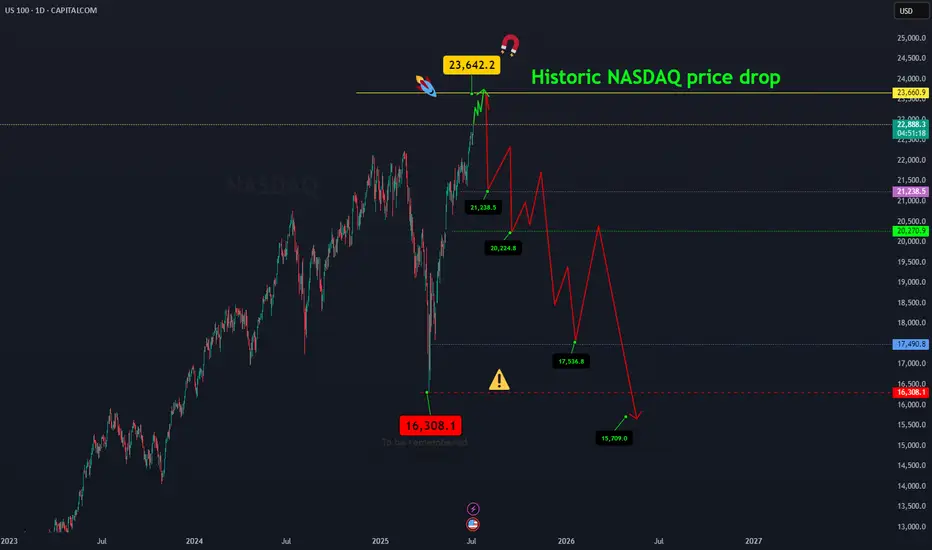
NASDAQ price dropAfter the Nasdaq price reaches around 23642.2, a historic drop will occur and the target is to drop to 16308.
Whatever happens at the highest price, the final destination is towards 16308.
I have identified the price levels in the middle of this expected drop that can cause the price to correct.
IG:NASDAQ
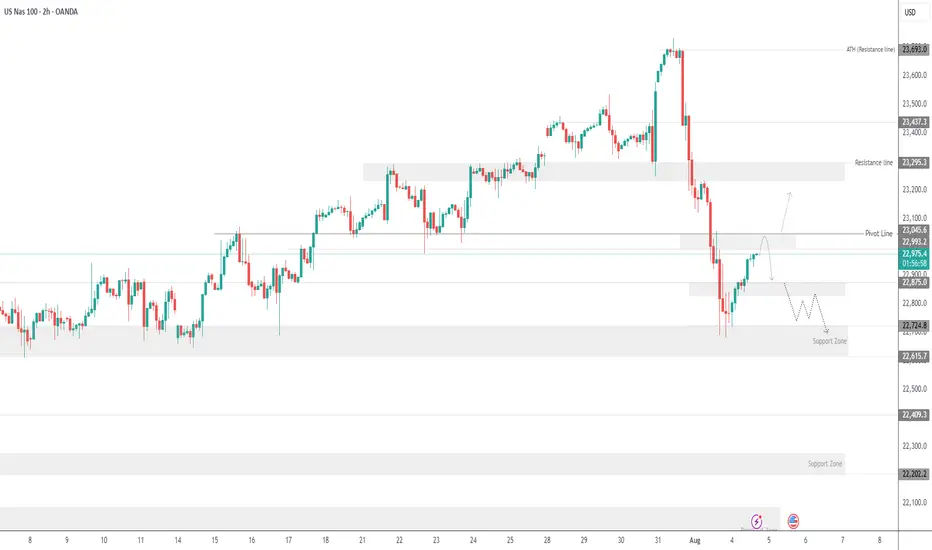
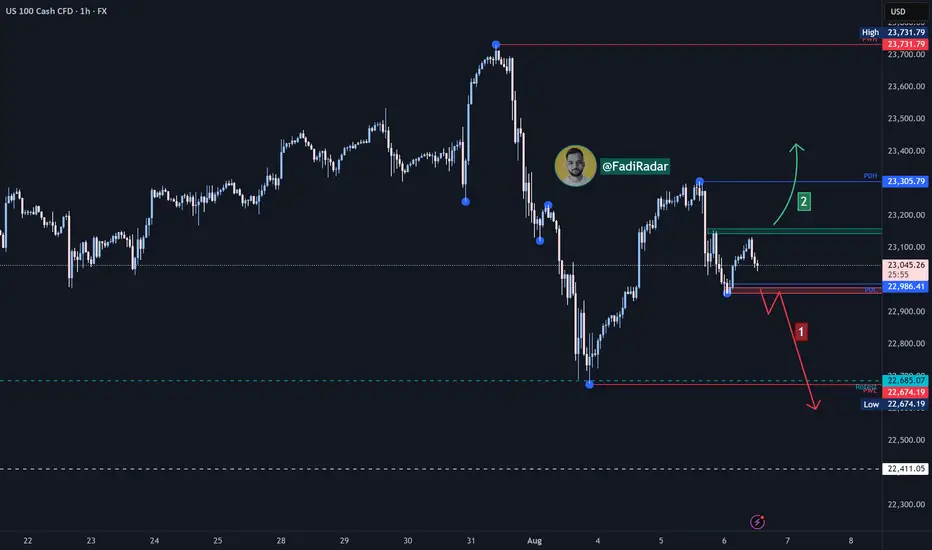
USNAS100 Holds Bearish Below 23045USNAS100 – Overview
The index maintains a bearish momentum as long as it trades below the pivot zone between 22990 and 23045.
To confirm a bullish reversal, the price must break above 23045 and close a 1H candle above it.
On the downside, a break below 22875 would reinforce bearish pressure, opening the path toward the next support at 22720.
Support: 22875 • 22720
Resistance: 23150 • 23295
Bias:
🔻 Bearish below 23045
🔺 Bullish only with a confirmed 1H close above 23045
Nasdaq Index Analysis (US100 / NASDAQ):The Nasdaq index saw a slight improvement with today’s market open and is currently trading near 23,000 USD. The short-term trend remains bearish.
1️⃣ A break and close below 22,960 USD may push the price toward 22,670 USD as an initial target.
📉 Holding below that level could open the path to 22,400 USD.
2️⃣ However, if strong buying momentum leads to a break above 23,160 USD and price holds, we could see a move toward 23,300 USD, followed by 23,600 USD.
⚠️ Disclaimer:
This analysis is not financial advice. It is recommended to monitor the markets and carefully analyze the data before making any investment decisions.
US100 reacts at pullback resistance US100 price reacts nicely at a pullback resistance with a strong rejection which supports the idea of selling from the current price. Therefore, a sell opportunity is envisaged from the current market price.
