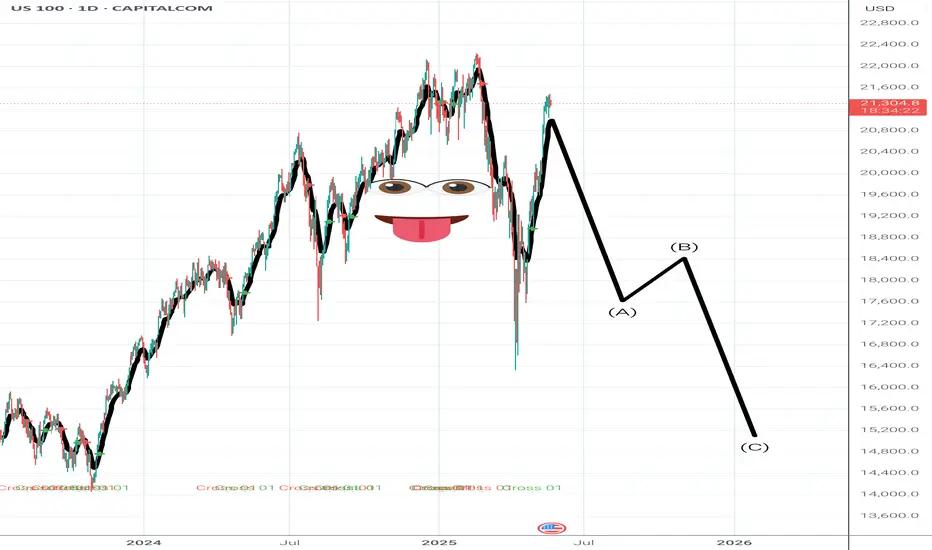
Going short on the Nasdaq 100CAPITALCOM:US100
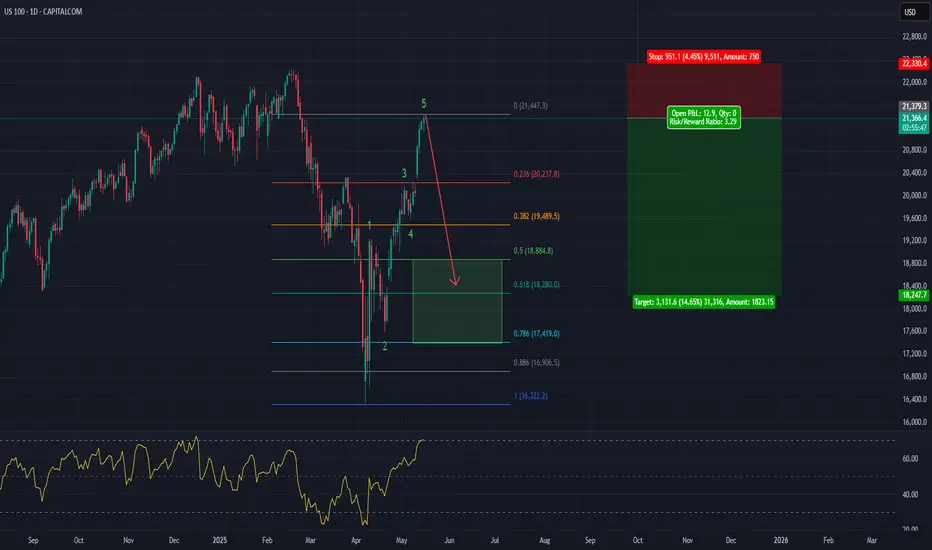
The Nasdaq 100 has moved up impulsively on a 5-wave move over the past 6 weeks, which is very bullish long term. However, in the short term, it is overextended, with the RSI indicator over the 70 level.
I expect it to decline over the next couple of weeks to the area marked in the green rectangle, between the 50% and the 78.6% Fibonacci Retracement level.
I hope you find this interesting.
Good luck to you
NDQUSD trade ideas

Nas100Nas100 1H Analysis
• Peak Formation 1 = Start of the peak reversal cycle (Level 3 confirmed)
• Peak Formation High (PFH) or Low (PFL) = Price has likely reached the extreme zone and is reversing.
So, when you see:
• An M pattern on your chart
• And Peak Formation 1 on DashFix
It means:
The system has recognized a Level 3 stop hunt and shift, and it’s now marking this area as the potential high of the week (start of reversal cycle).
This is your confirmation zone that:
• The market has likely hit a weekly top
• It’s safe to look for short setups (after confirmation)
• It’s too risky to buy unless proven otherwise
⸻
3. What You Should Do (Execution Plan)
If you see M + Peak Formation 1:
Wait for:
• M pattern completion (two peaks, often 2–3 candles apart)
• 5 EMA & 13 EMA cross down on your entry time frame (M5 or M15)
• TDI confirmation (green crossing red downward near overbought)
• Price breaking the neckline of the M
Enter trade:
• Sell after confirmation (engulfing/rejection candle at M peak)
• Place stop loss above the high (trap candle or second leg)
• Target: 50–100 pips depending on ADR or prior support zones
⸻
4. Extra Tips
• Peak Formation 1 usually appears after New York session fakeouts or early Tuesday/Wednesday
• Avoid entering early during consolidation or inside the Asian range
Nasdaq Level 3 Behavior MAAWKey Trapping Techniques
• False Breakouts (above M or below W pattern)
• Session Open Spikes (especially NY open or London open)
• News Traps (spike during news, then reversal after)
⸻
3. TIMING: WHEN TO EXPECT LEVEL 3 MOVES
Look for session overlap (London/NY) — that’s often where the Level 3 “move away” happens.
⸻
4. WHAT TO LOOK FOR
Here’s your sniper checklist:
Before Entry
• Clear M or W pattern (preferably over 3 sessions)
• 3 levels or signs of MM cycle (Level 1, 2 already done)
• Price at ADR High/Low
• EMA Alignment (5/13 cross for confirmation)
• TDI Confirmation (green cross red, volatility band bounce)
• High Volume Candle showing shift
• Price is not at mid-range, but at extremes
⸻
5. WHAT TO AVOID
• Entering during consolidation
• Trading Level 1 (accumulation = trap zone)
• Trading directly at news time (wait for spike/reaction)
• Ignoring ADR (if ADR is already complete, expect reversal)
• Entering too early before confirmation candle
• Big stop losses — you want sniper entries with tight stops
Step 1: Mark the Previous Day’s High/Low
• Use ADR to mark extremes
• Expect stop hunt near these levels
Step 2: Identify M/W Forming
• Look for 3 peaks/bottoms
• Wait for the final push and reversal
Step 3: Watch Session Opens
• London/NY open is often the trigger zone
• Observe price action closely 15–30 mins after open
Step 4: Wait for Confirmation
• Engulfing / Pin bar / Rejection candle
• 5 & 13 EMA cross
• TDI green crossing red & bouncing off band or base
• Align with 800 EMA and 50 EMA direction
Step 5: Enter the Trade
• Enter at or near confirmation candle close
• Stop loss: Just outside the trap wick (10–20 pips)
• Take profit: 1:3 or ride with trailing stop
⸻
7. BONUS: HIDDEN TRICKS
• Draw M/Ws on the 5M but validate them on the 15M
• Use the 800 EMA to see where the overall bias is
• Mark the 1st leg of M/W — wait for trap above/below
• Timing matters more than signals — don’t force entries outside session windows
Disclaimer:
This idea is for educational and informational purposes only. It is not financial advice or an investment recommendation. I do not offer any financial services or paid mentorship. Always do your own research before making trading decisions.
NASDAQ - SHORT SELL - AMAZING DOUBLE TOP PATTERN - REVERSAL patNASDAQ ; after forming series of HH and HLs is seem to be in distribution phase, we can see Divergence on RSI followed by Double TOP pattern which is a strong confluence for Reversal Pattern
we have a trade plan with our entry , once the accumulation phase (strong support) is broken as mentioned as ENTRY POINT (Sell Stop order) once our order is triggered we can place STOP loss above HL (or Resistance level) -
Our TPs would be TP1 with a Risk to Reward Ration 1:1 and other TP2 with R:R 1:2.
HAPPY TRADING GUYZ !!!!
"Better Trade your psychology and emotions, you will always be profitable"
Regards,
PROTRADEPROFESSOR

NASDAQ US100 - LONG IDEAThe next upward movement seems close, the upward trend line remains intact and we should have a breakout soon after days of accumulation.
BUY ZONE: 21.200 - 21.300
TAKE PROFIT 1: 21.750
TAKE PROFIT 2: 22.500
STOP LOSS: 20.990

US100 expectation 1HMarket seems bit funny, due its consistent respect of the channel, then a sudden break in that structure happened. If this is a false break out, it can go back to a buy. If not, its a sell till the bounce back into a buy off support. Monitor it for confirmations for either.

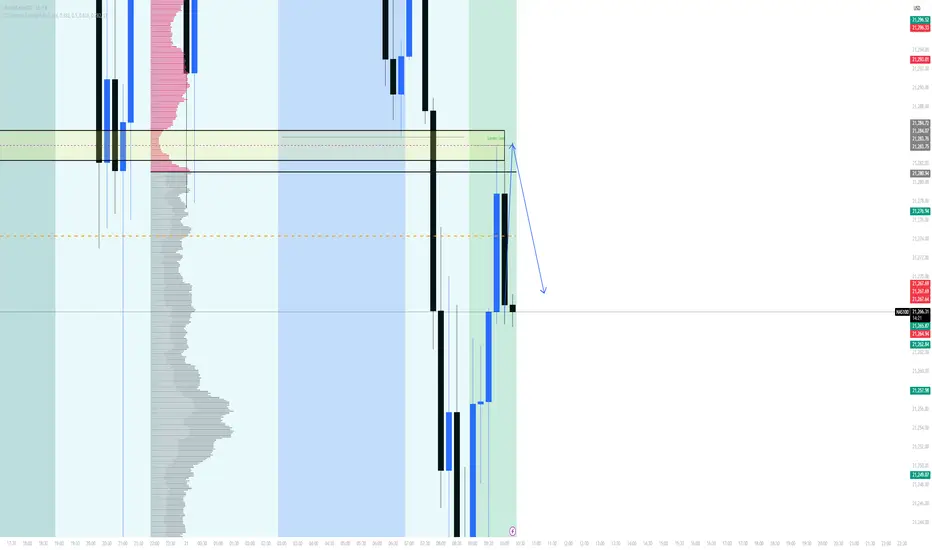
Hanzo / Gold 15m Path ( Confirmed Breakout Zones )Nas100
Bias: Waiting For Break Out
Time Frame: 15 Min
Entry Type: Confirmed Entry After Break Out
👌Bearish After Break Out Done : 21200
☄️ Hanzo Protocol: Dual-Direction Entry Intel
➕ Zone Activated: Strategic Reaction from Refined Liquidity Layer
Marked volatility from a high-precision supply/demand zone. System detects potential for both long and short operations.
🩸 Momentum Signature Detected:
Displacement candle confirms directional intent — AI pattern scan active.
— If upward: Bullish momentum burst.
— If downward: Aggressive bearish rejection.

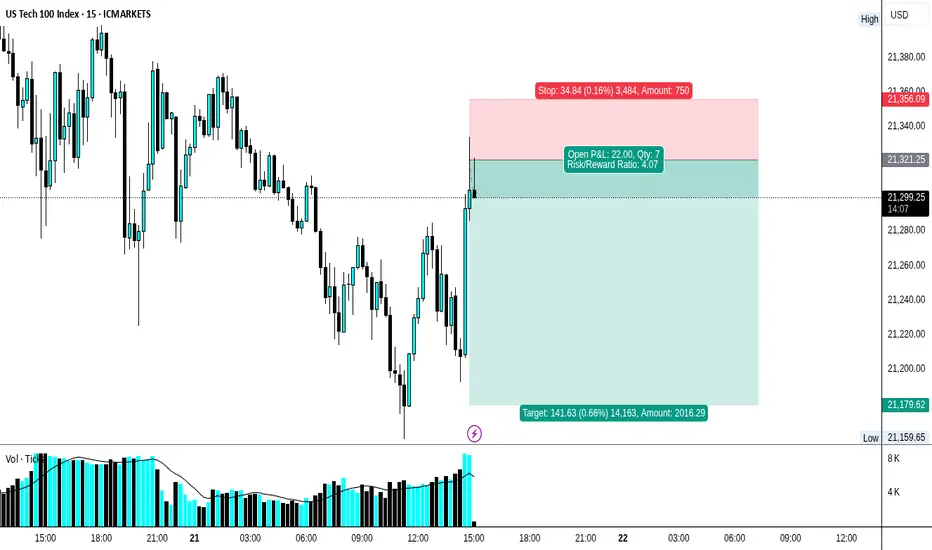
Nas Short with SMC and Pinex Capital📝 Short scalp with SMC zone - trade idea
In this setup, a quick short scalp was realised based on a prominent SMC supply zone. After an impulsive sell-off, the price returned to an unmitigated supply zone, indicating a possible reaction of institutional orders.
As soon as the price entered the zone and showed signs of weakness (e.g. wicks, smaller candles, BOS at lower TF), the entry was made. The stop loss was set just above the zone, the target was at the next liquidity accumulation or the last break-of-structure low.
pinexcapital.com
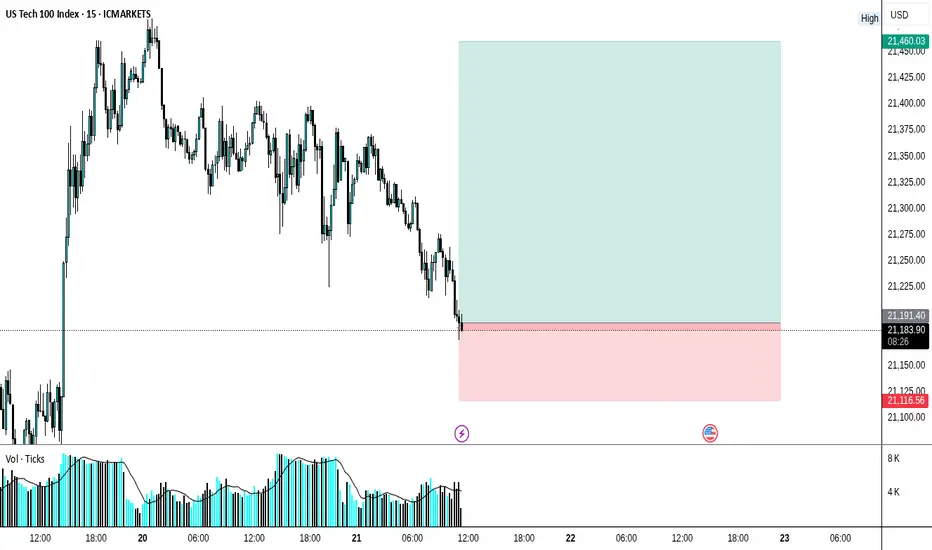
NAS100 BUY NOW!!!!!!NAS100 formed a falling wedge pattern on the 15min and price made a strong rejections off the sellside and have sweep liquidity am holding till price takes out the buyside for a breakouts and rally back up 21,480 is my target
JOIN AND ENJOY

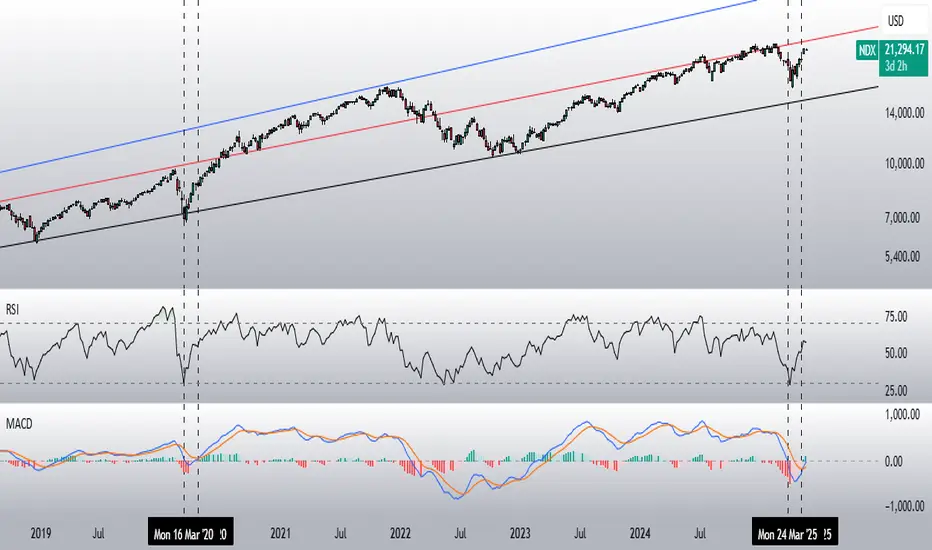
Did the Black Swan prophets take note?The stock market crash of March/April 2025 looks almost like an exact replica of the COVID crash.
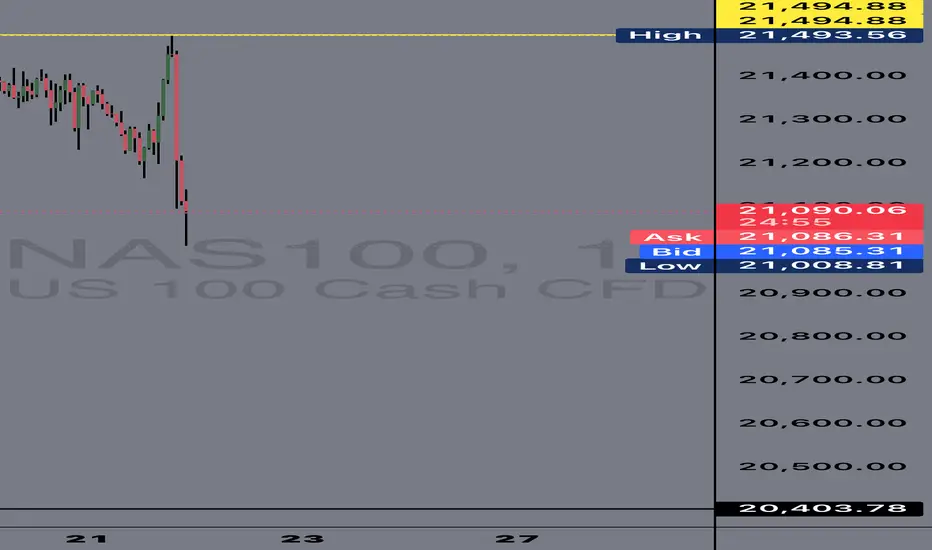
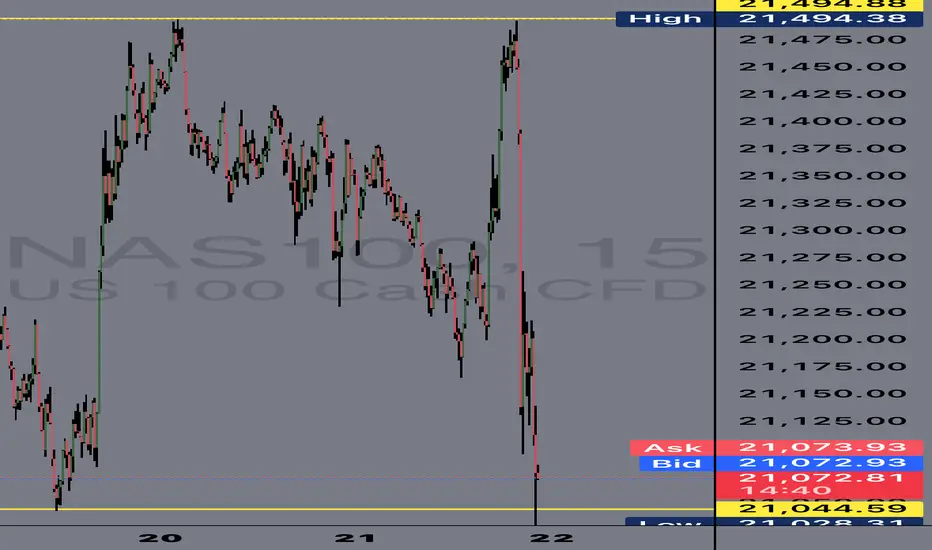
A Look at Nasdaq Buyers around the $21.5k .Looks like Nasdaq buyers took a breather at the $21.5k level. Time to watch if the market flutters back up like a butterfly or dives deeper. 🦋📉

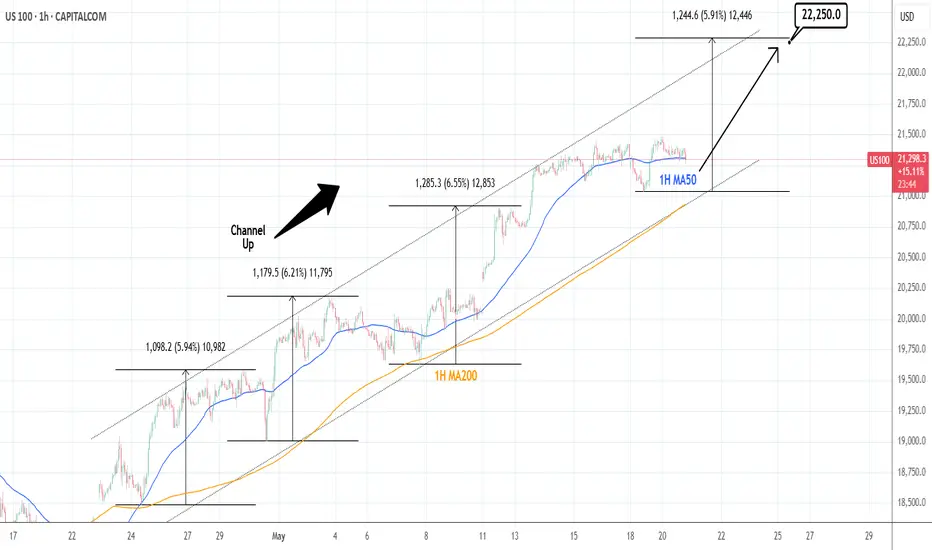
NASDAQ: Channel Up to soon initate the new bullish wave.Nasdaq is bullish on its 1D technical outlook (RSI = 67.876, MACD = 566.960, ADX = 50.516) as it is still holding the Channel Up of almost 1 month back, whose support is the 1H MA200. Right now the price is consolidating around the 1H MA50, approaching the bottom of the pattern. Once it does, we expect it to initate the new bullish wave. With the shortest one of the Channel Up being +5.90%, we remain bullish here and look towards a TP = 22,250 by early next week.
## If you like our free content follow our profile to get more daily ideas. ##
## Comments and likes are greatly appreciated. ##