US100 makes a slight drop from ATH!Price dropped from the all time high of 23,703 we’re beginning to see a pullback in price. We’d be monitoring a time price will shift from intraday bearish to bullish. This is to help us position ourselves for a buy opportunity.
NDQUSD trade ideas

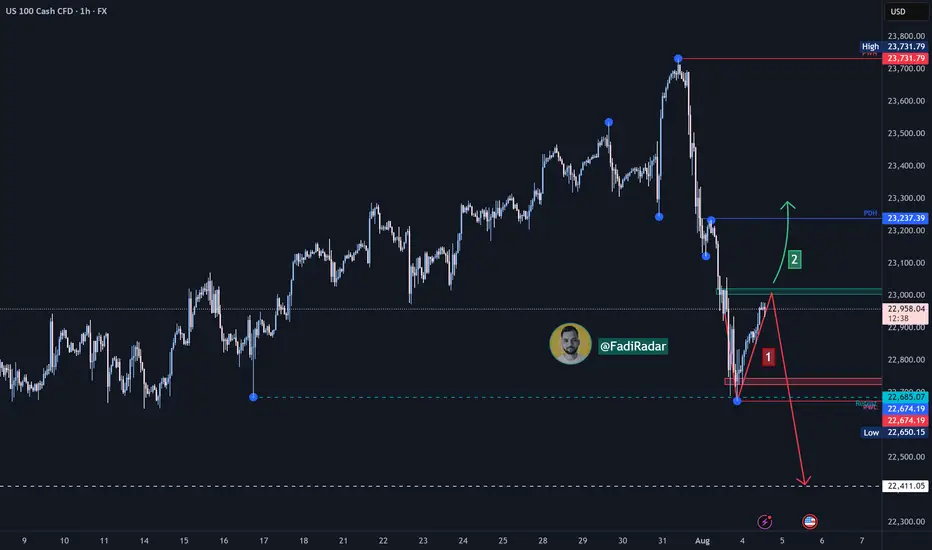
Short NAS100Elite analysis
Short entered in lower time frames
Executed at market open
Targeting lower liquidity pools
US100The US100, also known as the Nasdaq 100 Index, tracks the performance of the 100 largest non-financial companies listed on the Nasdaq Stock Exchange, primarily in the technology, consumer services, and healthcare sectors. It is a market-capitalization-weighted index and includes major corporations such as Apple, Microsoft, Amazon, NVIDIA, Meta, and Alphabet. As a tech-heavy index, the US100 is highly sensitive to changes in interest rates, innovation cycles, investor sentiment, and macroeconomic indicators, especially those related to inflation, employment, and monetary policy.
Over the past two decades, the Nasdaq 100 has experienced strong long-term growth, driven by the expansion of the digital economy, cloud computing, artificial intelligence, and e-commerce. After a steep correction in 2022 caused by inflation concerns and aggressive rate hikes by the Federal Reserve, the index rebounded in 2023 and 2024, supported by improving macroeconomic conditions, a stabilization in interest rates, and renewed investor confidence in tech and growth stocks. AI-driven investments, semiconductor breakthroughs, and tech-led productivity gains have further fueled its momentum.
As of August 2025, the US100 is trading at 22,747, marking a new historical high. This reflects strong earnings performance from major tech companies, continued innovation in AI and automation, and a more dovish outlook from the Federal Reserve, which has helped reduce pressure on growth equities. Despite its gains, the index remains vulnerable to volatility stemming from inflation surprises, geopolitical risks, and shifts in central bank policy. The Nasdaq 100 continues to be a key benchmark for growth-oriented investors and a barometer for the health of the global tech sector.

Nasdaq US100 Wave 3 Expansion Toward 31,606 in PlayNasdaq US100 has completed a significant wave cycle with a confirmed wave 1 in the broader Elliott Wave structure. Following this, price underwent a corrective wave 2 that extended from the $22,237 supply zone down to $16,334, marking the conclusion of the previous cycle’s correction. This structure now signals the initiation of a fresh upward impulse, setting the stage for a powerful wave 3 advance.
The emergence of wave 3 will gain full confirmation once price successfully breaks above the external supply zone, reclaiming $22,237. If this breakout occurs with sustained momentum, the wave 3 projection targets an expansion toward $31,606, which aligns with the 161.8% Fibonacci extension from the prior cycle. This forthcoming rally is anticipated to unfold in a five-subwave format, indicative of a high-momentum bullish leg.
As long as price action remains above the key support at $16,334, the bullish cycle remains valid. All eyes should now be on the breakout structure and volume profile around $22,237, as it represents the gateway to a much broader impulsive move.

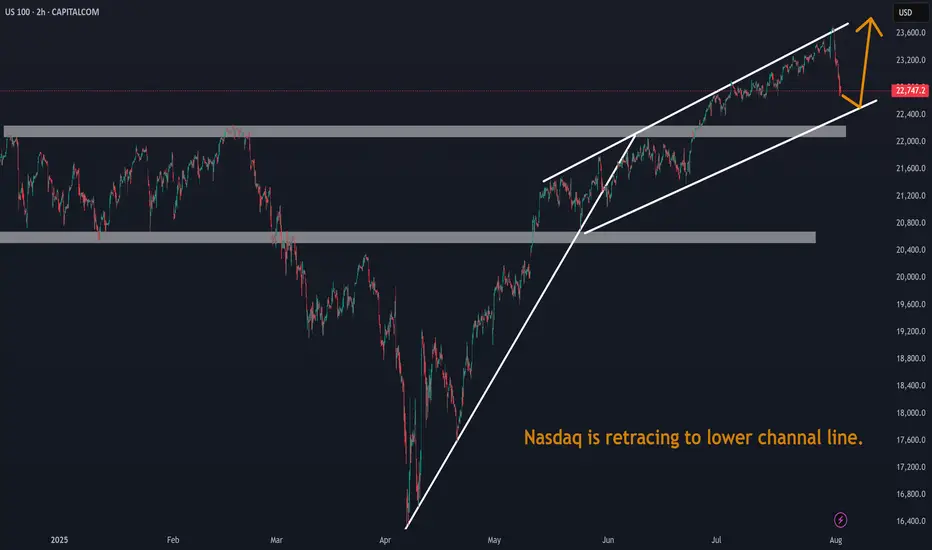
Nasdaq is retracing to lower channal line.Nasdaq is retracing to lower channal line. This fall is attributed to Tarrif war.
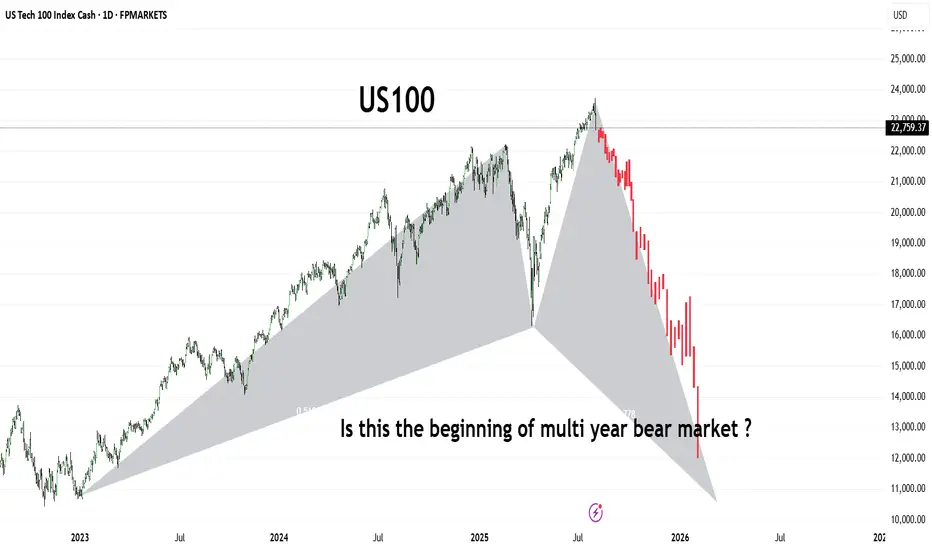
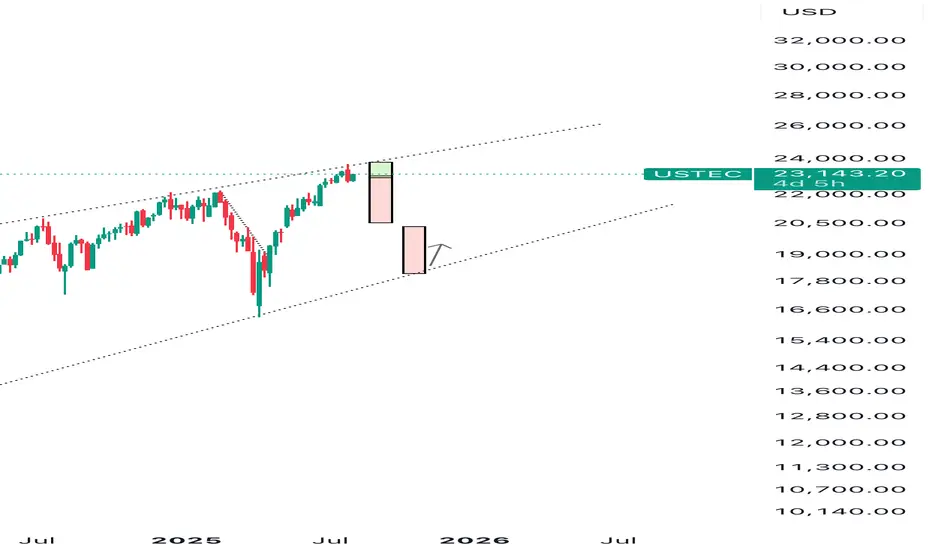
US100The US100 (Nasdaq 100) has shown a dramatic shift in trend, forming what appears to be a large-scale bearish harmonic pattern or potential M-top structure. After reaching its peak in mid-2025, the index has entered a sharp downward trajectory, shedding significant value in a short span.
This chart raises a critical question for long-term investors and traders:
Are we witnessing the early phase of a prolonged bear market that could stretch into 2026 and beyond?
🔻 Key Observations:
Bearish structure developing with aggressive selling pressure.
Potential breakdown from long-term support trendlines.
Momentum suggests institutional risk-off behavior.
Stay alert for macroeconomic cues, interest rate policy, and earnings season signals. A break below 13,000 could confirm a deeper bear cycle

NASDAQ & NFP- I expect BullishnessHello fellow traders,
Today is NFP and I expect a bulishness as per my PD Arrays analysis. Lets se if it words out.
I have higlighted all important PD Arrays in my chart, keep an eye.
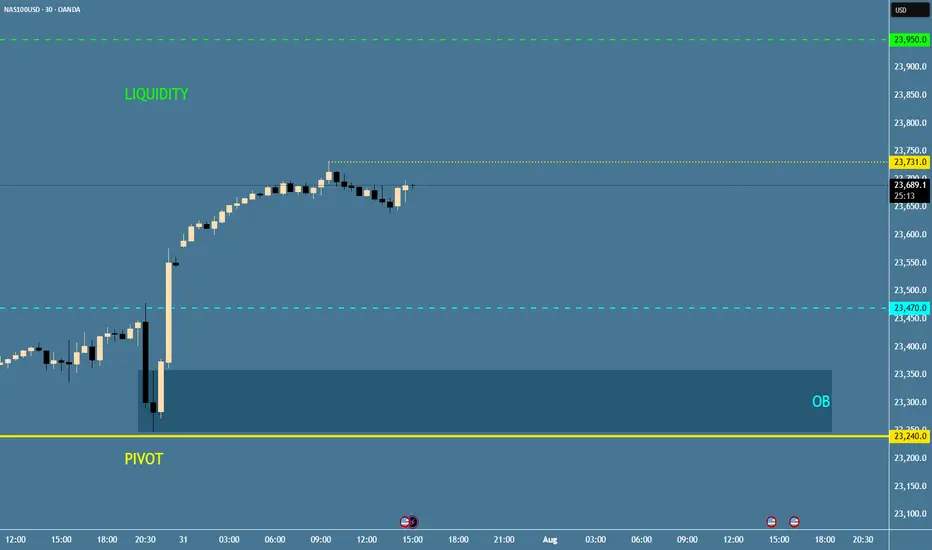
NAS100 - Update Dear Friends in Trading,
How I see it,
I will be waiting for a clear and decisive break below the PIVOT.
Keynote:
I am not trading NASDAQ at all...just monitoring patiently!!
I will keep you in the loop as the stock market progress...
I sincerely hope my point of view offers a valued insight
Thank you for taking the time study my analysis.
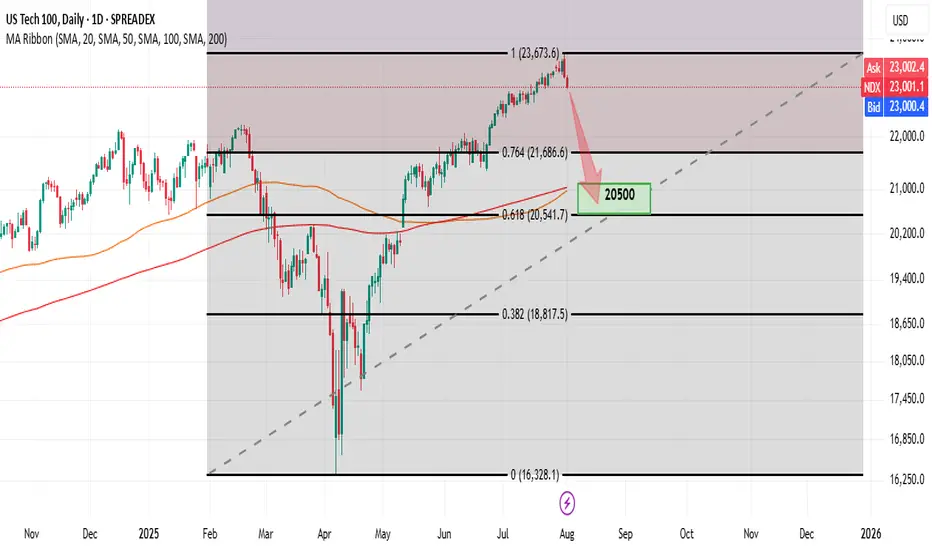
NDX – Double Top & Divergence (H4, D FRL Setup)Hello friends! It's time for our beloved Nasdaq index to cool down. I expect a correction amid the strengthening of the dollar.
H4: clear Double Top forming near 23,000.
Daily: bearish MACD divergence confirms momentum shift.
📐 FRL (H4): neckline at 23,000, perfectly aligned with 100 SMA on H4.
🎯 Target: 0.618 Fib retracement at 20,500 – confluence with 100 & 200 SMA on Daily and strong horizontal support.
Top in Place? NASDAQ100 Signals Exhaustion After Incredible Run📈 The crazy run since April
NASDAQ100 has had a spectacular run since early April, when the index dipped to 16,300 amid rising tensions caused by Trump’s tax war. From that low, we’ve seen a mind-blowing rally of over 7,000 points, which translates to a 40% gain in just 4 months.
Such a rise is not just impressive— it’s overextended , especially by historical standards. Markets don’t move in straight lines forever, and this one might be showing signs of fatigue.
🕯️ Bearish signal at the top
Fast forward to this week: yesterday, the index marked a new all-time high at 23,700, but closed the day with a strong bearish engulfing candle — one that wipes out the gains of the previous 4 trading sessions.
This is not a small technical detail. Such candles, when appearing after an extended rally, often signal exhaustion and a potential shift in momentum.
❗ Top in place?
In my opinion, there's a high probability that a top has been set, at least temporarily. We might be looking at the beginning of a healthy correction, or even something more meaningful, depending on follow-through in the next sessions.
📉 Where to next?
The first major support to watch is the 22,200 level.
I expect that zone to be tested soon — and honestly, considering how much the index has gone up, this shouldn’t surprise anyone. It’s nothing more than a minor pullback, all things considered.
🧠 Stay smart!
When markets go vertical, it pays to stay disciplined and realistic. Tops rarely announce themselves, but when signals like this appear, it’s wise to listen.
Disclosure: I am part of TradeNation's Influencer program and receive a monthly fee for using their TradingView charts in my analyses and educational articles.

Nasdaq faces a possible down 5-10/20% downturn.Overconfidence will foreshadow a correction. Risk posed by slowing growth in jobs, trade disputes and high valuations in growth focused companies in the index.
Nasdaq Long 7.17.25At 9 AM, price bounced off of the PD high which signified that price wanted to distribute above the current week high, old day high. I entered at 10 AM off the 9 AM candle. Awesome trade and execution.

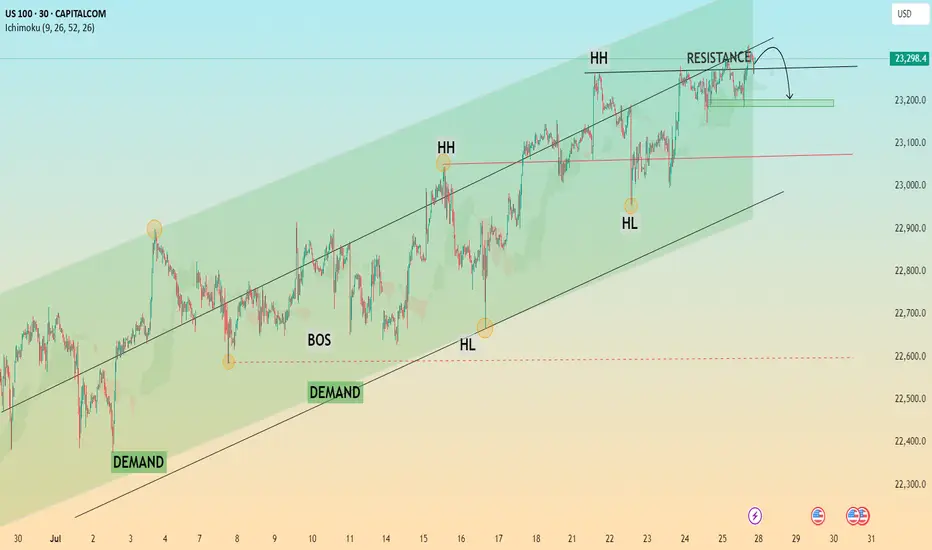
Trend Exhaustion Detected – Bearish Structure AheadUS100 (NASDAQ) 30-minute chart as of July 26, 2025, with technical insights based on the visible elements.
🔍 1. Trend Analysis
Primary Trend: Uptrend (bullish structure)
The price has been respecting a rising parallel channel, marked by:
Ascending support (lower boundary)
Ascending resistance (upper boundary)
Market structure shows:
Higher Highs (HH)
Higher Lows (HL)
✅ This indicates continuation of bullish momentum until structure breaks.
📐 2. Market Structure Elements
Structure Type Label on Chart Price Zone (approx.)
Break of Structure (BOS) BOS (center-left) ~22,950
Higher Low (HL) HL (2x) ~22,700 (1st), ~23,050 (2nd)
Higher High (HH) HH (2x) ~23,150 and ~23,300
Resistance Labelled ~23,300–23,320
Demand Zones Labelled ~22,450–22,700
🔁 Break of Structure (BOS)
The BOS occurred after a prior swing low was broken, followed by a new higher high, confirming a bullish shift.
🧱 3. Support / Resistance Analysis
🔼 Resistance Zone
The price is testing strong resistance around 23,300–23,320
Multiple rejections in this area
Trendline resistance also aligns here
A rejection arrow is drawn, indicating potential bearish reaction
🔽 Support Zone (Immediate)
23,180–23,220: highlighted green box is a local support block
If broken, likely to revisit 23,000–23,050, or even down to 22,900 range
🟩 4. Demand Zones
Zone 1:
22,450–22,600: Strong bullish reaction historically — likely to act as a key demand if a deeper pullback occurs
Zone 2:
22,850–22,950: Validated with prior accumulation & BOS event
🧠 5. Key Observations
Price is at a critical inflection zone:
Testing a resistance zone
At the upper trendline of an ascending channel
A bearish reaction is projected (black arrow)
Possibly targeting the green support zone around 23,180–23,220
If that fails, demand at ~23,000 will likely be tested
Ichimoku Cloud:
Currently price is above the cloud → still bullish
Cloud is thin → potential weakness or upcoming consolidation
⚠️ 6. Trading Bias & Setup Ideas
✅ Bullish Bias (if price holds above ~23,180)
Long entries can be considered on bullish reaction from support
Target: retest of 23,300–23,350 or even breakout continuation
❌ Bearish Bias (if breakdown below support)
Short entry valid below 23,180 with:
TP1: 23,050
TP2: 22,900
A breakdown from the ascending channel would signal trend exhaustion
🔚 Conclusion
Current Price: 23,298.4
Trend: Bullish, but at resistance
Next move: Watch for reaction at resistance and support box below
Bias: Neutral-to-bullish unless the structure breaks below ~23,180
Lesson 17:NasDaq 100 Price Correction NasDaq 100 price correction. This lesson explains how break out price will always correct towards levels of consolidation or break out level of support/resistance.

Nasdaq Index (US100 / NASDAQ) Technical Analysis:The Nasdaq index experienced a sharp drop last week, as expected, testing the 22,680$ level. Today, it's showing signs of a corrective move, currently trading around 22,950$.
🔹 Bearish Scenario:
If the price drops back to 22,680$ and breaks below it with confirmation, the next support could be 22,400$.
🔹 Bullish Scenario:
If buying momentum pushes the price above 23,000$, and it holds, we may see an extension toward 23,240$ and possibly 23,500$.
⚠️ Disclaimer:
This analysis is not financial advice. It is recommended to monitor the markets and carefully analyze the data before making any investment decisions.
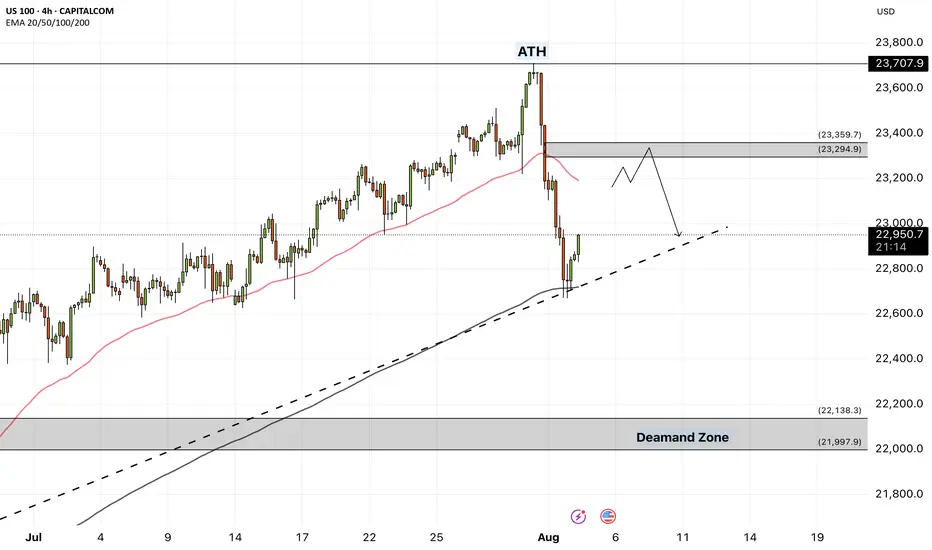
NAS100 - Stock Market Heading Down?!The index is trading in its medium-term ascending channel on the four-hour timeframe between the EMA200 and EMA50. However, if the index corrects upward towards the specified supply zone, it is possible to sell Nasdaq with better risk-reward.
In recent days and weeks, the Nasdaq Composite Index once again approached its historic highs, even setting a new all-time record. However, following the latest jobs data and the Federal Reserve meeting, the index experienced a price correction.
Unlike many previous bullish phases that were driven largely by short-term momentum or emotional reactions, the current upward trend in the Nasdaq reflects structural maturity and market stabilization. Institutional capital inflows and strong corporate earnings have together painted a picture of a more stable and predictable future for this index.
According to recent financial data, U.S. equity funds received over $6.3 billion in net inflows during the final week of July—marking the first positive inflow after three consecutive weeks of outflows.
The key engine behind this growth continues to be the robust performance of tech companies. Firms such as Meta, Microsoft, and AI-oriented companies like Nvidia and Broadcom posted exceptionally strong earnings reports. These results not only exceeded analysts’ expectations but also fueled significant gains in their stock prices, contributing to the Nasdaq’s momentum. Despite some sector-specific concerns—for instance, regarding Qualcomm in the semiconductor space—the broader tech sector has sustained its upward trajectory and even extended that momentum to adjacent industries, especially those involved in cloud and AI supply chains.
Meanwhile, advisors to Donald Trump revealed that he plans sweeping reforms at the U.S. Bureau of Labor Statistics (BLS). This announcement followed the July jobs report, which showed only 73,000 new jobs and sharp downward revisions to prior months’ figures.
On Truth Social, Trump accused the current BLS Commissioner, Erica McEnturfer, of politically manipulating employment data and ordered her immediate removal. Secretary of Labor Lori Chavez-DeRemer subsequently announced that Deputy Commissioner William Witrofsky would serve as acting head. Trump emphasized that economic data must be accurate, impartial, and trustworthy—and not politically skewed.
Following this leadership change, a broader debate has emerged around how employment statistics are collected and reported. While statistical revisions have long been a routine, non-political process since 1979, there are now growing questions about whether a better system for gathering and publishing this critical data could be developed.
As a nonpartisan branch of the Department of Labor, the BLS publishes its monthly employment report at 8:30 AM Eastern on the first Friday of each month. The data is gathered from surveys of around 629,000 business establishments.
Analysts have cited several reasons for the frequent need for revisions:
• Late responses from firms
• Delays from large corporations that distort preliminary figures
• Recalculations due to seasonal adjustments (e.g., holidays or weather)
• Demographic shifts impacted by immigration or deportation
• Annual revisions based on finalized tax records
With a relatively light economic calendar in the U.S. this week, traders have turned their focus to the latest developments in trade negotiations—particularly talks with countries that have yet to finalize trade agreements with Washington.
Although the U.S. has reached deals with key partners including the UK, EU, Japan, and South Korea, no formal agreement has yet been made with China to extend the current trade truce, which is set to expire on August 12.
The new U.S. tariff plan proposes a baseline 10% rate for most countries, but some—like India and Switzerland—face much higher rates of 25% and 39%, respectively. However, since implementation of the tariffs has been postponed until August 7, there’s still time for further negotiations and possible rate reductions. Sources close to the White House suggest the administration is eager to continue talks.
What’s now becoming clear is the sheer magnitude of the proposed tariff shifts—far beyond pre-trade-war averages. These changes could have more severe consequences than previously estimated, potentially pushing up U.S. inflation while simultaneously threatening global growth. As such, markets may be entering a fresh wave of volatility.
Compounding these concerns is the U.S. Treasury’s upcoming bond issuance schedule, which could add to market instability.
Also on the radar is the ISM Services PMI for July, due Tuesday. Its results will be closely watched for signs on the U.S. dollar’s direction and the Fed’s potential actions at its September meeting.
Notably, as of July 18, 2025, the widely-followed Buffett Indicator—measuring the ratio of market capitalization to GDP—was 2.3 standard deviations above its historical average. This level surpasses even the dot-com bubble era of the early 2000s. The indicator is now firmly in the “overvalued” zone, which often precedes market corrections or even crashes. For context, during the 2008 financial crisis, it was roughly 1.5 standard deviations below the historical norm.
Us100 a strong buyUs100 broke out of your trendline, waiting for the market to retrace to your demand zone, and we can buy from there

NASDAQ Long 7.28.25I saw that price had hit the PD high and took the PD low (sunday) then closed at 9 AM as a bullish hammer. At 10 AM, I entered long at the 9 AM wick equilibrium. The trade hit the 75% BE and Final TP with a 1:1 RR.

NDX & SPX , Stay heavy on positionsNDX & SPX , Stay heavy on positions (QLD, TQQQ)
Despite downside volatility, the trend remains intact. I’m maintaining the same view as before—this is still a zone to stay heavy.

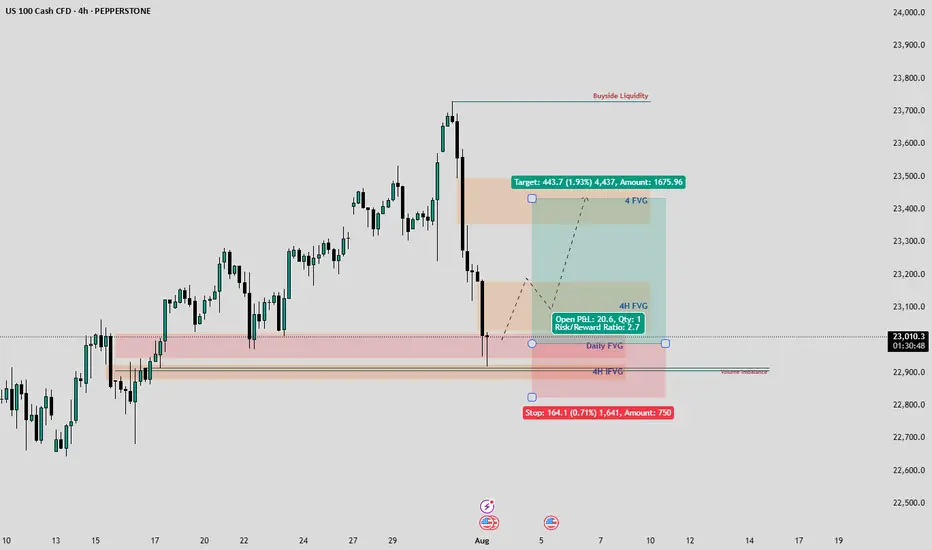
Nasdaq| Bullish Intent Maintained| Refined OB Reaction In Motion(Refined & Structured):
• Pair: Nasdaq (US100)
• Bias: Bullish / Buy
• 4H Overview: Bullish structure remains intact. Despite the congestion and noise, price maintained its upward trajectory. I refined the drop to mid timeframes for precision and clarity.
• 30M Structure: Refined bullish structure with clear intent. Price has mitigated a clean OB, setting the stage for further continuation.
• Entry Zone: Watching lower timeframes for confirmation to ride the wave higher.
• Targets: 5M to 30M structural highs depending on how price delivers.
• Mindset Note: Noise is just noise until structure filters it out. Precision comes from refining—this setup proves that. Stay focused, stay clean, let intent guide you.

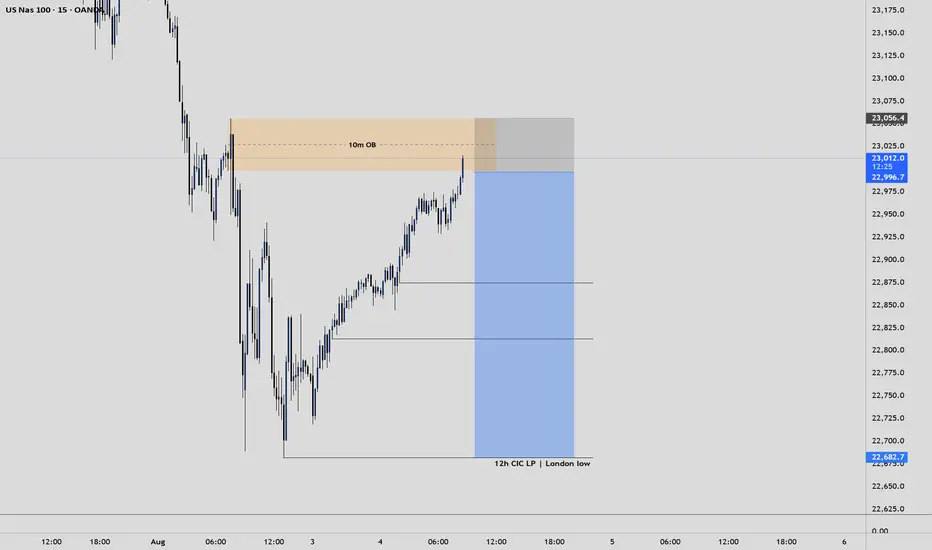
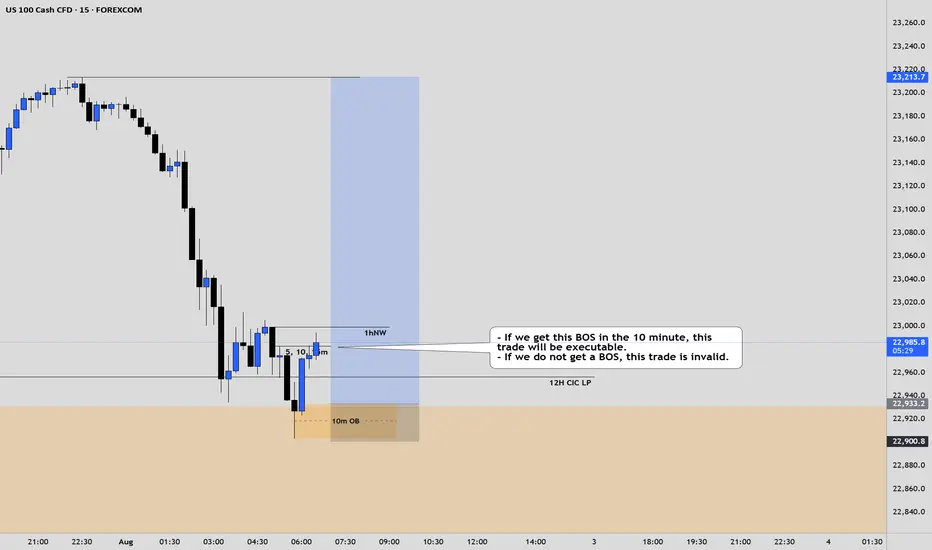
NAS100 LongElite Analysis
This analysis is not executable ONLY UNTIL we get a BOS on the 10m time frame.
(Potential BOS is identified on chart)
Once we get the BOS, we execute from the 10m OB.
Targeting upper liquidity pools.
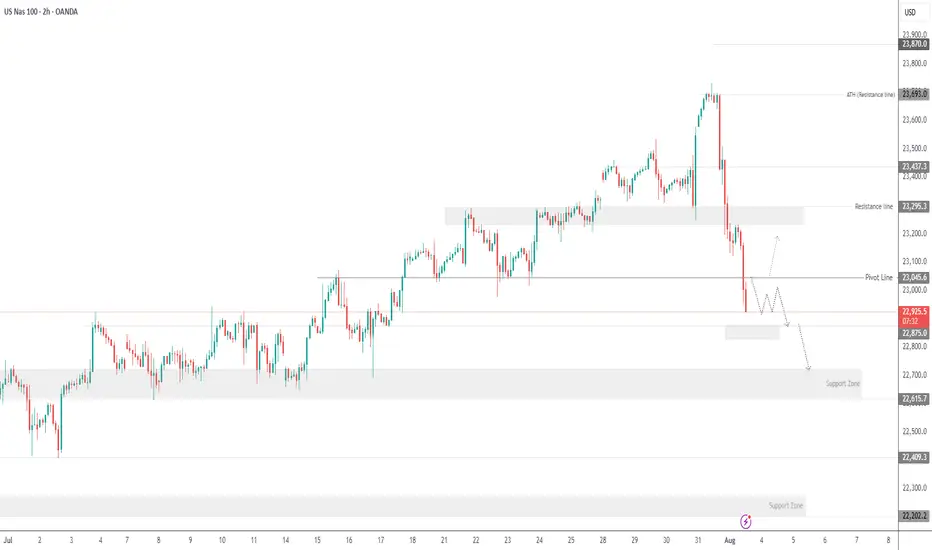
USNAS100 - Tech Weakness & Tariffs Drag NASDAQ LowerTariff Day Pressure Builds as Amazon Miss Weighs on Markets
Markets were hit by a wave of risk-off sentiment on Friday as renewed tariff headlines, weakness in pharma stocks, and a disappointing earnings report from Amazon clouded investor confidence. All this comes just ahead of the U.S. jobs report, which is expected to challenge the market's already diminished expectations for Fed rate cuts.
While macro markets appeared resilient earlier in the week, Wall Street futures and global equities turned cautious as sentiment deteriorated.
NASDAQ – Technical Outlook
The NASDAQ has dropped nearly 850 points from its recent all-time high of 23690, as anticipated in previous updates. The index remains under bearish pressure.
For today, the market is expected to remain sensitive due to recent macro and earnings-driven volatility.
If the price breaks below 22875, the decline is likely to extend toward 22710, with a deeper support zone at 22615.
To shift back to a bullish bias, the index must break and close above 23045 on the 1H chart.
Support Levels: 22875 • 22710 • 22615
Resistance Levels: 23140 • 23240 • 23320
Bias: Bearish while below 23045
Bullish confirmation: 1H close above 23045