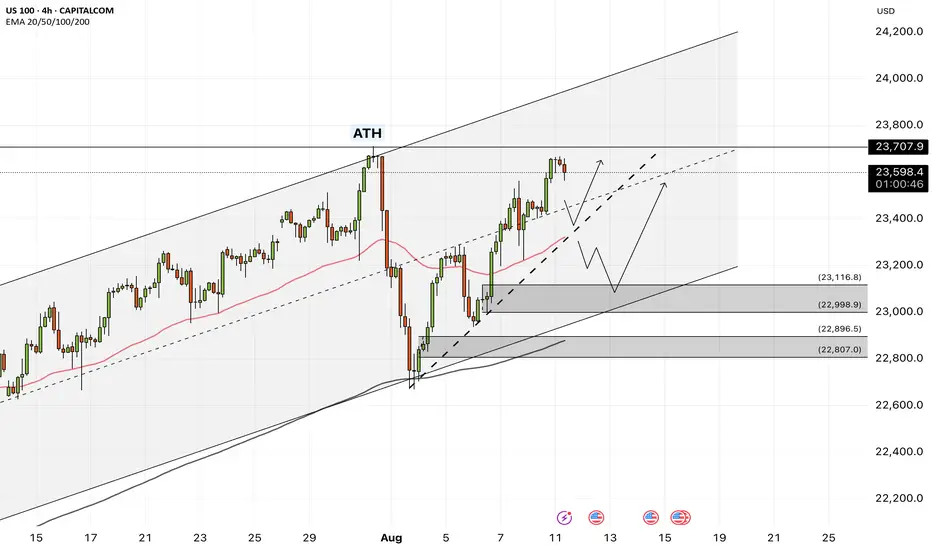
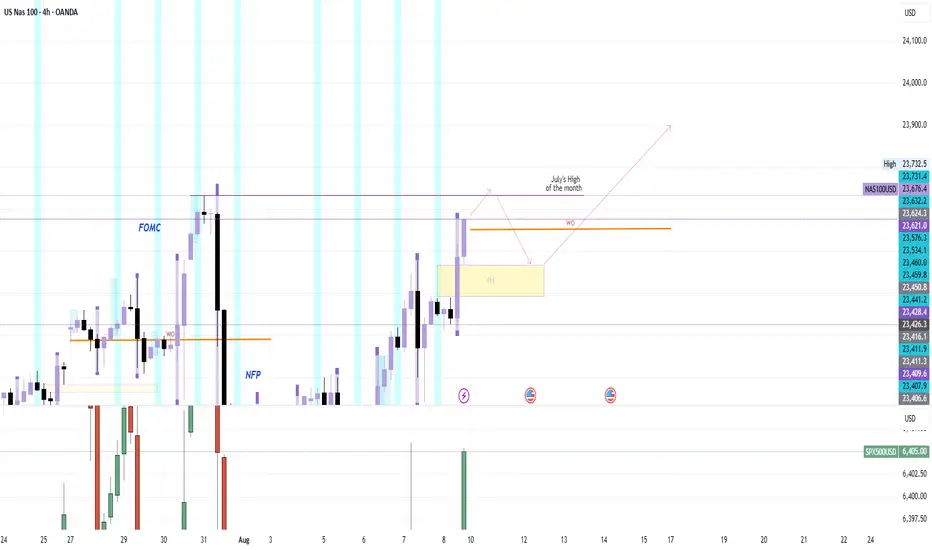
NAS100 - Stock market awaits an important week!The index is above the EMA200 and EMA50 on the four-hour timeframe and is trading in its ascending channel. If the index corrects downwards towards the drawn trend line or the specified demand zone, you can buy Nasdaq with better reward for risk.
Many Federal Reserve officials believe that tariffs could weaken the U.S. economy and push inflation higher—a dilemma that forces policymakers to choose between cutting interest rates to support growth or keeping them unchanged to control prices.
However, Miran—the economic adviser President Donald Trump intends to nominate to the Fed’s Board of Governors—rejects this view. He argues that tariffs will ultimately benefit the economy and will not significantly impact prices, allowing the Fed to resume the rate-cutting cycle it halted earlier this year.
The key question now is whether Miran’s arguments will be persuasive enough to sway the broader thinking of the central bank’s policy committee, or whether concerns over labor market weakness might prompt rate cuts regardless, rendering his arguments unnecessary.
According to analysis from The Wall Street Journal, beyond the policy disagreements, Miran has also challenged the institutional legitimacy of the Federal Reserve. He has accused Fed officials of having political motivations and criticized them for what he calls the “tariff disruption syndrome.” In a paper published last year, he argued that all senior Fed officials should be subject to dismissal at the White House’s discretion. If appointed, he would give Trump a loyal ally inside the Fed’s boardroom—someone capable of promoting the president’s views and challenging the institution’s consensus-driven culture and influential research staff.
Meanwhile, JPMorgan has revised its monetary policy forecast for 2025, now expecting the Fed to deliver three 25-basis-point rate cuts starting in September 2025, compared to its earlier projection of just one cut in December.
Miran, who holds a Ph.D. in economics from Harvard University, currently serves as Chairman of the White House Council of Economic Advisers. On Thursday, Trump announced his intention to nominate him for a newly vacant Fed board seat. This position became available unexpectedly after Adriana Kugler’s resignation last week and will expire in January. Trump also revealed plans to nominate another individual to fill this seat, who could potentially replace Jerome Powell as Fed Chair in the spring. Miran’s appointment would give Trump additional time to evaluate how candidates—whether Miran himself or Christopher Waller, whom he appointed during his first term—align with his policy views and vote on interest rates.
This week’s economic calendar is once again crowded, with a series of key inflation reports and consumer-related indicators in the spotlight.
Early Tuesday, the Reserve Bank of Australia will announce its interest rate decision, with markets expecting a 25-basis-point cut from 3.85% to 3.60%. Shortly after, traders’ attention will shift to the U.S. Consumer Price Index (CPI) for July, where core inflation is expected to rise from 0.2% in June to 0.3%.
Wednesday will be relatively quiet, with the main highlight being speeches from Fed officials Austan Goolsbee and Raphael Bostic. On Thursday, focus will return to major data releases, including the U.S. Producer Price Index (PPI), which is projected to see its core measure increase by 0.2% after holding steady in June. Weekly jobless claims figures will also be released that day.
The week will conclude with a broader look at U.S. consumer activity. July retail sales are forecast to slow from 0.6% to 0.5%, while core retail sales are expected to drop from 0.6% to 0.3%. Hours later, the preliminary August reading of the University of Michigan Consumer Sentiment Index will be released, providing insights into consumer expectations and confidence.
According to ISM data, pricing pressures have eased in the manufacturing sector but have jumped sharply in the services sector, which makes up a much larger share of the U.S. economy. This suggests that upcoming CPI and PPI reports carry an upside risk relative to forecasts. Inflation readings above expectations—even before fully factoring in the impact of retaliatory tariffs—could erase part of the market’s anticipated rate-cut outlook.
NDQUSD trade ideas
Different Strats, Same ChartICT, SMC, breakout traders, trendline traders… everyone swears they’ve got a unique edge, but it’s all pointing to the same POI. Same price, same reaction. Doesn’t matter what you call it — the market delivers the same setup for everyone, only difference is how you see it.

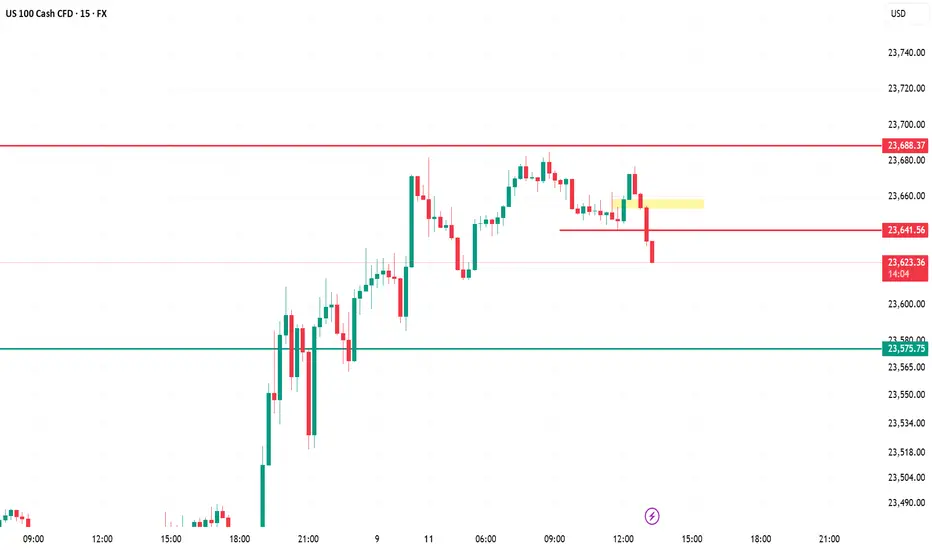
US100 (5m) – AnalysisKey Breakdown – Price has broken below the 23,641 support (red line) after failing to hold the yellow retest zone, signaling short-term bearish momentum.
Immediate Resistance – 23,641 is now flipped into resistance; any pullback toward it could attract sellers.
Downside Target – Next major support sits at 23,575; if broken, deeper liquidity may be targeted below 23,550.
Market Structure – Shifted from intraday uptrend to lower highs & lower lows; momentum favors short trades until structure flips.
Trading Approach – Look for short entries on retests of 23,641 with stop above yellow zone, target 23,575, then trail for possible extended drop.
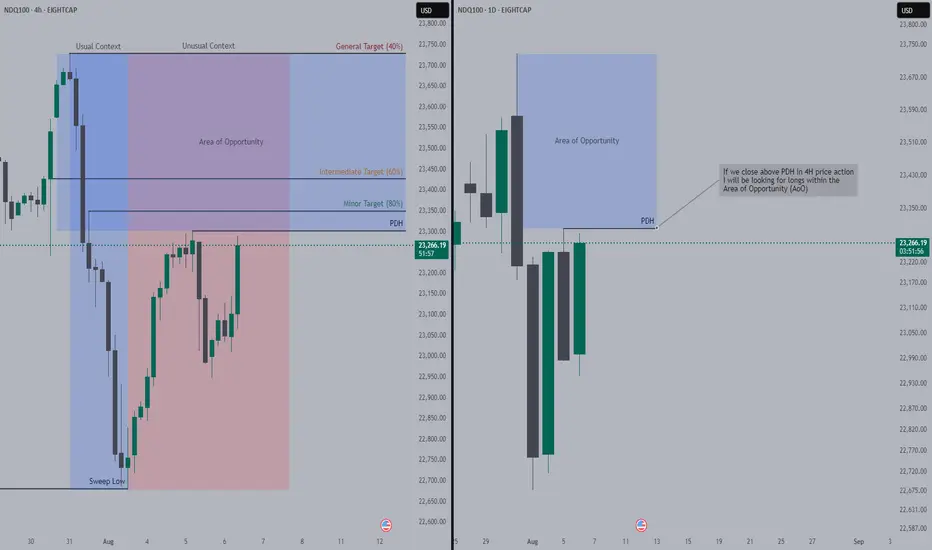
Nasdaq Pumping High, We Might Ride The WavePrice today(Wed) is recovering from yesterday's (Tue) dumping. Our bullish direction is still intact.
Entries should be taken once, price has entered within our Area of Opportunity.
Targets with their success rate have been outlined on the charts.
NDX & SPX , Stay heavy on positionsNDX & SPX , Stay heavy on positions. (QLD, TQQQ)
Despite the rebound, the market remains tilted toward hedging and caution.
In stay light on positions zones, I hold QQQ and reduce exposure.
In stay heavy on positions zones, I increase allocation using a mix of QLD and TQQQ.

Sunday pre market analysistake the liQ from Junes high then
possible hit the 4H FVG if not just continue
upwards into September
when to change your session bias and Take profit, YM! Long1. This video demonstrate when you should change you bias for the session, sometimes before session price action quite confusing but when you add SMT and strength switch concept to you bias you will see true price intention where it will go.
2. Always take entry or profit one level to another level, price always go from one level to another level.
3. This video I try to demonstrate how to take profit when you have to level to target, always look for the correlated instruments to build bias

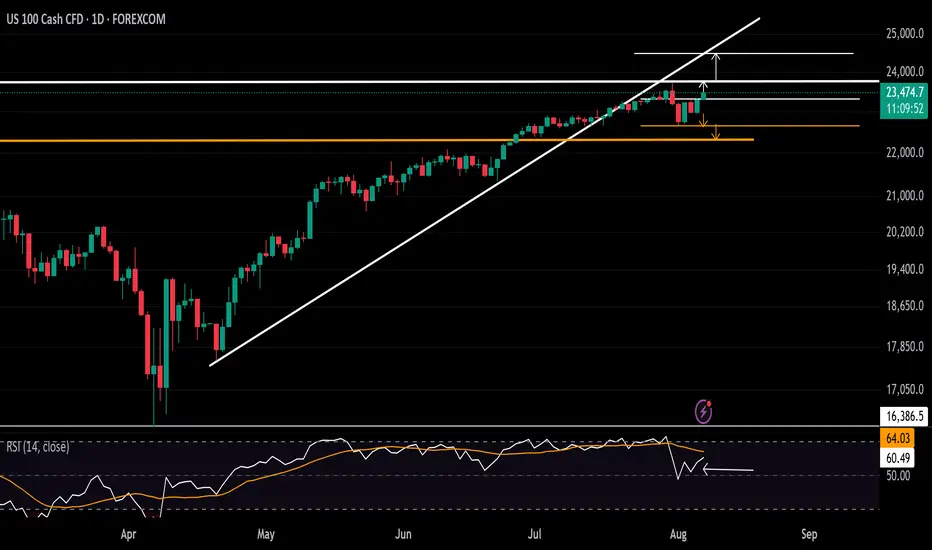
Nasdaq long position Nasdaq long position update. Nasdaq is still going as predicted and is about to hit the set target of 24,000. Recently Nasdaq retested a support of break-out and retest and continued with the bullish momentum. Nasdaq is set to thrive even higher to a price of 25,000.

NSDQ100 sideways consolidation support at 23045Nasdaq 100 Market Summary – August 8
Markets remain cautious, with a mix of corporate and macro developments driving sentiment.
Gold futures surged after the US unexpectedly imposed tariffs on one-kilo and 100-ounce gold bars. The move surprised traders and added fresh uncertainty to the metals market. Oil prices stabilized following a recent decline, as attention shifts to potential diplomatic developments, including a possible Trump-Putin meeting.
In the tech sector, Tesla scrapped its Dojo supercomputer project, a blow to its in-house AI and self-driving ambitions. This comes just weeks after Elon Musk said he was doubling down on the effort. The departure of the project’s lead adds to investor concerns. Meanwhile, Intel’s CEO responded to political pressure by reaffirming his board’s support, as Trump called for his resignation over alleged conflicts of interest.
On the economic front, the latest jobless claims data brought some relief after last week’s soft payrolls report. Initial claims rose slightly to 226,000, just above the 222,000 forecast. However, continuing claims came in higher at 1.974 million, with most of the increase seen in California—likely due to seasonal factors. Additionally, the New York Fed’s July survey showed a rise in both inflation expectations and concerns about the job market.
Conclusion for Nasdaq 100 Trading:
The tone remains cautious. Disruptions at major constituents like Tesla and Intel may drag on sentiment, while macro uncertainty—rising geopolitical tensions, new tariffs, and unstable commodity markets—adds to headwinds. Traders may rotate into defensives or software names with lower exposure to AI hardware or international trade risks. Expect range-bound trading with elevated volatility until clarity emerges on US-Russia diplomacy and the true extent of tariff impacts.
Key Support and Resistance Levels
Resistance Level 1: 23700
Resistance Level 2: 23900
Resistance Level 3: 24085
Support Level 1: 23045
Support Level 2: 22870
Support Level 3: 22675
This communication is for informational purposes only and should not be viewed as any form of recommendation as to a particular course of action or as investment advice. It is not intended as an offer or solicitation for the purchase or sale of any financial instrument or as an official confirmation of any transaction. Opinions, estimates and assumptions expressed herein are made as of the date of this communication and are subject to change without notice. This communication has been prepared based upon information, including market prices, data and other information, believed to be reliable; however, Trade Nation does not warrant its completeness or accuracy. All market prices and market data contained in or attached to this communication are indicative and subject to change without notice.


BUY USTEC 8.8.2025Confluence order: BUY at M15
Type of order: Limit order
Reason:
- The current top is not touching anything, expected to rise to the MAINKEY of H1~M15 above.
- M15~FIBO 0,5-0,618 (same position)
Note:
- Management of money carefully at the last bottom (23,459)
Set up entry:
- Entry buy at 23,438
- SL at 23,423
- TP1: 23,459 (~1R)
- TP2: 23,481 (~2R)
- TP3: 23,540 (~6R)
Trading Method: Price action (No indicator, only trend and candles)


NAS100 - LONGPrice pushed down a lot lower than I thought it would but sentiment still remains the same. Waiting for bullish confirmation for price to reach today's highs.
NAS100 - LONGstrong sell of this morning. Waiting for buyers to reenter the market and push price back to todays highs.

NASDAQ Index (US100 / NASDAQ) Analysis:The NASDAQ index has shown strong bullish momentum recently and is currently trading near a key resistance level at 23,530.
🔻 Bearish Scenario:
If the price fails to break above 23,530 and selling pressure begins to appear, we may see a downside correction toward 23,350. A break below this level could extend the decline toward 23,000.
🔺 Bullish Scenario:
If the price successfully breaks and holds above 23,530, it could support a continued move upward toward 23,730 as the first target. With sustained momentum, we might see a further push toward 24,000.
⚠️ Disclaimer:
This analysis is not financial advice. It is recommended to monitor the markets and carefully analyze the data before making any investment decisions.

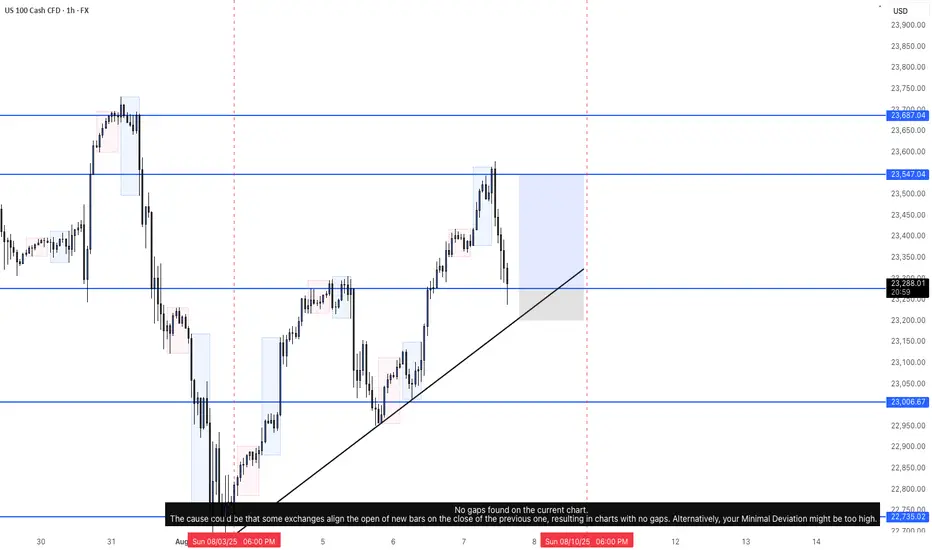
Nasdaq Eyes Record Highs Once AginNasdaq faces pressure as it trades below the trendline connecting the consecutive higher lows from April 2025. However, the latest decline rebounded from strong support at 22,700. Price action has reclaimed the 23,000 and 23,400 levels, suggesting a potential shift in tone.
A clean close above 23,500 is likely needed to push the index toward new highs above 23,700. From there, price may either pull back or continue an extended rally toward 24,000 and 24,400.
On the downside, if price falls back below 22,700, the risk increases for a move toward the previous key peaks from 2025 near 22,400 and 22,200.
- Written by Razan Hilal, CMT


BUY USTEC 7.8.2025Confluence order: BUY at M15
Type of order: Limit order
Reason:
- The current top is not touching anything, expected to rise to the sub-key of H1~M15 above.
- M15~FIBO 0,5-0,618 (same position)
Note:
- Management of money carefully at the last bottom (23,,367)
Set up entry:
- Entry buy at 23,339
- SL at 23,317
- TP1: 23,367 (~1R)
- TP2: 23,403 (~3R)
- TP3: 23,459 (~5R)
Trading Method: Price action (No indicator, only trend and candles)

Aug 6th corrective phase, bullish trade setup The Nasdaq 100 is a tech-heavy index, highly sensitive to macroeconomic factors like interest rates, tech earnings, and market sentiment. On August 6, 2025, the market is likely influenced by:
• Monetary Policy: Recent Federal Reserve actions (rate cuts or pauses) could drive bullish momentum, as lower rates favor growth stocks in the Nasdaq.
• Economic Data: Employment, CPI, or tech sector earnings reports could impact volatility.
• Technical Levels: Fibonacci retracements, support/resistance, and trendlines are critical for intraday trading.
I entered Nasdaq above the 0.382 level (23,056.4), First target 23400 was reach at approximately 7pm PST the next targets are the 1.0 (23,700)
*this is not financial advice entertain at your own risk 📊📈

NSDQ100 Pre US Open Key Trading levelsTrade Policy & Tariff Risks:
Donald Trump escalated trade rhetoric, signaling higher tariffs on countries importing Russian energy, and previewing new tariffs on semiconductors and pharmaceuticals within days. This raises geopolitical and supply chain uncertainty—key risks for NSDQ 100 tech and healthcare stocks, particularly chipmakers, drug manufacturers, and firms exposed to global trade.
Swiss Tariff Dispute:
Swiss President Keller-Sutter is in Washington seeking to lower a newly imposed 39% tariff—highlighting the broader unpredictability of US trade actions, which could fuel market volatility and weigh on investor sentiment.
Ukraine Conflict & Sanctions Outlook:
As the US pushes toward an Aug. 8 deadline to resolve the Ukraine conflict, Trump's envoy is in Moscow. Potential Kremlin concessions (e.g., halting airstrikes) may reduce geopolitical risk premiums, especially for defense, energy, and global consumer tech firms.
Federal Reserve & Rate Policy:
With Fed Governor Kugler resigning, Trump is expected to name a replacement this week. His ongoing pressure on the Fed to cut rates adds policy uncertainty. This could support rate-sensitive NSDQ stocks in the near term, especially growth names in tech, if dovish expectations build.
Takeaway for NSDQ100 Traders:
Expect increased volatility around tariff news, Fed appointments, and geopolitical headlines. Traders should watch for:
Semiconductor stocks (e.g., NVDA, AMD, INTC) under pressure from tariff threats.
Big tech and biotech swings tied to pharma trade policy.
Potential relief rallies if Russia concessions materialize or Fed commentary turns dovish.
Key Support and Resistance Levels
Resistance Level 1: 23300
Resistance Level 2: 22430
Resistance Level 3: 23680
Support Level 1: 22677
Support Level 2: 22580
Support Level 3: 22388
This communication is for informational purposes only and should not be viewed as any form of recommendation as to a particular course of action or as investment advice. It is not intended as an offer or solicitation for the purchase or sale of any financial instrument or as an official confirmation of any transaction. Opinions, estimates and assumptions expressed herein are made as of the date of this communication and are subject to change without notice. This communication has been prepared based upon information, including market prices, data and other information, believed to be reliable; however, Trade Nation does not warrant its completeness or accuracy. All market prices and market data contained in or attached to this communication are indicative and subject to change without notice.
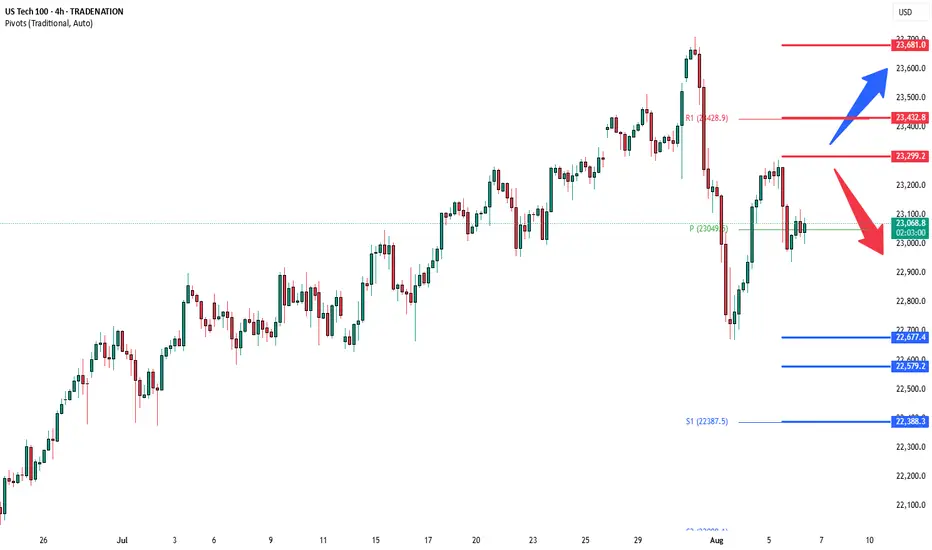
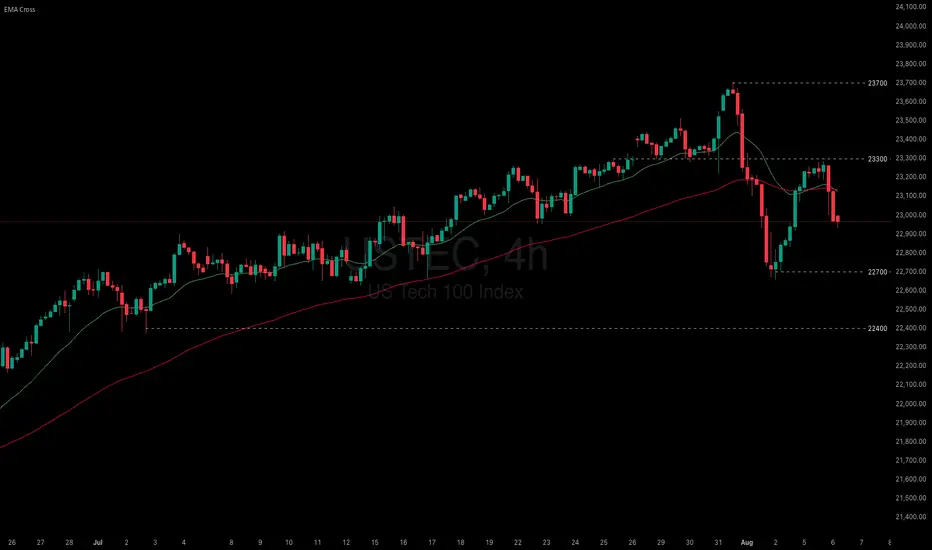
US indices paused as fragile macro data undermined recent gains
US equity gains paused amid President Trump’s renewed tariff threats and weakening economic data. Trump warned of steep tariff hikes on India and a potential 35% levy on the EU if obligations are not met. Meanwhile, the US July Services PMI fell from 50.8 to 50.1, missing the 51.5 consensus. New orders dropped to 50.3, while employment declined to 46.4—the lowest since March.
USTEC briefly tested 23300 before breaking below both EMAs. The widening gap between EMA21 and EMA78 suggests a potential shift toward bearish momentum. If USTEC fails to break above the resistance at 23300, the index could decline further toward 22700. Conversely, if USTEC breaks above both EMAs and 23300, the index may gain bullish traction toward 23700.
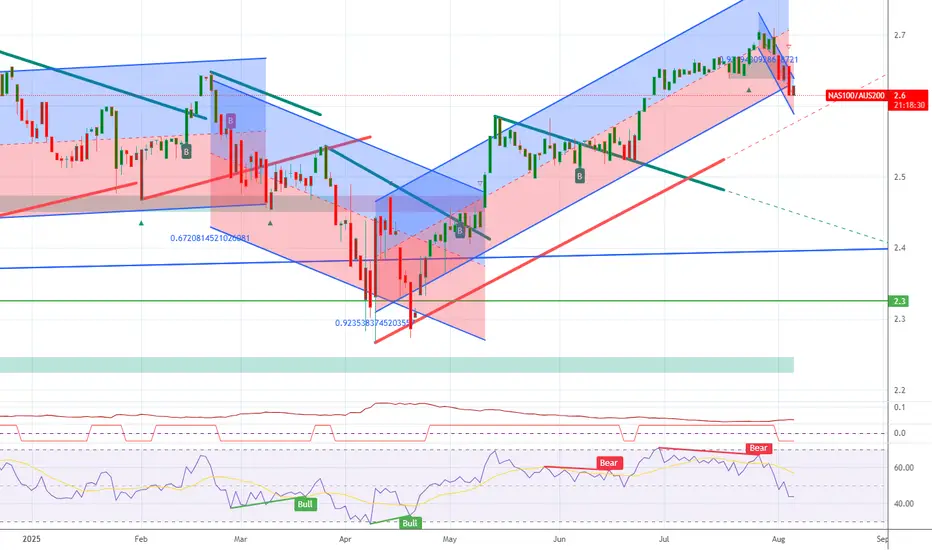
NAS100 vs AUS200 ShortThis ratio measure is not net short on the regression break.
It indicates there is mis-pricing of risk and you should take cation in the coming weeks.