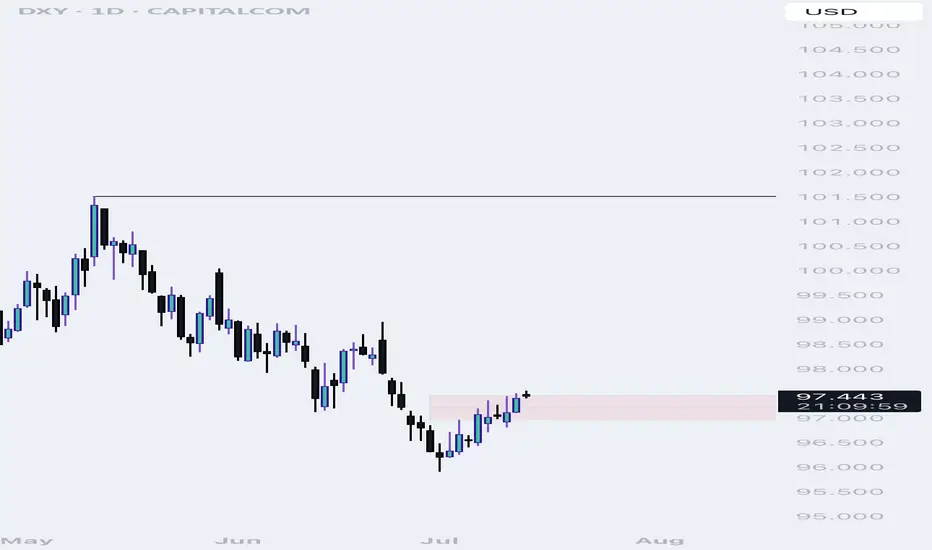
DXYNet USD longs increased = Bullish sentiment
Speculators adding longs / commercials reducing shorts
Price broke previous weekly high = BOS
✅ Holding weekly demand zone
Note: COT is supportive — align with technicals
USXUSD trade ideas
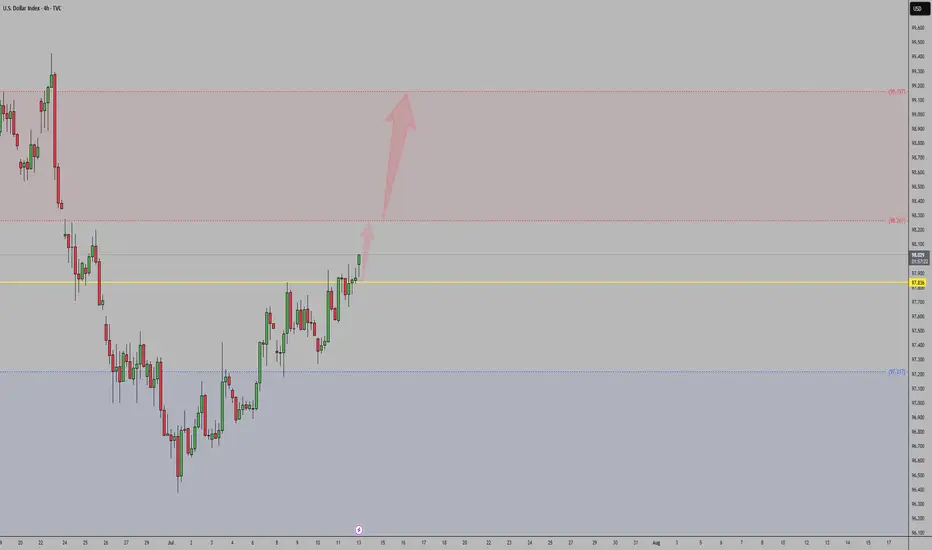
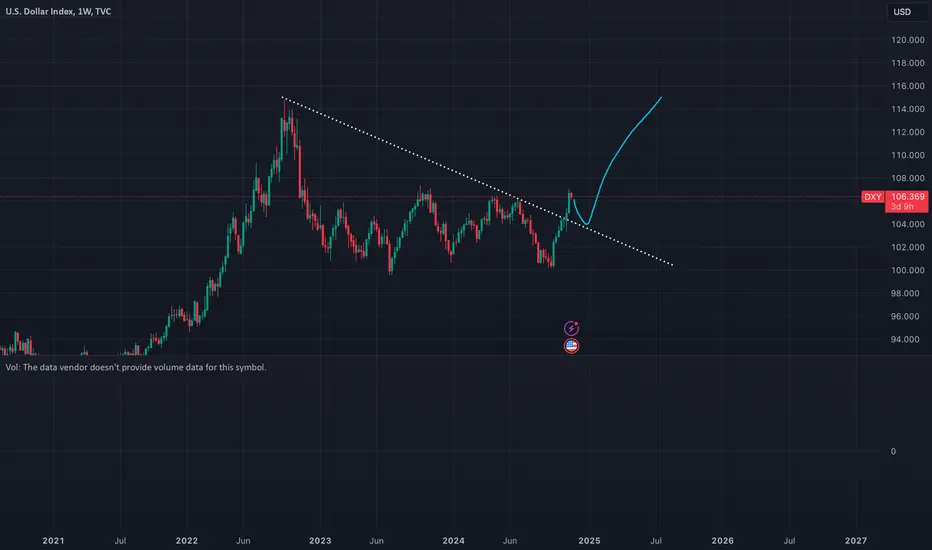
Sometimes, it can be this easy. DXY BULLISH continuationAs I'm trying to give reason, the market is running away.
I've guided you from the low till now, stop doubting my analysis please.
This is a discount price, DXY is still bullish till 99.42. Dont be caught on the sideline. EURUSD and other pairs are bearish. Trade accordingly
Follow me as my trades are market orders, so you will see them on time and enter the trade on time
Enjoy
Sometimes, it is this simple. DXY BULLISH I'm selling EURUSD and other pairs. DXY is still bullish till 99.42. Once price reach there, we will recheck and let price tip its hand.
This is discount price, dont miss out
Follow me as my trades are market order, so you will see it on time and enter on time

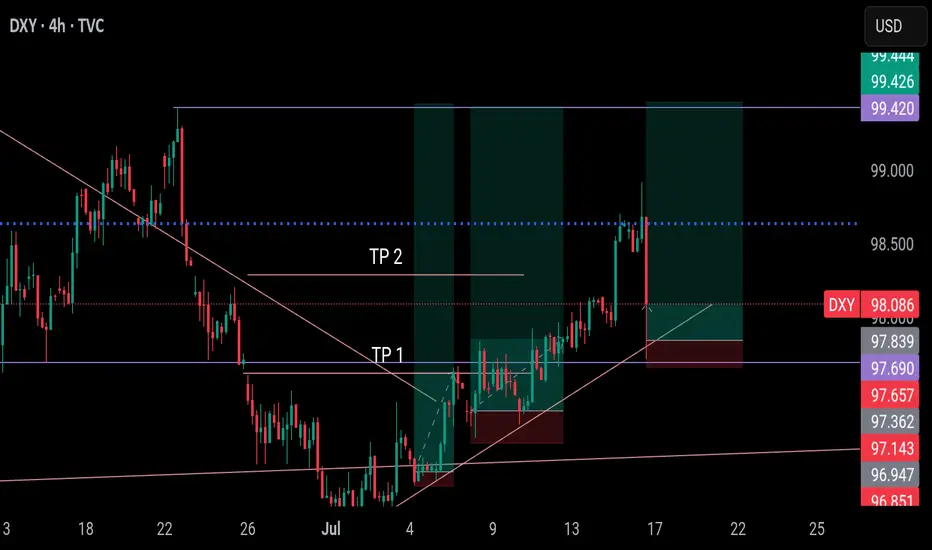
Three trade setup to the upside.Three trade setup to the upside.
1. Daytrade
2. Short term swing
3. Swing Trade

DXY Bullish Pennant (awaiting breakout)**1-hour timeframe** of the **US Dollar Index (DXY)** with technical analysis applied. Here's the breakdown:
**Technical Analysis Summary:**
**Current Price:**
* Around **98.08**, trading just under the **7 EMA (98.09)**.
**Bullish Structure:**
* A strong **bullish impulse leg** is visible (sharp green candle rally).
* Followed by a **bullish flag/pennant** pattern (marked in red), which is typically a **continuation pattern** in an uptrend.
* The flag is forming after a steep upward move — suggesting **consolidation before potential breakout continuation**.
**EMA Trend Support:**
* **EMA 7, 21, and 50** are aligned bullishly:
* EMA 7 > EMA 21 > EMA 50
* This supports the **short-term uptrend** structure.
**Support Zones:**
* A strong **demand zone** is marked between **97.50–97.70** (highlighted in red), where price previously consolidated before the breakout.
* EMA 50 also sits around **97.72**, reinforcing this as a strong **pullback support level**.
**Possible Scenarios:**
1. **Bullish Continuation:**
* If the price breaks above the flag resistance, it may **rally towards 98.70 → 99.00 → 99.10**.
2. **Bullish Pullback:**
* If price dips to retest the support near **97.80–97.90** or EMA 21, and holds, it may bounce and continue upward.
**Conclusion:**
* **Trend:** Bullish
* **Pattern:** Bullish Pennant (awaiting breakout)
* **Support:** 97.72–97.90
* **Upside Targets:** 98.70 → 99.00+
* **Outlook:** Positive bias continues **as long as price holds above the support zone** and EMAs.

possibility bof uptrendIt is expected that some fluctuation and correction will form within the current resistance zone, then there is a possibility of a trend change and the start of a downtrend.
As long as the index does not stabilize above the green resistance zone, a downtrend is likely.

DOLLAR INDEX U.S. Economic Data Release on the July 15th
Key Inflation Indicators
Indicator Current Forecast Previous
Core CPI m/m
0.2% 0.3% 0.1%
CPI m/m
0.3% 0.3% 0.1%
CPI y/y
2.7% 2.6% 2.4%
Core CPI m/m came in slightly below forecast, but still accelerated from the previous month, indicating underlying inflation pressures remain present.
Headline CPI m/m matched expectations, showing persistent monthly price growth.
Annual CPI (y/y) registered above forecast, indicating inflation is running hotter than previously expected and at its highest level since early 2025.
Empire State Manufacturing Index
Indicator Current Previous
Empire State Manufacturing Index 5.5 -8.3
The sharp rebound from negative territory signals a marked improvement in manufacturing sentiment in the New York region, pointing to possible resilience in U.S. industrial activity.
Market Implications
US Dollar (USD):
Inflation coming in at or above forecast (annual and headline monthly), along with better-than-expected manufacturing data, has support the USD in the short term. Stronger inflation weakens the case for near-term Federal Reserve rate cuts.
Treasury Yields:
Yields edged higher as bond traders weigh persistent inflation against a resilient economy, with less urgency for monetary easing.
Equity Markets:
Slightly hotter inflation and improved factory activity brings mixed reactions. Investors could become cautious over reduced chances of Fed rate cuts, but healthy manufacturing data may fuel selective equity support.
Commodities:
Gold and other non-yielding assets faced modest headwinds from a stronger USD and rising yields.
In summary:
U.S. inflation data for June shows headline and annual CPI above forecast, and core inflation still rising, suggesting persistent price pressures. The Empire State Manufacturing Index rebounded sharply, signaling improved business sentiment. These surprises likely reinforce expectations for a cautious Federal Reserve, with possible USD gains and ripple effects across equity, bond, and commodity markets.
#DXY #DOLLAR

### **Bearish Analysis of DXY (U.S. Dollar Index)**### **Bearish Analysis of DXY (U.S. Dollar Index)**
The U.S. Dollar Index (DXY) has recently shown a weak trend, with a prevailing bearish sentiment in the market. The primary factors driving this outlook include:
### **1. Rising Expectations of Fed Rate Cuts**
- Recent weak U.S. inflation data (such as May's PPI and CPI) have reinforced market expectations that the Fed may cut rates as early as September.
- Morgan Stanley predicts the Fed could implement a cumulative 175 basis points in rate cuts by 2025, further reducing the dollar's appeal.
### **2. Trade Policy Uncertainty**
- The Trump administration has recently threatened new tariffs (e.g., 30% on imports) against the EU, Mexico, and other nations, escalating global trade tensions.
- Wall Street institutions warn that Trump’s tariff policies could trigger capital outflows, putting additional pressure on the dollar.
### **3. Growing Recession Concerns**
- Fears of a U.S. economic "hard landing" are intensifying, particularly due to deteriorating corporate orders, earnings forecasts, and capital expenditure plans, which could weaken the dollar’s safe-haven status.
- The expanding U.S. fiscal deficit (reaching $1.36 trillion this fiscal year) is further eroding confidence in the dollar.
### **4. Technical Weakness**
- Since the beginning of 2025, DXY has fallen by approximately **8.4%**, marking its worst annual start on record.
- The index currently faces key resistance at the **97.80-98.00** range. A failure to break above this level could lead to further declines toward **96.50** or lower.
- RSI and MACD indicators suggest weak short-term rebound momentum, maintaining a bearish bias.
### **5. Risk of Capital Outflows**
- The U.S. "**899 Asset Tax**" proposal could increase costs for foreign investors holding dollar-denominated assets, potentially accelerating global divestment from the dollar.
- Goldman Sachs estimates that the dollar remains **overvalued by ~15%**, leaving room for further depreciation.
### **Outlook**
In the near term, DXY’s movement will depend on:
- **June CPI Data** (A lower-than-expected reading could reinforce rate cut expectations, further weakening the dollar).
- **Trade Negotiation Developments** (Escalating tensions may trigger risk-off sentiment, while easing could relieve dollar pressure).
- **Fed Policy Signals** (More explicit dovish guidance could extend the dollar’s downtrend).
**Conclusion:** Given multiple bearish factors, the U.S. Dollar Index is likely to remain weak in the short term. Traders should closely monitor key economic data and policy shifts.
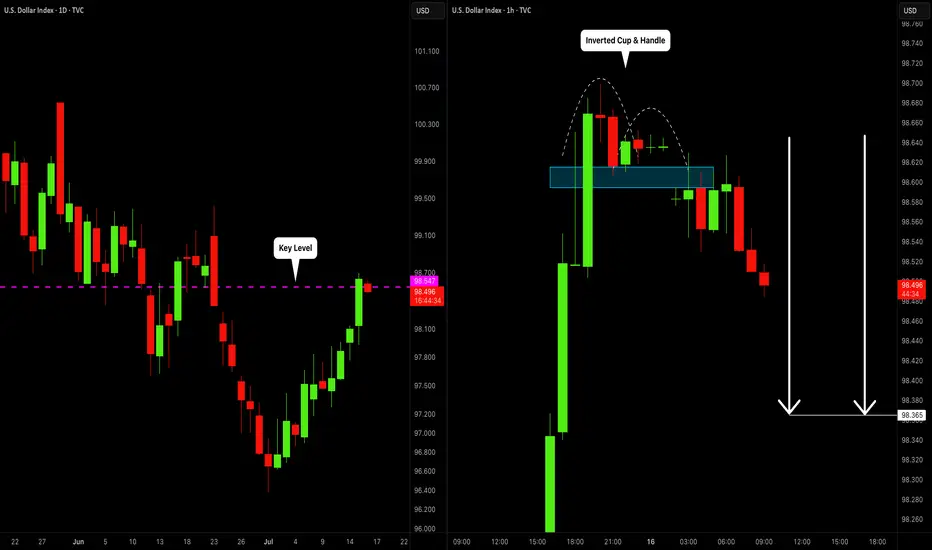
DOLLAR INDEX (DXY): Bearish Move From Key Level
I think that Dollar Index may drop from a key daily horizontal resistance level.
As a confirmation, I spotted an inverted cup & handle pattern on an hourly time frame
and a bearish violation of its neckline.
The market will most likely continue falling at least to 98.36
❤️Please, support my work with like, thank you!❤️
Dollar MoonHey,
Been a while that I shared a chart here, sorry for that.
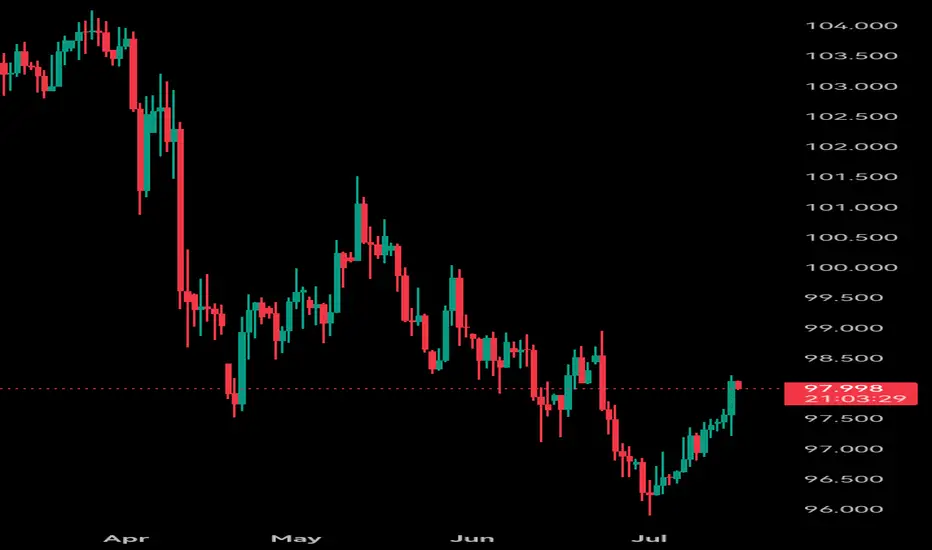
I love the place where the dollar is at the moment.
The easiest plays are from these long-term value areas, and this one is also stacked with a trendline making it a bit more obvious for everyone.
The daily trend is broken since yesterday, shifting bullish long-term. I think a daily pullback is likely, perhaps even back to daily lows to fill up demand.
But long-term, I am super bullish for the dollar.
The $ has been bullish since 2008, we all see it.
Time for the next leg up.
Let's go!
Kind regards,
@ mnieveld

Mid-Week FX Profile UpdatesMid-Week FX Profile Update with Daily and Weekly Overlays
USDJPY
EURUSD
GBPUSD
GOLD

Dollar Major BottomDollar has just finished a major zigzag correction. I was correct, in my last idea, of calling one more leg lower before this major low. Watch for the dollar to PUMP in 5 waves!

Dollar Index Having Bullish MomentumDollar Index shown good bullish momentum on previous day as we analyzed it earlier. Index has created a imbalance now the possibility for the index is to retrace back to imbalance and continue the bullish momentum and target towards the supply zone and swing high.

FX Matrix: DXY, GBPUSD, EURUSD Weekly UpdateWeekly Targets:
DXY: 98.138 - 98.261
GBPUSD: 1.34148 - 1.33606
EURUSD: 1.14463

DXY: potentially aiming for January 2025 highsAlthough we do not Trade the dollar specifically, it is a good barometer the feel out other assets.
It seems like DXY reached a MONTHLY LEVEL. I expect price to form a FVG within this rectangle on the daily level. Which will eventually create a GAP on one of the currencies. Will follow up when this happens.
IMO reversed and is going to reach the daily level quick. This will mean, POUND, EURO DOWN.
USD Falling Wedge Breakout - Bulls Continue to Turn the TideThe USD showed oversold conditions via RSI on both the daily and weekly chart as we began Q3. But, so far, the new quarter has shown a change-of-pace, as the currency has continued to rally with another topside breakout today around CPI data.
The breakout today happened at a big spot - as the long-term fibonacci level at 97.93 had previously helped to hold support back in April, leading to the bounce that ran into May. More recently that price had come in as resistance, until this morning's breakout. And it was in the immediate aftermath of the CPI release that buyers came in to hold the low at that exact level five minutes after the data dropped, and that led to a strong breakout in the USD as bulls took over.
The move is still fresh, however, as we haven't yet seen 23.6% of the sell-off from H1 get clawed back. The retracement from that move plots at 99.63, with the 100.00 level sitting overhead. Below that price, the 99.39 level remains notable as this was a June swing high, and now functions as a follow-through resistance level.
Bigger picture, it's the 101.65-102.00 zone that bulls will need to show up at to make this into anything more than a corrective pullback in a broader bearish trend. - js

DXY Bearish The DXY is currently positioned at a critical level, experiencing significant volatility. It appears to be transitioning between key zones, with a potential shift from the 98.058–97.917 range into a bearish move. If confirmed, the index could target lower levels around 95.5 to 94.00

DXY REBOUNDS AFTER FORMING A DIVERGENCE!DXY rebounds after forming a divergence! Technically, we approach a pullback resistance level. What do we expect next from DXY? Is this gonna be a new era of dollar strength? From the technical standpoint, if we get a break above 99.202 we’re likely to see more bullish strength development away from this market.

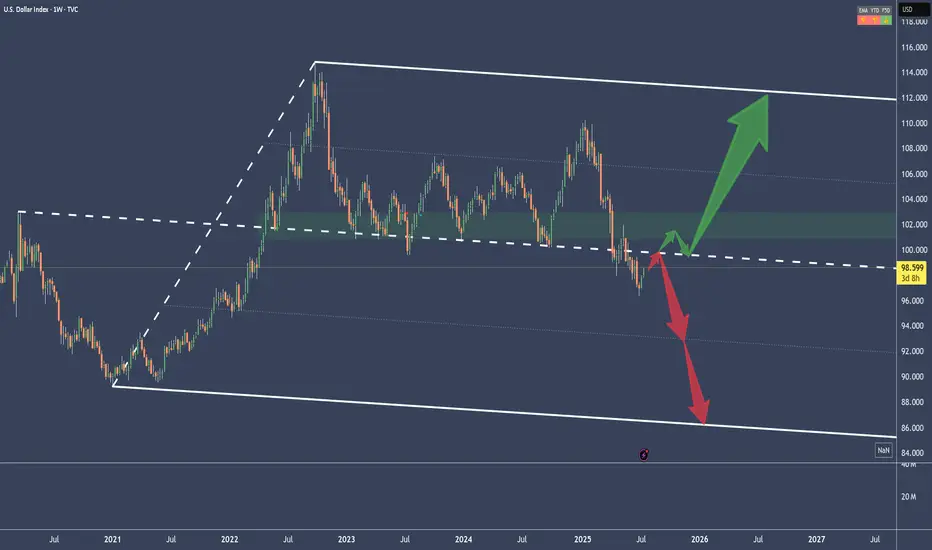
DXY - USD Index: either 86 or 112If the current pullback can break above the Centerline, then massive upside is on the plate.
But if it gets rejected, massiv downside is possible.
We don't know yet.
Just let the market tell you.
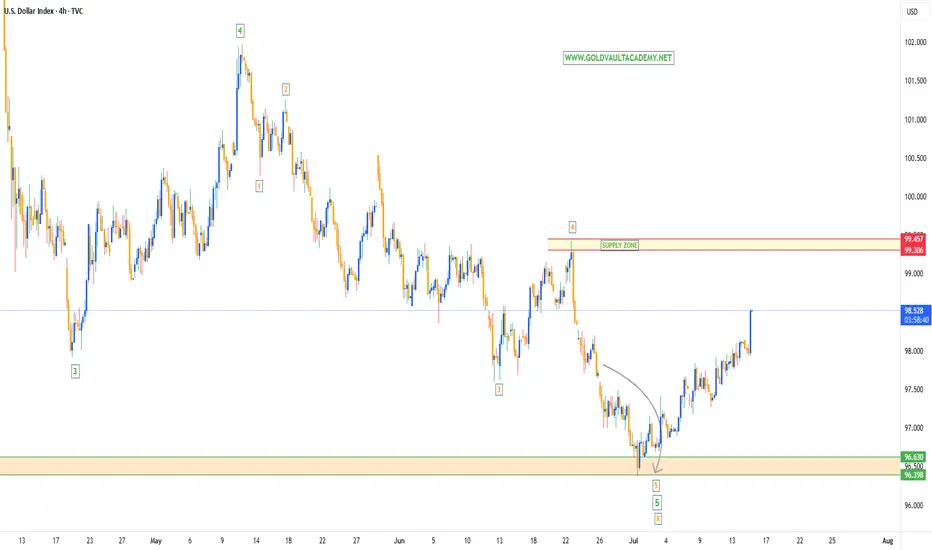
Dollar Index Bullish OverviewThe Dollar moving Bullish as we expect it to within the Gold Fund! As soon as we saw a '5 Bearish Wave Completion' on the DXY, straight away buyers entered the market & start pushing price back up.
My Gold Fund investors & Gold Vault Academy students know from our 'Q3 Market Breakdown Report' what we're expecting for the Dollar in the next 3 months.
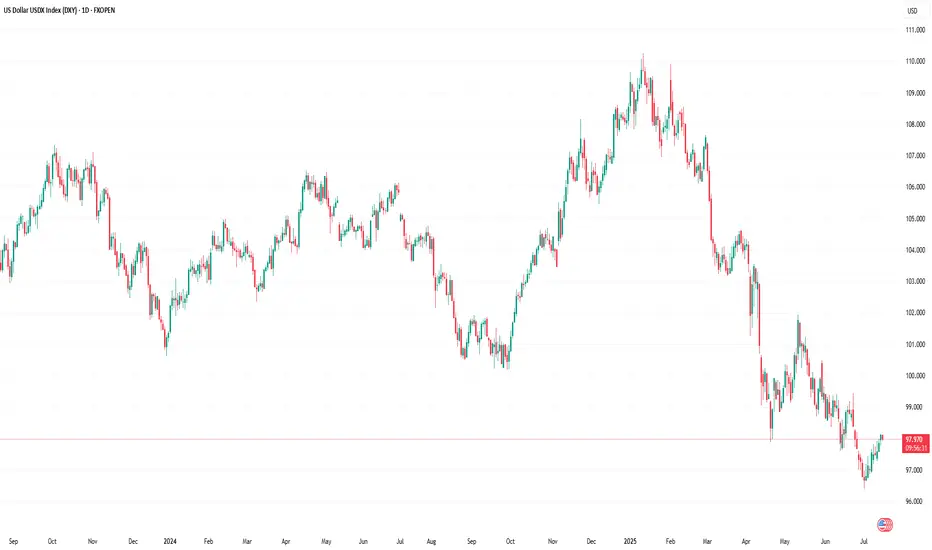
A Closer Look at the Role and Recent Volatility of the (DXY)A Closer Look at the Role and Recent Volatility of the US Dollar Index (DXY)
We don’t even need to say that the US Dollar Index (DXY) is one of the most influential benchmarks in global currency markets. The index, which measures the value of the US dollar against a basket of six major currencies, experiences heightened volatility and presents potential opportunities.
Understanding the DXY: A Macro Lens on the Dollar
The DXY tracks the relative strength of the US dollar versus a weighted currency basket including the euro, Japanese yen, British pound, Canadian dollar, Swedish krona, and Swiss franc. Although the euro comprises nearly 58% of the index, the DXY reflects broad USD strength or weakness across global markets, not just against a single currency.
Traders and analysts use the DXY as a key macro indicator—to track policy divergence between central banks, to hedge USD exposure, and to assess broader market sentiment. Rising DXY levels often signal tightening US policy or global risk aversion, while declines may reflect weakening growth expectations, dovish Fed policy, or geopolitical stress. In volatile environments like 2025, the DXY serves as a real-time barometer of global confidence in the US economy and dollar-based assets.
Recent Price Swings: Tariffs & Policy Uncertainty Shake the Dollar
Since April, the US Dollar Index has faced one of its most volatile stretches in years, driven by a convergence of Federal Reserve policy uncertainty and new trade tariffs announced by President Trump.
April: “Liberation Day” Tariffs Trigger Market Shock
On 2 April, the announcement of sweeping “Liberation Day” tariffs—10% on nearly all imports, with higher duties on selected countries—jolted currency markets. The DXY fell over 2% in a single day. In the following weeks, the index continued to decline as business confidence deteriorated and early signs of recession risk emerged.
May–June: Policy Headwinds Compound Dollar Weakness
As the tariff package took effect, the dollar extended its slide—marking a ~10% drop from its late‑2024 peak, the worst first-half performance in over 50 years. Investors reassessed US growth prospects amid the pressures of trade friction. The Fed responded with a hawkish pause, while President Trump publicly urged for rate cuts, further muddying the policy outlook and pressuring the dollar.
July: Uncertainty Builds
By early July, the DXY had fallen below 97, tallying an approximate 11% year-to-date decline. Analysts cite a “perfect storm” of expanding fiscal deficits, erratic trade decisions, and growing doubts over US policy credibility as key reasons for the dollar’s fall from favour.
Why DXY Matters Now More Than Ever
The DXY has become a real-time gauge of market confidence in US policy stability. The dollar’s sharp decline in 2025 underscores how fragile that confidence can be in the face of aggressive trade measures and uncertain monetary direction.
The introduction of Trump’s tariffs has raised structural concerns among investors:
- Growth expectations have been cut due to higher input costs and supply chain friction.
- The so-called safe-haven appeal of the USD has eroded, with flows shifting to the euro, Swiss franc, and gold.
- Foreign demand for dollar assets has softened, as fears of a prolonged trade conflict and fiscal indiscipline mount.
In this climate, the DXY has evolved into a barometer for geopolitical tension, inflation fears, and investor sentiment towards US leadership.
Bottom Line
The DXY is not just a tool for dollar specialists—it's a key reference for any trader dealing with macro-sensitive instruments. As the global rate environment continues to shift and the US economy shows mixed signals, the DXY may become one of the most revealing indicators to watch and trade in the second half of 2025.
This article represents the opinion of the Companies operating under the FXOpen brand only. It is not to be construed as an offer, solicitation, or recommendation with respect to products and services provided by the Companies operating under the FXOpen brand, nor is it to be considered financial advice.
DXY wants upBut first we retest that trendline.
Giving us a brief window for risk on.
Maybe even until Q1 2025.
Hopefully.
(I'm biased)
deepseek→→U.S. Dollar Index (DXY) Recent Analysis and Outlookchina deepseek↓↓
### **U.S. Dollar Index (DXY) Recent Analysis and Outlook**
#### **1. Current Market Trends and Driving Factors**
- **Trade Policies Boost the Dollar**: U.S. President Trump recently announced new tariffs on Canada (35%), the EU, and Mexico (30%), triggering risk-off sentiment and pushing the Dollar Index (DXY) from 97.20 to around 98.00.
- **CPI Data as a Key Variable**: The U.S. June CPI data, released today (July 15), will influence market expectations for Fed rate cuts. Stronger-than-expected inflation could reinforce the dollar's rally, while weak data may weaken it.
- **Shift in Market Sentiment**: Unlike the "dollar sell-off" trend in early 2025, recent market reactions have leaned toward treating the dollar as a "safe-haven asset" rather than selling it solely due to trade war concerns.
#### **2. Technical Analysis**
- **Key Resistance and Support Levels**:
- **Resistance**: 97.80-98.00 (short-term critical range). A breakout could test 98.50 or even 99.00.
- **Support**: 97.50 (50-day moving average). A drop below may target 96.38 (June low).
- **Technical Indicators**:
- **MACD**: A golden cross has formed on the daily chart, but it remains below the zero line, suggesting the current rebound may still be corrective.
- **RSI**: Near the 50 neutral zone, not yet overbought, indicating room for further upside.
#### **3. Short-Term and Long-Term Outlook**
- **Short-Term (1-2 Weeks)**:
- **Bullish Scenario**: If CPI data is strong and DXY breaks above 98.20, it could challenge 98.50-99.00.
- **Bearish Scenario**: Weak CPI data or progress in trade talks may push DXY back to 97.30-96.50.
- **Long-Term (Second Half of 2025)**:
- **Structural Pressures Remain**: Despite the short-term rebound, the dollar still faces long-term challenges, including widening U.S. fiscal deficits, de-dollarization trends, and concerns over Fed independence.
- **Historical Trend**: After falling over 10% in the first half of 2025, DXY may continue its downtrend in the second half, though the pace of decline could slow.
#### **4. Key Risk Factors**
- **Fed Policy**: If CPI data reinforces a "higher-for-longer" rate outlook, the dollar may strengthen further. Conversely, rising rate-cut expectations could weigh on the dollar.
- **Geopolitics and Trade Talks**: Compromises from the EU or Mexico could reduce safe-haven demand, while failed negotiations may fuel further dollar gains due to risk aversion.
### **Conclusion**
The DXY is at a critical juncture, with short-term direction hinging on CPI data and trade policy developments. Technicals lean bullish, but long-term fundamentals remain challenging. Traders should closely monitor the 98.00 breakout and today’s CPI data impact.
