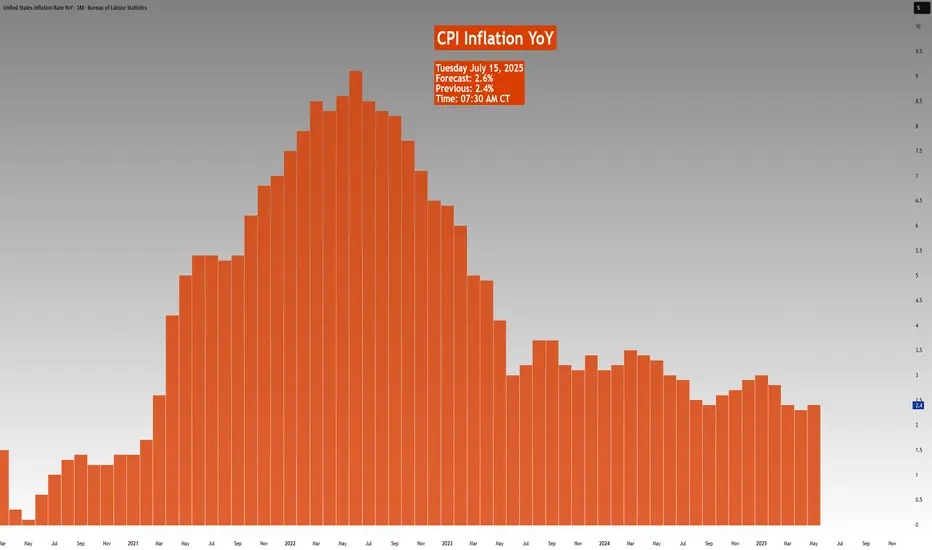
$USIRYY -U.S Inflation Rate Seen Rising for 2nd Month (June/2025ECONOMICS:USIRYY
June/2025
source: U.S. Bureau of Labor Statistics
- The annual inflation rate in the US likely accelerated for the second consecutive month to 2.7% in June, the highest level since February, up from 2.4% in May.
On a monthly basis, the CPI is expected to rise by 0.3%, marking the largest increase in five months.
Meanwhile, core inflation is projected to edge up to 3% from 2.8%. Monthly core CPI is also anticipated to climb 0.3%, up from 0.1% in May, marking its sharpest increase in five months.
USIRYY trade ideas

Weekly Macro Brief: Chinese Economic Data, US Inflation, Tariff CME_MINI:ES1! CME_MINI:NQ1! COMEX:GC1! CME:BTC1! CME_MINI:RTY1! COMEX:SI1! CME_MINI:MNQ1! NYMEX:CL1! CME_MINI:M6E1! CBOT:ZN1! CME_MINI:MES1!
Highlights this week include Chinese economic data points, UK CPI, US CPI, PPI, and Retail Sales. Inflation data is key, as it comes ahead of the Fed's meeting on July 30th, 2025.
Market participants, including institutional investors and futures brokers like EdgeClear, will be scrutinizing these data points closely to monitor global growth and underlying inflation pressures.
Fed speakers are scheduled throughout the week. With increasing calls for Fed Chair Powell voluntary resignation and impeachment, the US administration desiring lower rates, the Fed’s independence and credibility to carry out its dual mandate is at risk. It will be interesting to monitor who folds first. Last week’s FOMC minutes revealed a divided Fed on the interest rate outlook, affirming its June dot plot.
On the fiscal policy front, we are already witnessing a shift in global trade policies, with many nations making concessions to negotiate trade deals with the world’s largest economy. In our analysis, the inflation impact of tariffs may not show up until Q4 2025 or early 2026, as tariff threats are mostly used as a lever to negotiate deals. While effective tariff rates have increased, as Trump reshapes how tariffs are viewed, cost pass-through to consumers will be limited in Q3 2025, as companies’ front-loaded inventory helps mitigate the risks of increased tariff exposure.
So, what we have is an interesting development shaping up where, while inflation may rise and remain sticky, it is yet to be seen whether slowing consumer spending will weaken enough to the point where companies have to start offering discounts, which would nullify the tariff risk to the end consumer and result in companies absorbing all tariffs. This scenario will see reduced earnings margins leading into the last quarter and early 2026. However, it will materially reduce risks of higher inflation.
In summary, the complex interplay between tariffs, inflation, and consumer behavior presents critical considerations for traders. EdgeClear, as a dedicated futures broker, remains focused on equipping clients with the insights needed to help navigate this evolving macroeconomic environment.
Overnight Data Recap:
• Chinese Trade Balance (CNY)(Jun) 826.0B (Prev. 743.6B)
• Chinese Trade Balance USD* (Jun) 114.77B vs. Exp. 109.0B (Prev. 103.22B)
• Chinese Imports YY* (Jun) 1.1% vs. Exp. 1.3% (Prev. -3.4%)
• Chinese Exports YY* (Jun) 5.8% vs. Exp. 5.0% (Prev. 4.8%)
Key Economic Releases:
• MON: EU 90-Day Retaliatory Pause Ends
• TUE: OPEC MOMR, Chinese House Prices (Jun), Retail Sales (Jun), GDP (Q2), EZ Industrial Production (May), German ZEW (Jun), US CPI (Jun), NY Fed Manufacturing (Jul), Canadian CPI (Jun)
• WED: UK CPI (Jun), EZ Trade (May), US PPI (Jun), Industrial Production (Jun)
• THU: Japanese Trade Balance (Jun), EZ Final HICP (Jun), US Export/Import Prices (Jun), Weekly Claims, Philadelphia Fed (Jul), Retail Sales (Jun)
• FRI: Japanese CPI (Jun), German Producer Prices (Jun), US Building Permits/Housing Starts (Jun), Uni. of Michigan Prelim. (Jul)
China GDP / Retail Sales/ Housing (TUE):
• Q2 GDP is expected to slow to 5.1% Y/Y (vs 5.4% in Q1) and 0.9% Q/Q.
• Retail sales have been resilient, but industrial production and investment show signs of weakness; deflation and labor market concerns persist.
• Property prices continue to decline, fueling stimulus speculation; policymakers remain cautious, with only modest easing expected (LPR and RRR cuts in Q4).
US CPI (TUE)
• June CPI expected at +0.3% M/M headline and core, suggesting a modest rebound from May’s subdued figures.
• Inflation impact from tariffs seen as temporary; Fed officials maintain a cautious stance with possible rate cuts only if price pressures stay benign.
• Markets are pricing near-zero odds for a July rate cut, but still expect two 25bps cuts by year-end in line with Fed guidance.
US Retail Sales (THU):
• Headline June retail sales expected flat M/M; ex-autos expected to rise +0.3%, showing signs of consumer stabilization.
• BofA data shows mild spending rebound, though discretionary service spending continues to weaken, especially among lower-income households.
• Spending strength remains concentrated in higher-income cohorts; weakness in wage growth limits broader consumption momentum.
US Trade Tensions – Tariffs & Negotiations:
• Trump announced 30% tariffs on EU and Mexican goods effective August 1st, separate from sector-specific tariffs.
• Trump stated the EU is engaging in talks and South Korea is also pursuing a trade deal.
Mexico Response:
• President Sheinbaum expects a deal before August 1st but reaffirmed Mexican sovereignty is non-negotiable.
• Mexico’s Economy Ministry is negotiating to protect domestic firms and workers, aiming for an alternative resolution.
EU Response:
• European Commission President von der Leyen warned that 30% tariffs would disrupt key transatlantic supply chains.
• The EU will extend suspension of countermeasures until early August but is prepared to respond proportionally if needed.
• The EU prefers a negotiated solution and dropped plans for a digital tax, seen as a concession to US tech interests.
• Separately, the EU is drafting a broad corporate tax on firms with turnover above EUR 50 million to support its budget.
What is Inflation Climate and Weather? Copper is NextThe key driver of most markets — and a major influence on their trends — is inflation.
Once we understand the difference between short-term inflation weather and long-term inflation climate, we can better recognize where risk meets opportunity.
On this half yearly chart. We can see as the close on 30th June, copper settled firmly, closed above its $4.44 resistance that has been tested for years.
This study indicates that copper could be at the beginning of an uptrend. I will be looking out for buying-on-dips opportunities whenever they arise.
Mirco Copper Futures
Ticker: MHG
Minimum fluctuation:
0.0005 per pound = $1.25
Disclaimer:
• What presented here is not a recommendation, please consult your licensed broker.
• Our mission is to create lateral thinking skills for every investor and trader, knowing when to take a calculated risk with market uncertainty and a bolder risk when opportunity arises.
CME Real-time Market Data help identify trading set-ups in real-time and express my market views. If you have futures in your trading portfolio, you can check out on CME Group data plans available that suit your trading needs tradingview.sweetlogin.com

$USIRYY -U.S CPI Below Expectations (May/2025)ECONOMICS:USIRYY 2.4%
(May/2025)
source: U.S. Bureau of Labor Statistics
- The annual inflation rate in the US increased for the first time in four months to 2.4% in May from 2.3% in April, though it came in below the expected 2.5%.
Prices rose slightly more for food, used cars and new vehicles but shelter cost slowed and gasoline prices continued to decline.
Meanwhile, the annual core inflation rate held steady at 2.8%.
On a monthly basis, both headline and core CPI increased by 0.1%, falling short of market expectations.
Mid-Week Outlook Update: US CPI- Trade TalksCPI day today. Scheduled to be released at 7:30 AM CT.
CME:6E1! CME_MINI:ES1! CME_MINI:NQ1! CME_MINI:MNQ1! CME_MINI:MES1! COMEX:GC1! CBOT:ZN1!
ES futures edged slightly higher after positive commentary from US-China trade talks. The delegations from both sides agreed on a framework to move forward with negotiations.
It is important to note that Trade War 1.0 took about two years to formalize and finalize. However, given the previous experience and the current agreement on the framework, our opinion (which is not the consensus) is that the trade deal between China and the US may be closer than what most analysts and investors might otherwise predict.
Like any negotiations, China and the US have previously discussed these difficult issues and have found a way to resolve them. Although the concerns have shifted towards niche sectors, we still view baseline tariffs with some sectors seeing increased tariffs as likely.
TACO (Trump Always Chickens Out) acronym traders will see a tougher stance from Trump to resolve the overarching trade deficit issue with China, particularly the dumping of Chinese goods.
AI, defense technology, chips, and rare earth minerals are at the center of these discussions. There will be targeted controls on exports of chips from the US and exports of rare earth minerals on the Chinese side, despite the current framework and deals agreed. In our view, these controls will be phased out until agreements are finalized, to maintain leverage and show TACO acronym backers that Trump is not “chickening out,” but rather maintaining a strong stance while negotiating trade deals with China and other countries.
In our analysis, despite positive headlines, the overhanging uncertainty has not dissipated. In fact, there is clarity that President Trump is willing to take the difficult road to negotiate from an apparent position of strength. Would this result in extension of trade deadlines or temporary increase in tariffs followed by an extension of deadlines? This remains to be seen!
If May CPI comes in lower than expectations, this will be a nudge in the direction that tariffs are not translating into higher inflation. We may see a rally in index futures.
On the contrary, any increase in CPI above the previous 2.3% YoY increase will be seen as tariff-induced inflation.
In our analysis, given lower energy prices, rent inflation stabilizing at levels last seen in late 2021, and services inflation in the US trending lower from the peak in January 2023, we are seeing embedded inflation in the prior two months and this may remain sticky in today’s release. However, any stability with lower energy prices seen in the prior month will point to a lower inflation print overall.
Comment with your favorite trade idea from our past trade ideas and what you would like to see more of.
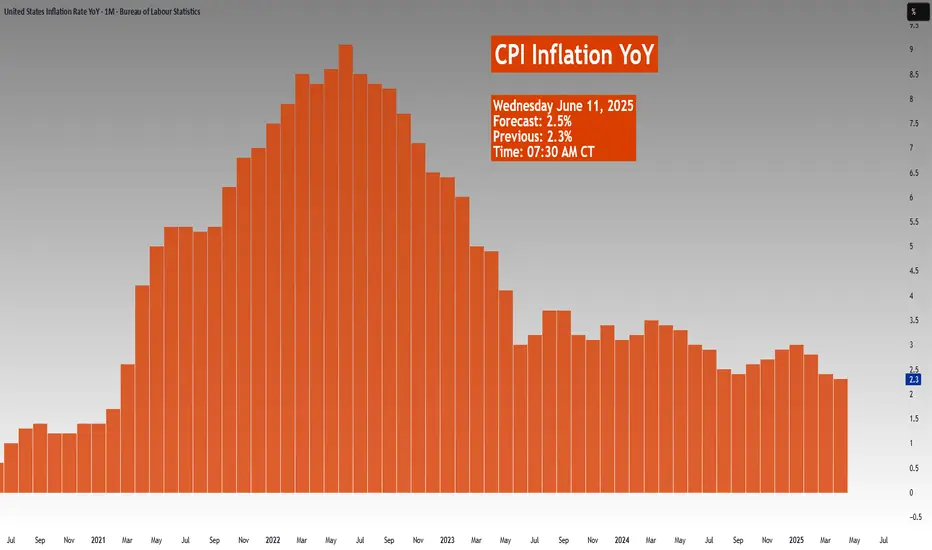
US INFLATION, a decisive figure this week!This week, which runs from Monday June 9 to Friday June 13, sees two fundamental factors which will have a strong impact on the stock market: the continuation of the trade diplomacy phase which is currently acting as a fundamental red thread (particularly between China and the United States) and, above all, the US inflation update according to the PCI price index on Wednesday June 11.
The key issue is to determine whether tariffs in the so-called reciprocal tariffs trade war have begun to trigger a rebound in inflation. This is what the US Federal Reserve (FED) is watching to determine whether or not it should resume cutting the federal funds rate, which has been on hold since last December.
1) Federal funds rate cuts have been on hold since the end of 2024
Unlike the European Central Bank and other major Western central banks, the FED has paused its key interest rate cut since the beginning of the year. The ECB's key interest rate, meanwhile, has been cut several times and now stands at 2.15%, i.e. a key interest rate considered neutral for the economy (i.e. neither an accommodating nor a restrictive monetary policy).
This divergence in monetary policy between the FED and the ECB is perceived as a risk by the market, while the trade war could end up having a negative impact on US economic growth.
2) The market does not expect the FED to resume cutting rates before September.
But Jerome Powell's Federal Reserve (FED) is taking a hard line, believing that the Trump Administration's trade war could undermine its efforts to fight inflation. Although the FED's inflation target of 2% is not far off, according to the latest ECP and CPI updates, the FED wants confirmation that companies have not passed on sharp price rises to compensate for the tariffs. This is why the inflation figures published this May have a decisive dimension at a fundamental level. The Fed will be able to resume cutting the federal funds rate if, and only if, disinflation is not threatened by the trade war.
3) This is why the ICP US inflation update on Wednesday June 11 is the fundamental highlight of the week.
This Wednesday, June 11, we'll be keeping a very close eye on the publication of US inflation according to the ICP. The monthly reading will be closely watched, as will the year-on-year nominal and underlying inflation rates.
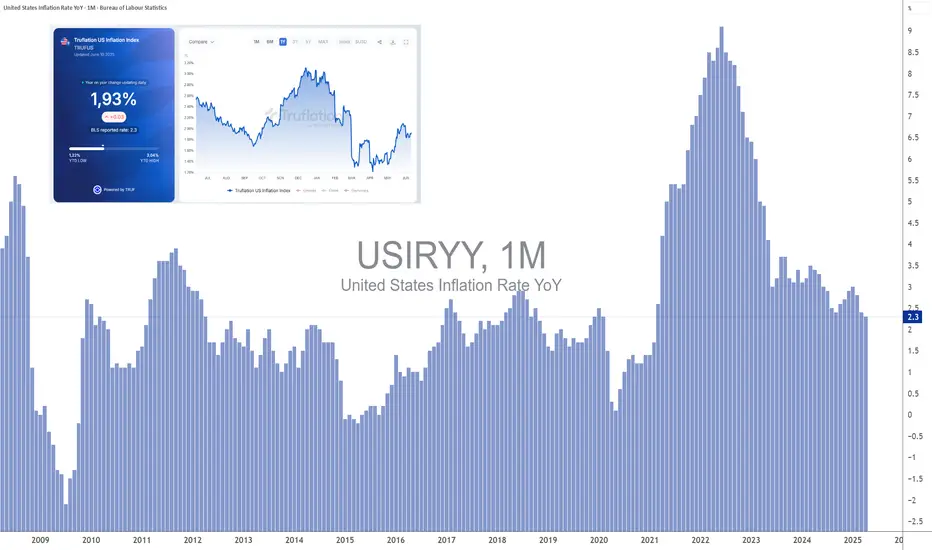
The consensus is relatively pessimistic, with inflation expected to rebound at both monthly and annual rates. Real-time inflation, as measured by TRUFLATION, is still under control, so the pessimistic consensus may be overturned.
DISCLAIMER:
This content is intended for individuals who are familiar with financial markets and instruments and is for information purposes only. The presented idea (including market commentary, market data and observations) is not a work product of any research department of Swissquote or its affiliates. This material is intended to highlight market action and does not constitute investment, legal or tax advice. If you are a retail investor or lack experience in trading complex financial products, it is advisable to seek professional advice from licensed advisor before making any financial decisions.
This content is not intended to manipulate the market or encourage any specific financial behavior.
Swissquote makes no representation or warranty as to the quality, completeness, accuracy, comprehensiveness or non-infringement of such content. The views expressed are those of the consultant and are provided for educational purposes only. Any information provided relating to a product or market should not be construed as recommending an investment strategy or transaction. Past performance is not a guarantee of future results.
Swissquote and its employees and representatives shall in no event be held liable for any damages or losses arising directly or indirectly from decisions made on the basis of this content.
The use of any third-party brands or trademarks is for information only and does not imply endorsement by Swissquote, or that the trademark owner has authorised Swissquote to promote its products or services.
Swissquote is the marketing brand for the activities of Swissquote Bank Ltd (Switzerland) regulated by FINMA, Swissquote Capital Markets Limited regulated by CySEC (Cyprus), Swissquote Bank Europe SA (Luxembourg) regulated by the CSSF, Swissquote Ltd (UK) regulated by the FCA, Swissquote Financial Services (Malta) Ltd regulated by the Malta Financial Services Authority, Swissquote MEA Ltd. (UAE) regulated by the Dubai Financial Services Authority, Swissquote Pte Ltd (Singapore) regulated by the Monetary Authority of Singapore, Swissquote Asia Limited (Hong Kong) licensed by the Hong Kong Securities and Futures Commission (SFC) and Swissquote South Africa (Pty) Ltd supervised by the FSCA.
Products and services of Swissquote are only intended for those permitted to receive them under local law.
All investments carry a degree of risk. The risk of loss in trading or holding financial instruments can be substantial. The value of financial instruments, including but not limited to stocks, bonds, cryptocurrencies, and other assets, can fluctuate both upwards and downwards. There is a significant risk of financial loss when buying, selling, holding, staking, or investing in these instruments. SQBE makes no recommendations regarding any specific investment, transaction, or the use of any particular investment strategy.
CFDs are complex instruments and come with a high risk of losing money rapidly due to leverage. The vast majority of retail client accounts suffer capital losses when trading in CFDs. You should consider whether you understand how CFDs work and whether you can afford to take the high risk of losing your money.
Digital Assets are unregulated in most countries and consumer protection rules may not apply. As highly volatile speculative investments, Digital Assets are not suitable for investors without a high-risk tolerance. Make sure you understand each Digital Asset before you trade.
Cryptocurrencies are not considered legal tender in some jurisdictions and are subject to regulatory uncertainties.
The use of Internet-based systems can involve high risks, including, but not limited to, fraud, cyber-attacks, network and communication failures, as well as identity theft and phishing attacks related to crypto-assets.
$USIRYY - U.S Inflation Rate Unexpectedly Slows (April/2025)ECONOMICS:USIRYY
April/2025
source: U.S. Bureau of Labor Statistics
- The annual inflation rate in the US eased to 2.3% in April, the lowest since February 2021, from 2.4% in March and below forecasts of 2.4%.
Prices of gasoline fell at a faster pace and inflation also slowed for food and transportation.
Compared to the previous month, the CPI rose 0.2%, rebounding from a 0.1% fall in March but below forecasts of 0.3%.
Meanwhile, annual core inflation rate steadied at 2.8% as expected, holding at 2021-lows.
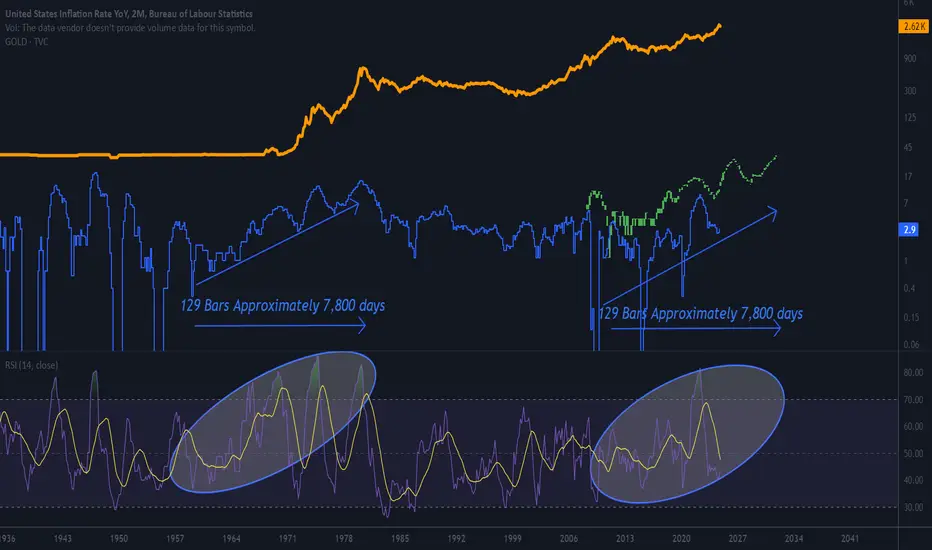
For the last 5 times out of 6.For the last 5 times out of 6.
Gold bottomed when the inflation rate lost a rising support line.
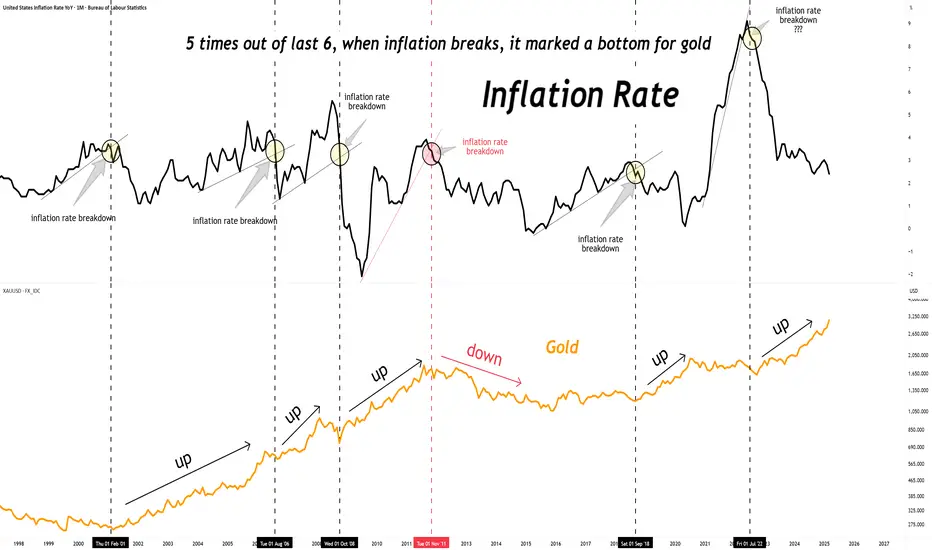
gold and inflation in 1970s stagflation fomc member repeatedly saying this is not stagflation like 1970s
but gold bug on social media constantly pump stagflation narrative after gold historic run from $2000 to $3000 in just one year
with usa cpi and gold chart in one image you can get idea
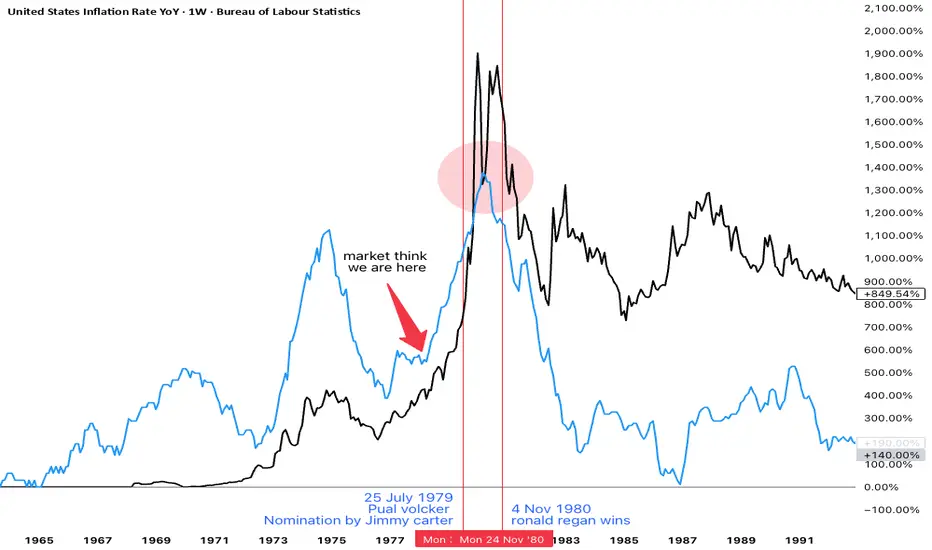
how gold moved in last stagflation crisis with big political news : when paul volcker comes into fed and when Ronald Reagan wins election
gold first makes double top before multi year bear market
inflation peaked after volcker get fed control but before election result.
is this is really replay of 1970s ?
we got same old president trump and same old fed chair powell
✅ biden forced fed to do big size 50bps cut pre election to choose inflation over higher unemployment which is stagflation
✅ in his first term trump in election year March 2020 use covid as excuse to cut 0% and do QE and trillion dollar fiscal policy stimulus check. choosing inflation over high employment which is stagflation but it was biden who has to face most of the inflation spike to 9%
✅trump raise tariff to 100 years high to choose high employment over inflation which is recession
✅ in next 4 years it will be clear is this replay of 70s or not.
in future we will have more inflation and gold price data to confirm
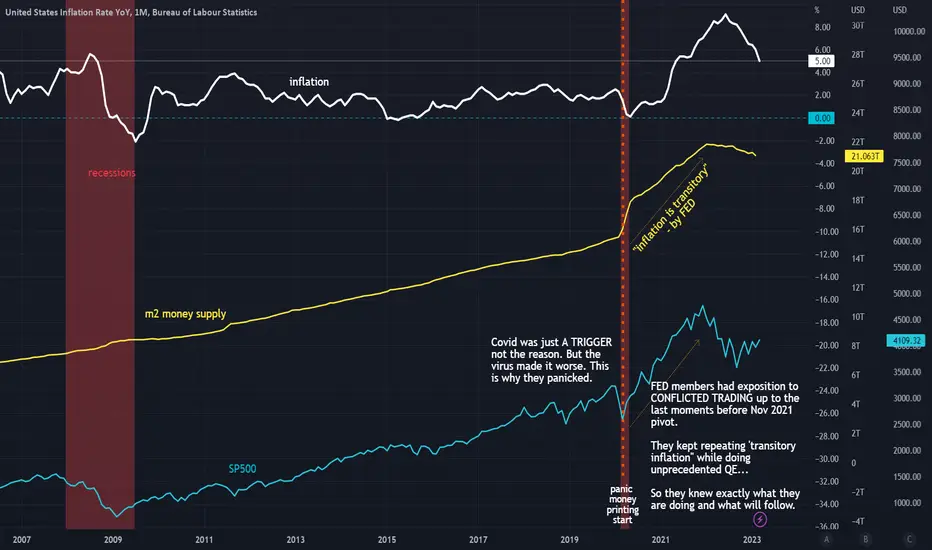
'Inflation is transitory' by FEDFED did that. And it was not elaborate lie. They made money on it. What is next ?
$USIRYY -United States CPI (March/2025)ECONOMICS:USIRYY
(March/2025)
source: U.S. Bureau of Labor Statistics
- The annual inflation rate in the US eased for a second consecutive month to 2.4% in March 2025, the lowest since September, down from 2.8% in February, and below forecasts of 2.6%.
Prices for gasoline (-9.8% vs -3.1%) and fuel oil (-7.6% vs -5.1%) fell more while natural gas prices soared (9.4% vs 6%).
Inflation also slowed for shelter (4% vs 4.2%), used cars and trucks (0.6% vs 0.8%), and transportation (3.1% vs 6%) while prices were unchanged for new vehicles (vs -0.3%).
On the other hand, inflation accelerated for food (3% vs 2.6%).
Compared to the previous month, the CPI decreased 0.1%, the first fall since May 2020, compared to expectations of a 0.1% gain.
The index for energy fell 2.4%, as a 6.3% decline in gasoline more than offset increases in electricity (0.9%) and natural gas (3.6%).
Meanwhile, annual core inflation eased to 2.8%, the lowest since March 2021, and below forecasts of 3%.
On a monthly basis, the core CPI edged up 0.1%, below expectations of 0.3%.
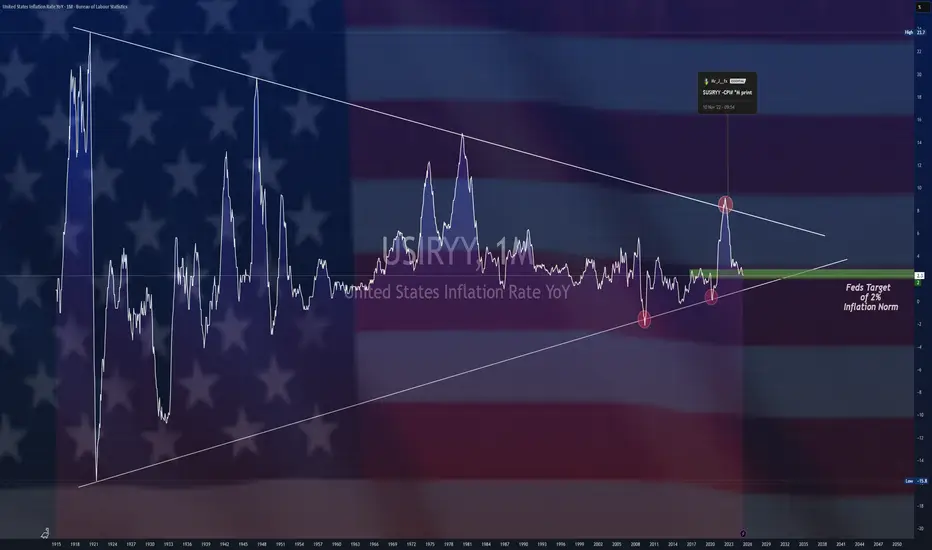
Inflation rate vs FED FUNDS RATEThe inflation rate and the Federal Funds Rate are deeply interconnected, with the Federal Reserve using the latter as a primary tool to manage the former. When inflation rises above the Fed's target (typically around 2%), the Fed often increases the Federal Funds Rate to tighten monetary policy. Higher rates make borrowing more expensive, which can reduce consumer spending and business investment, thereby slowing economic activity and helping to curb inflationary pressures. Conversely, when inflation is too low or the economy is sluggish, the Fed may lower the Federal Funds Rate to stimulate borrowing, spending, and investment, which can help boost economic activity and push inflation toward the target. However, this relationship is influenced by external factors such as supply chain disruptions, energy prices, and global economic conditions, which can complicate the Fed's ability to control inflation solely through rate adjustments. For example, during periods of supply-driven inflation (like during a oil price shock), raising rates may have limited immediate impact on inflation but could still be used to anchor inflation expectations. Thus, the Fed's management of the Federal Funds Rate in response to inflation reflects a balancing act between stabilizing prices and supporting sustainable economic growth.

Inflation Leading Indicator Data with Agricultural Commodities Inflation leading indicator data is not derived solely from CPI numbers; more importantly, we must consider what drives these CPI numbers. By understanding this, we can stay ahead of the mass market.
Looking at past trends, we can observe that CPI numbers and agricultural commodities tend to move in tandem.
In this discussion, we will explore why agricultural commodities are an effective tool for projecting inflation direction and examine where these commodities may be heading.
Micro Agriculture Futures:
. Corn: MZC
. Wheat: MZW
. Soybean: MZS
. Soybean Oil: MZL
. Soybean Meal: MZM
Disclaimer:
• What presented here is not a recommendation, please consult your licensed broker.
• Our mission is to create lateral thinking skills for every investor and trader, knowing when to take a calculated risk with market uncertainty and a bolder risk when opportunity arises.
CME Real-time Market Data help identify trading set-ups in real-time and express my market views. If you have futures in your trading portfolio, you can check out on CME Group data plans available that suit your trading needs tradingview.sweetlogin.com
Trading the Micro: www.cmegroup.com

$USIRYY - U.S Inflation Rate Slows More Than ExpectedECONOMICS:USIRYY 2.8% YoY
(February/2025)
source: U.S. Bureau of Labor Statistics
- The annual inflation rate in the US eased to 2.8% in February below 3% in January and market expectations of 2.9%.
On a monthly basis, the CPI rose by 0.2%, slowing from 0.5% rise in January and below market expectations of 0.3%.
Core CPI also rose 0.2% on the month and was at 3.1% on a 12-month basis, both below consensus.
$USIRYY -U.S CPI (January/2025)ECONOMICS:USIRYY 2.9%
(January/2025)
source: U.S. Bureau of Labor Statistics
- The annual inflation rate in the US likely held steady at 2.9% in January 2025, matching December’s figure, which was the highest since July.
On a monthly basis, the CPI is expected to have risen by 0.3%, slowing from 0.4% in December, with food and energy prices continuing to increase, particularly natural gas.
Meanwhile, annual core inflation, which excludes volatile components such as food and energy, is anticipated to decline for a second consecutive month to 3.1%, marking the lowest level since April 2021.
In contrast, monthly core inflation is projected to edge up to 0.3% from 0.2% in December, driven primarily by an increase in new and used car prices.

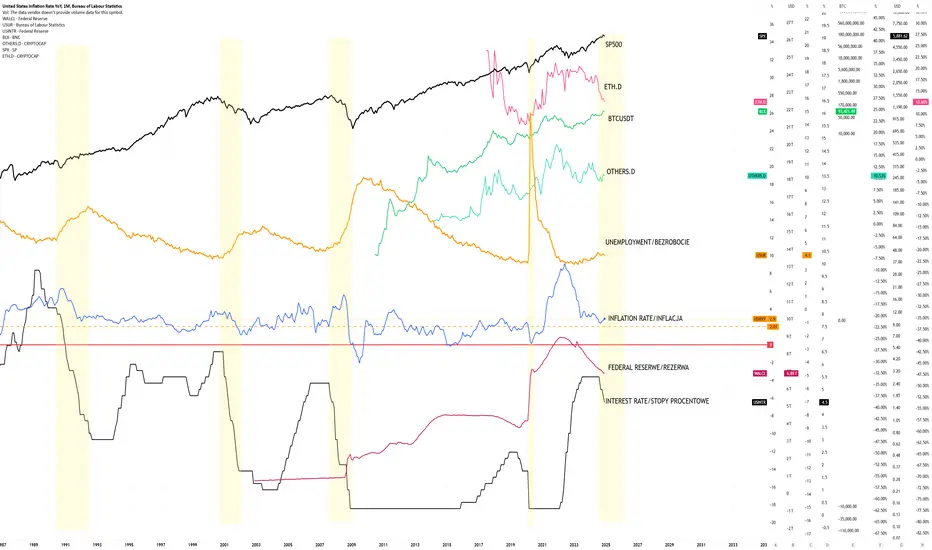
Unemployment - In big pictureThe history of periods when unemployment was rising and key indicators illustrating economic stimulation through interest rate cuts.
For comparison, the impact on BTC and altcoins. Interestingly, throughout Bitcoin's entire history, the best periods have been when unemployment was declining. The only exception was during the COVID era, when the largest amount of money in history was printed, inflating the markets.
Currently, we are facing rising unemployment, unregulated inflation, escalating global conflicts, and a trade tariff war.
How will the stock market and the crypto market react?

The history of periods when unemployment was rising For comparison, the impact on BTC and altcoins. Interestingly, throughout Bitcoin's entire history, the best periods have been when unemployment was declining. The only exception was during the COVID era, when the largest amount of money in history was printed, inflating the markets.
Currently, we are facing rising unemployment, unregulated inflation, escalating global conflicts, and a trade tariff war.
How will the stock market and the crypto market react?
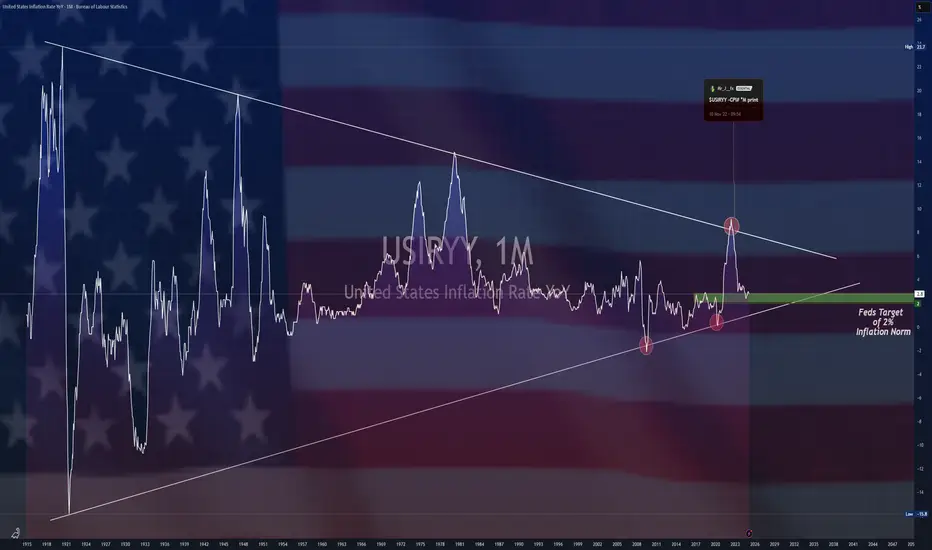
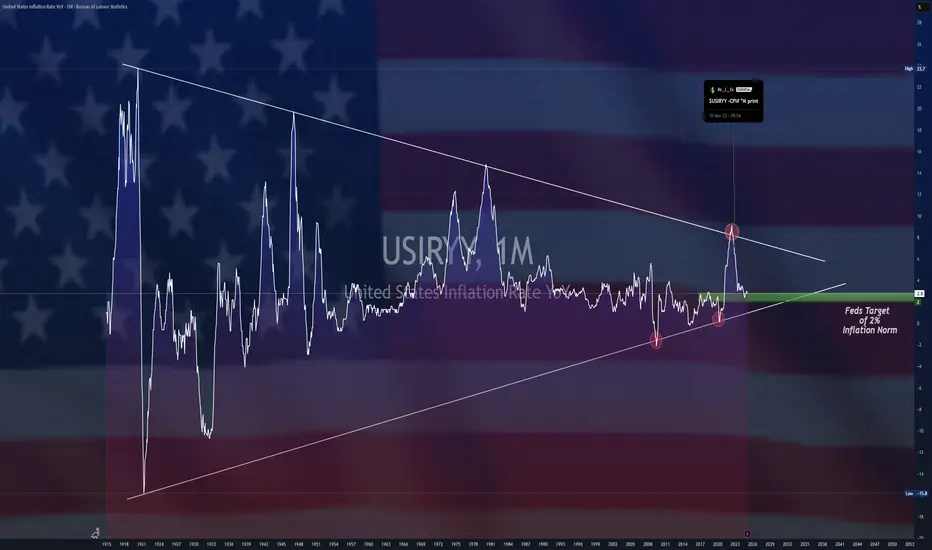
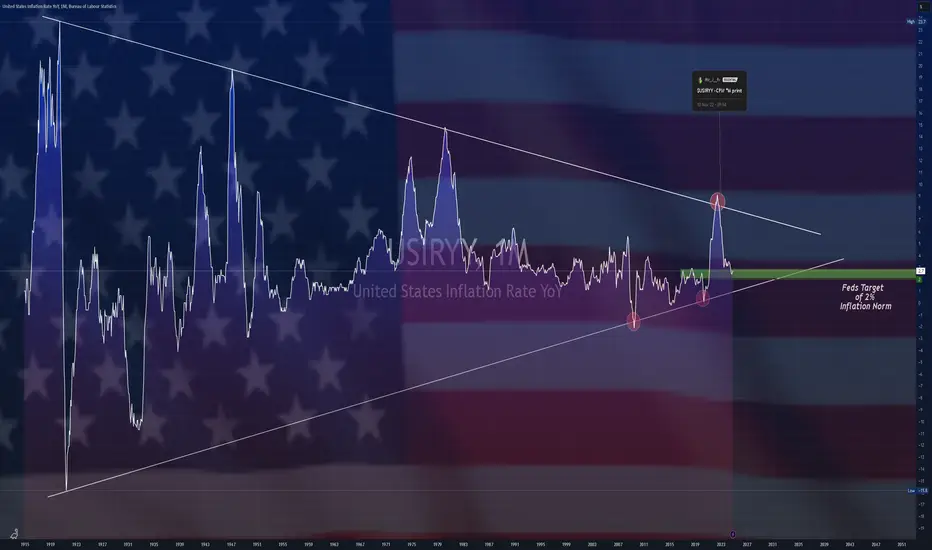
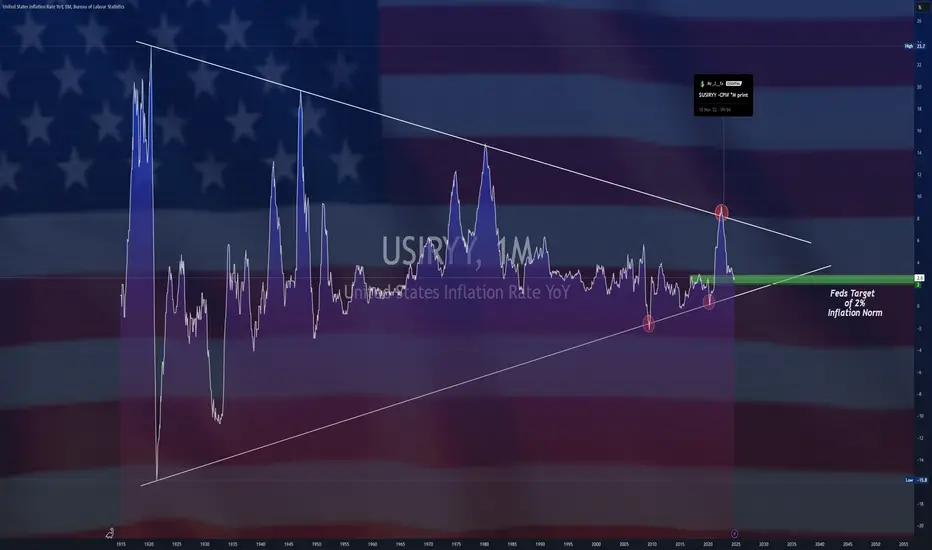
Inflation vs gold correlation 60's to 80's Pattern.Gold seems to like inflation. Or, is inflation food for gold? These are chars that no one is showing you.
According to this chart, Gold has a seven year bull run ahead of it that should top at some point in 2032.
This a chart of the US Inflation rate on the 2 month (Blue line) right from the horses mouth, Bureau of labour statistics. On the top in gold or yellow is the gold chart. As you can clearly see, in the seventies gold was very heavily correlated with inflation. This is not my opinion this is a fact, and it will be again.
THIS IS A 2 FOR ONE GUYS. INFLATION AND GOLD FORCAST ALL IN ONE!!
Let me know what you think down below.
Kind regards,
WeAreSat0shi
TARIFFS Will Lead To Inflation!? NOPE!So many talking heads crying TARIFFS will be inflationary,
but it’s mostly uneducated fear-mongering.
Let’s look at the cold, hard USIRYY and CPI data to figure out the truth behind this.
From March 2018 through September 2019, President Trump had eight waves of tariff announcements on C-H-I-N-A, plus some steel and aluminum ones on Mexico and Canada.
In order to combat these inflation worries, Trump did what he said he was going to do…
DRILL BABY DRILL.
For the first time since 1949, the US would be a net exporter of oil.
We can see there was a quick spike in inflation from stockpiling imports before tariffs were fully implemented, but inflation quickly plummeted nearly in half as the US became a net exporter.
Fast-forward to today, and coincidentally inflation is at 2.9% which is right around where it was when Trump imposed the tariffs during his last presidency. Funny how that works out, eh ;)
Trump has declared the US will DRILL BABY DRILL bigger than ever, which should lead us to believe that this time is NOT different and inflation will go down again.

$USIRYYY -U.S Inflation Rate (December/2024)ECONOMICS:USIRYY
December/2024
source: U.S. Bureau of Labor Statistics
-The annual inflation rate in the US accelerated for the third consecutive month to 2.9% in December, as expected.
On a monthly basis, the CPI rose by 0.4%, exceeding expectations of 0.3%.
However, annual core inflation slightly decreased to 3.2% from 3.3%, below the anticipated 3.3%. The monthly core rate also eased to 0.2% from 0.3%, in line with expectations.
$USIRYY -U.S CPI (November/2024)ECONOMICS:USIRYY
(November/2024)
source: U.S. Bureau of Labor Statistics
"US Inflation Rate Rises to 2.7%, Matching Expectations "
-The annual inflation rate in the US rose to 2.7% in November,
from 2.6% in October and matching markets expectations pushed up by food cost.
On a monthly basis, the CPI increased by 0.3%, the most since April, slightly above October's 0.2%, driven mostly by higher prices of shelter.
$USIRYY -U.S CPI (October/2024)ECONOMICS:USIRYY @2.6%
(October/2024)
source: U.S. Bureau of Labor Statistics
- US Inflation Rate Picks Up
The annual inflation rate in the US increased to 2.6% in October,
from 2.4% in September and in line with market expectations.
On a monthly basis, CPI rise by 0.2%, consistent with the previous three months with shelter index up 0.4%, accounting for over half of the monthly increase.
Meanwhile, core inflation stayed at 3.3% annually and 0.3% monthly.

A capture of inflation, dilution and stimulus /2024As we see by the chart, we had a series of events mostly around mega-stimulus for Covid and a massive dilution of currency as triggering events. Inflation rose and is now back down close to the desirable 2% inflation.
We don't want prices to go back to where they were, that is deflation and is not healthy for an economy. We want prices to stay near the same year after year with modest inflation. When inflation rises too fast, we increase interest rates to slow down spending, to reduce inflation. The best we can do is work on wage growth to accommodate the inflation from our past years while maintaining modest inflation.
At 2.4% inflation currently, there really is pretty much nothing to fix anymore, we just need to keep it around where it is, a little lower really and work on modest wage growth.
Looking at this data, it really looks like the vast majority of the culpability of that inflation we had came from 2020, one of the single worst years financially as a country with inflation starting to rise immediately in 2021, and exacerbated some in 2021.
Looking at this chart, there is a tangible possibility that we see >10% inflation by 2027
Here is the M2 money supply chart:
