Inflation Data at 6.5% YOYInflation is cooling off big. My Expectation is that we hit 3% before summer and then start cutting rates from then on.
Dollar is getting sold off hard. Risk assets are in play!
USIRYY trade ideas
U.S. Consumer Price Index's forecast, and there is no big changeThere is no major change in the figure, which is the same as the U.S. CPI YoY standard estimate.
The price stabilization section is entering because it has decreased compared to the previous month, but it is too early for the Fed to proceed with its policy pivot.

Inflation has peakedLooking for reversal in inflation, for now. May have another peak later but we should get temp relief. Once again, everyone and their mom talking about it...

Number of Sunspots and Inflation CYCLESHi friends
Today im going to explain about the relationship between Sunspot Numbers and Inflation rate from 1960 to now.
so lets start with inventor of this theory : William Stanley Jevons's
In 1875 and 1878 Jevons read two papers before the British Association which expounded his famous "sunspot theory" of the business cycle.
Digging through mountains of statistics of economic and meteorological data,
Jevons argued that there was a connection between the timing of commercial crises and the solar cycle.
it called 5.31-Year Cycle too.
In the stock market and in the economy, there are both natural frequencies and artificial excitation frequencies.
The four-year presidential election cycle is a great example of an excitation frequency, and it has demonstrable effects on stock prices.
The schedule of FOMC meetings 8x per year is another possible example of an artificial excitation frequency.
When a demonstrable cycle period appears that one cannot tie to some manmade excitation frequency,
then the supposition is that it is a "natural" frequency of the economic system.
Something about the economy or the market results in an oscillation on a certain frequency which may not have a good outside explanation.
Perhaps it is in how money flows. Perhaps it is in how human brains make decisions about surplus and scarcity. It is hard to know.
This 5.31-year frequency in the CPIs cycle seems to fall into that category as a natural cycle,
because the 5.31-year period does not match any known excitation frequency related to human activity nor the economic calendar.
So that makes it probably a natural frequency.
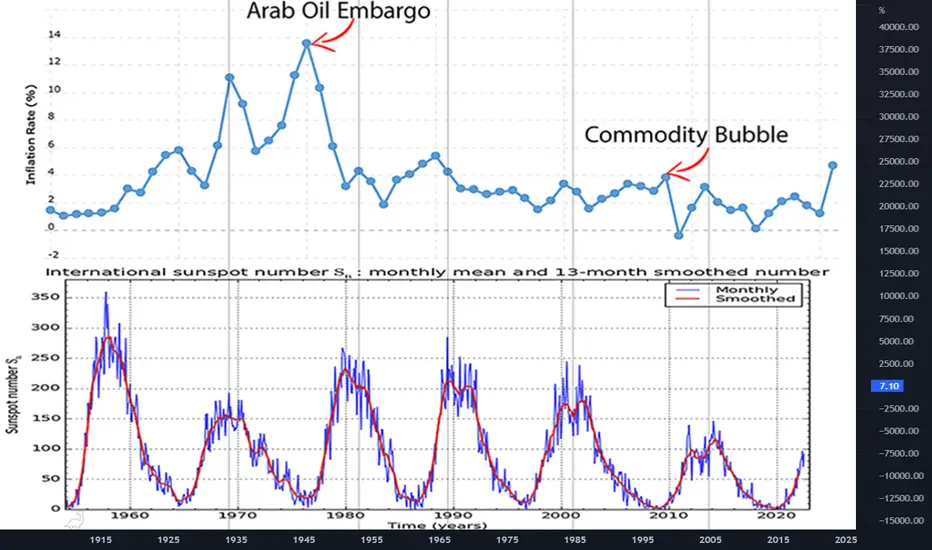
In above chart , there does seem to be a relationship between sunspots and the inflation rate.
We see lots of instances when the peak of the sunspot cycle coincided with the peak of the inflation rate.
There have been spikes in the inflation rate not tied to the sunspot cycle, such as the spike during the Arab Oil Embargo of 1973-74.
this examples did, interestingly, come at the halfway point of the sunspot cycle, fitting the half-period harmonic principle(5.31 year cycle).
The current rise in inflation fits both the longstanding 5.31-year cycle and the upswing in the sunspot cycle.
Solar researchers expect the current sunspot cycle rise to end in July 2025, which is 3 years from now.
But the 5.31-year cycle says a top in the inflation rate is expected right now.
That would mean seeing the inflation rate bottoming around 2025 just as the sunspot cycle is peaking.
Sometimes cycles present us with conflicts that are hard to reconcile.
The point of the 5.31-year cycle that we can take away for right now is that the inflation rate should be falling for the next ~2.2 years.
But that does not mean we get to zero percent inflation right away.
The drops take a while to unfold. Inflation is likely with us for a while, and we have to get used to that idea.
Monthly Macro DigestSo, you want to get rich do yah? You either feel like the smartest person in the world (.001%), or hopeless and stupid (99.999%). For most, it's by pure chance and circumstance that they understand the mechanism by which they succeed. When were you born? When will you retire? Did you go to war or build a career? What is money anyway? How do I fit into all of this? Who's controlling all of this?
It's all one big game. Show up at the right places at the right time and you can play too. Don't get disappeared or go nuts folks!

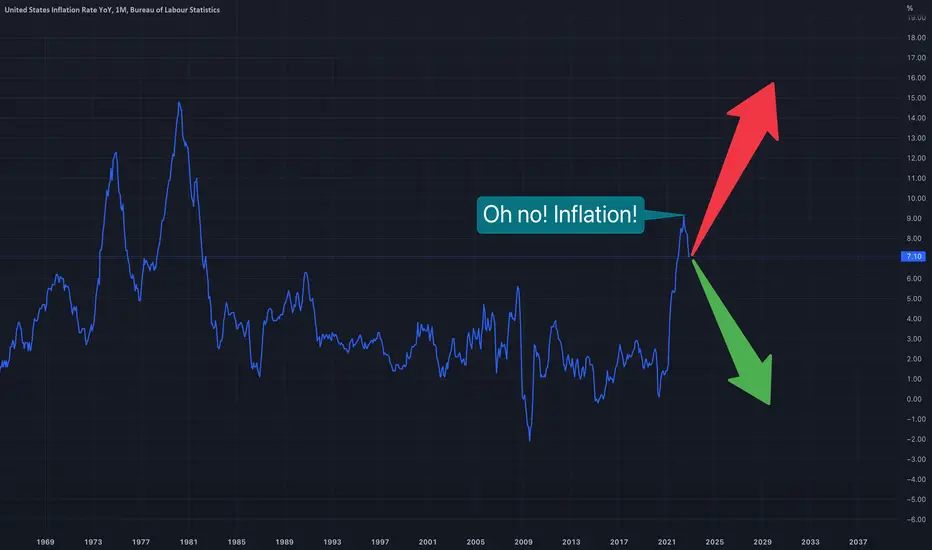
Inflation!Oh yeah, inflation... Just how much though???
One of the main "benefactors" for inflation is money supply. Printing money fast and not managing it to create growth, is bad... unsurprisingly. For the last 2 years, an astronomical amount of money was printed. But have we seen it's effect?
To figure out these HOT questions, we use charts. Opinions don't do us any good for important issues, facts do.
First: M2SL (Money Supply)
Specifically the rate of change. We use the ROC indicator, set in 24 months.
This chart above, the ROC is looking familiar...
It looks like the rate of change in money supply, follows the inflation rate. So we might have something.
I hear you say, on the far right we see an explosion in money supply ROC, and we witness the explosive inflation rate we had this year. Thankfully, ROC is now almost turning negative, and inflation is showing signs of slowing down.
Not so fast.
Look at the following chart.
In this chart we have 3 lines, blue is money supply ROC, orange is time-synced inflation rate, and the faint white line is inflation moved 2 years earlier. I tried to match the money supply ROC peaks with the inflation peaks of 1970s.
Do note that the M2SL ROC for a specific date, takes the average ROC for the past 24 months (2 years). So the delay between money printing and inflation showing it is at least 2 years . The ROC chart is delayed by itself, and it shows inflation change 2 years before the official inflation rate changes.
Alarmingly, the chart above shows us that we are in the middle of inflation explosion.
A magnified view.
I hear you say again, but inflation is rapidly dropping, so it is peaked. This chart above does have an indication of scale as well as timing. It is obvious that the rate of change stood much higher for long, more than any other time in history. So inflation should be quite substantial. Perhaps more than 15% we had in 1970s. We need to prove that it is higher though...
Second: Total money printed
I tried comparing the cumulative money printed in the decade before the inflation peak, this led me to a dead end. Percentages are identical.
It looks like an inflationary shock today, too much was printed too fast.
This is a key difference between the two periods.
Third: What is the "fair" amount of money we should have printed?
So what if, we try comparing money supply with the total GDP. The ratio M2SL/GDP. If you saw my previous idea, I learned that the GDP/M2SL ratio is basically the money velocity.
The idea behind the M2SL/GDP (which is 1/M2V) is simple, just how much excess money have we printed for the gross domestic product we have? I hastily explained in my previous idea, and I will try to explain it again, comparing these two different periods.
During the period of stagflation (1970s) we had money velocity in a slow but steady growth.
Now we have the complete opposite.
We have too much money printed for how much we produce. I don't have the knowledge to pinpoint how much of an increase this could cause to inflation though. I tried some things in my previous idea.
And finally, fourth: Yields
This are disappointing. Markets don't want high yields, and they refuse to price-in higher yields.
It could take many months before this barrier is broken. This is a 3M chart, so timeframes are quite long.
Market's yield is preceding FEDFUNDS. While I am not experienced on the mechanics of how the FED and the market are reading/predicting/using yield rates, this chart shows us that FEDFUNDS always follows US02Y.
Keltner channels show us the opposite side of the EMA Ribbon. If we trust the one, we trust the other.
We are almost inside the top Keltner channel, a bearish phenomenon.
Unfortunately for the low-inflation-dream, we might have reached a top for now. FEDFUNDS is poised to grow a little more, and US02Y shows signs of weakness.
Like 2008 (and every other rate-hike-era), we may have reached a top.
And an extra: Inflation predictions for other countries
I talk about the US, but I am from Greece. Right now, we are voting for next years budget. This budget is presented as a great one (let's not get into politics). Everything is good regarding it. Curiously, on the first paragraph basically, it states that "this budget is made considering an average inflation rate for 2023, 5 points higher than this year.
(I am paraphrasing, I don't present an official transcript)
Inflation reached a high of 12%, a 30 year record. Europe countries like mine, are bracing for higher inflation for next year. The problem is nowhere near to a solution.
Tread lightly, for this is hallowed ground.
-Father Grigori
Deflationary Shock Coming From 1915-1955 every spike in inflation was followed a short period of deflation. Most fundamentals are pointing towards such a deflationary period coming right now. Inventory of retailers is very high right now which will decrease demand in manufacturing and push prices down, oil prices are significantly down compared to earlier in the year and y/y readings will be deflationary in the coming months, new rent prices peak a few months ago, used car prices are coming down as well as most commodities. With this on top of the tight financial conditions the fed is creating I am expecting a very quick contraction in inflation.
CPI over the last 5 months has been 1% ( 2.4% annualized ) also considering the inflationary stimulus check sent out to allegedly flight inflation have been entering the economy the last few months, the majority in October, inflation numbers still came in under expectations. In November m/m inflation was only 0.1% with the tailwinds of stimulus money. The hot CPI sectors are starting to slow down as well.
Why does inflation go negative A negative inflation rate would mean we are in a recession? correct I m not sure please tell me
USIRYY: Inflation has peaked. Fed Pivot incoming? I'm not a macroeconomics guru or T.A. guru, and these charts are weird considering the only timeframe we have access to is the monthly line chart +.
USIRYY has wicked into the golden pocket + 1.618 fib extension with Monthly RSI going into overbought territory + Monthly MACD cross.
I'd be a lot more confident about inflation topping with one more pump to the upside tagging the 1.618 fib at 9.5% with monthly bearish divergence on both MACD on RSI. Regardless, I believe inflation is topping around this area, 8-10%.

US Inflation Rate, YoY, Double Top? - Long-term ViewPresently, the inflation rate in the US has started falling, which increases expectations for a pivot - end of interest rate hikes. And factually, we can actually expect it. The supply of M2 Money Stock (M2SL) and its annual growth rate are decreasing. The global economy is shifting, as leading economic index (LEI) indicate. This will undoubtedly put pressure on the Federal Reserve to cut interest rates. However, after the current crisis, the economic recovery will cause a recurrence of inflation. So, if that is the case, the next decade will be marked by tight monetary policy and high inflation. This situation will let the central banks introduce a new monetary system based on CBDCs using incentives such as cheaper credit.
Check also my related ideas. Enjoy

Sp500 will capitulate if inflation downturnsChecking the dates month by month i noticed that when inflation rate graph crosses the yellow MA downward a Capitulation on the SP500 is followed.

US Stocks Vs Inflation ReadingsUS Stocks Vs Inflation Readings. What happened when the inflation rate ticks a high then starts to reverse.
Will History repeat itself?

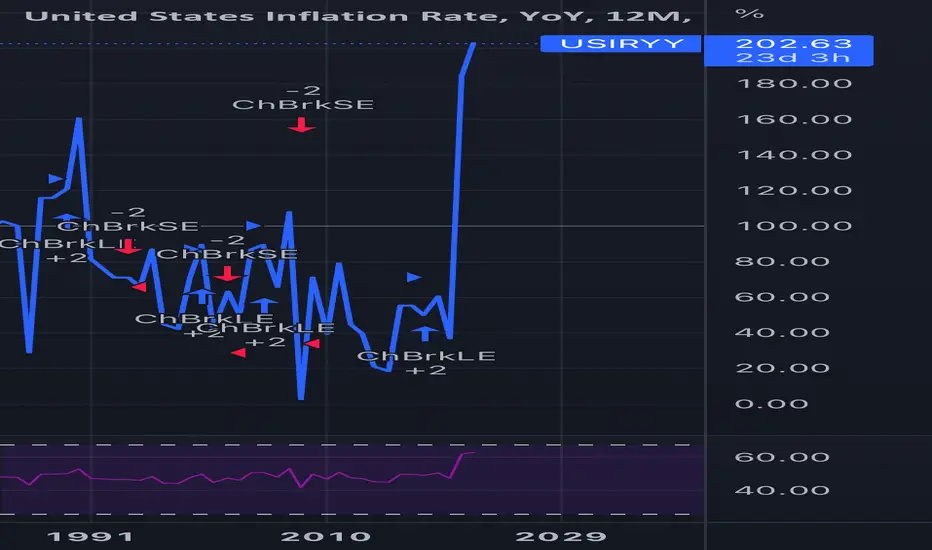
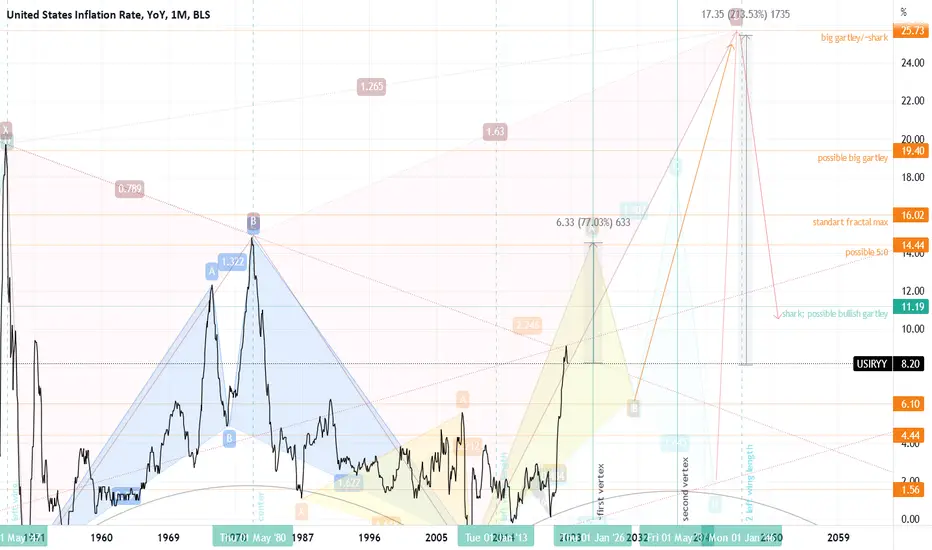
USIRYY: inflation possible growthUs inflation possible growth model based on 5:0 pattern and normal fractal model.
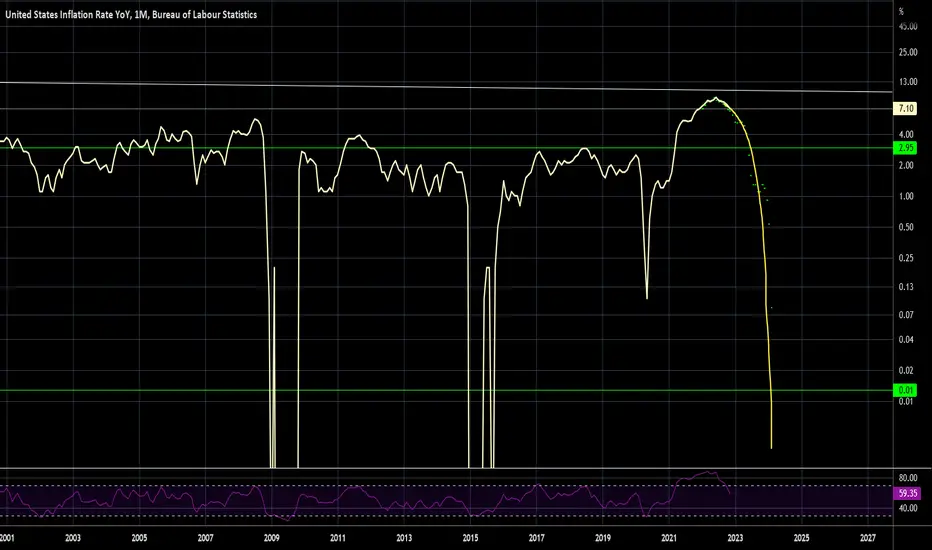
0% Inflation very soon?United States Inflation Rate, Year-over-Year, 1914-2022 chart
----------------------------------------------------------------
Why do I think inflation will go down to 0%?
Inflation is currently at the main trendline (established in 1920). This is a very strong resistance, and as a general rule, do not short a support or long a resistance. In other words, you don't want to speculate on inflation increasing when inflation is at its critical point. FED cares about their charts, and they also want the charts to look great. That's why they will push inflation down.
----------------------------------------------------------------
Why the Inflation Rate Matter?
The inflation rate demonstrates the health of a country's economy. It is a measurement tool used by a country's central bank, economists, and government officials to gauge whether action is needed to keep an economy healthy. That's when businesses are producing, consumers are spending, and supply and demand are as close to equilibrium as possible.
A healthy rate of inflation is good for both consumers and businesses. During deflation, consumers hold on to their cash because the goods will be cheaper tomorrow. Businesses lose money, cutting costs by reducing pay or employment. That happened during the subprime housing crisis.
In galloping inflation, consumers spend now before prices rise tomorrow. That artificially increases demand. Businesses raise prices because they can, as inflation spirals out of control.
When inflation is steady, at around 2%, the economy is more or less as stable as it can get. Consumers are buying what businesses are selling.
----------------------------------------------------------------
How is inflation measured?
There are several ways to measure inflation, but the U.S. Bureau of Labor Statistics uses the consumer price index. The CPI aggregates price data from 23,000 businesses and 80,000 consumer goods to determine how much prices have changed in a given period of time. If the CPI rises by 3% year over year, for example, then the inflation rate is 3%. The Fed, on the other hand, relies on the price index for personal consumption expenditures (PCE). This index gives more weight to items such as healthcare costs.
----------------------------------------------------------------
How do you hedge against inflation?
Because inflation causes money to lose value over time, hedging against it is an important part of any sound investing strategy. Investors use a diversified portfolio with a variety of asset types to offset inflation and ensure that the overall growth of their portfolio outpaces it.
----------------------------------------------------------------
YEAR - INFLATION RATE YOY - FED FUNDS RATE - BUSINESS CYCLE (GDP GROWTH) - EVENTS AFFECTING INFLATION
1929 0.6% NA August peak Market crash
1930 -6.4% NA Contraction (-8.5%) Smoot-Hawley
1931 -9.3% NA Contraction (-6.4%) Dust Bowl
1932 -10.3% NA Contraction (-12.9%) Hoover tax hikes
1933 0.8% NA Contraction ended in March (-1.2%) FDR's New Deal
1934 1.5% NA Expansion (10.8%) U.S. debt rose
1935 3.0% NA Expansion (8.9%) Social Security
1936 1.4% NA Expansion (12.9%) FDR tax hikes
1937 2.9% NA Expansion peaked in May (5.1%) Depression resumes
1938 -2.8% NA Contraction ended in June (-3.3%) Depression ended
1939 0.0% NA Expansion (8.0% Dust Bowl ended
1940 0.7% NA Expansion (8.8%) Defense increased
1941 9.9% NA Expansion (17.7%) Pearl Harbor
1942 9.0% NA Expansion (18.9%) Defense spending
1943 3.0% NA Expansion (17.0%) Defense spending
1944 2.3% NA Expansion (8.0%) Bretton Woods
1945 2.2% NA Feb. peak, Oct. trough (-1.0%) Truman ended WWII
1946 18.1% NA Expansion (-11.6%) Budget cuts
1947 8.8% NA Expansion (-1.1%) Cold War spending
1948 3.0% NA Nov. peak (4.1%)
1949 -2.1% NA Oct trough (-0.6%) Fair Deal, NATO
1950 5.9% NA Expansion (8.7%) Korean War
1951 6.0% NA Expansion (8.0%)
1952 0.8% NA Expansion (4.1%)
1953 0.7% NA July peak (4.7%) Eisenhower ended Korean War
1954 -0.7% 1.25% May trough (-0.6%) Dow returned to 1929 high
1955 0.4% 2.50% Expansion (7.1%)
1956 3.0% 3.00% Expansion (2.1%)
1957 2.9% 3.00% Aug. peak (2.1%) Recession
1958 1.8% 2.50% April trough (-0.7%) Recession ended
1959 1.7% 4.00% Expansion (6.9%) Fed raised rates
1960 1.4% 2.00% April peak (2.6%) Recession
1961 0.7% 2.25% Feb. trough (2.6%) JFK's deficit spending ended recession
1962 1.3% 3.00% Expansion (6.1%)
1963 1.6% 3.5% Expansion (4.4%)
1964 1.0% 3.75% Expansion (5.8%) LBJ Medicare, Medicaid
1965 1.9% 4.25% Expansion (6.5%)
1966 3.5% 5.50% Expansion (6.6%) Vietnam War
1967 3.0% 4.50% Expansion (2.7%)
1968 4.7% 6.00% Expansion (4.9%) Moon landing
1969 6.2% 9.00% Dec. peak (3.1%) Nixon took office
1970 5.6% 5.00% Nov. trough (0.2%) Recession
1971 3.3% 5.00% Expansion (3.3%) Wage-price controls
1972 3.4% 5.75% Expansion (5.3%) Stagflation
1973 8.7% 9.00% Nov. peak (5.6%) End of gold standard
1974 12.3% 8.00% Contraction (-0.5%) Watergate
1975 6.9% 4.75% March trough (-0.2%) Stop-gap monetary policy confused businesses and kept prices high
1976 4.9% 4.75% Expansion (5.4%)
1977 6.7% 6.50% Expansion (4.6%)
1978 9.0% 10.00% Expansion (5.5%)
1979 13.3% 12.00% Expansion (3.2%)
1980 12.5% 18.00% Jan. peak (-0.3%) Recession
1981 8.9% 12.00% July trough (2.5%) Reagan tax cut
1982 3.8% 8.50% November (-1.8%) Recession ended
1983 3.8% 9.25% Expansion (4.6%) Military spending
1984 3.9% 8.25% Expansion (7.2%)
1985 3.8% 7.75% Expansion (4.2%)
1986 1.1% 6.00% Expansion (3.5%) Tax cut
1987 4.4% 6.75% Expansion (3.5%) Black Monday crash
1988 4.4% 9.75% Expansion (4.2%) Fed raised rates
1989 4.6% 8.25% Expansion (3.7%) S&L Crisis
1990 6.1% 7.00% July peak (1.9%) Recession
1991 3.1% 4.00% Mar trough (-0.1%) Fed lowered rates
1992 2.9% 3.00% Expansion (3.5%) NAFTA drafted
1993 2.7% 3.00% Expansion (2.8%) Balanced Budget Act
1994 2.7% 5.50% Expansion (4.0%)
1995 2.5% 5.50% Expansion (2.7%)
1996 3.3% 5.25% Expansion (3.8%) Welfare reform
1997 1.7% 5.50% Expansion (4.4%) Fed raised rates
1998 1.6% 4.75% Expansion (4.5%) LTCM crisis
1999 2.7% 5.50% Expansion (4.8%) Glass-Steagall repealed
2000 3.4% 6.50% Expansion (4.1%) Tech bubble burst
2001 1.6% 1.75% March peak, Nov. trough (1.0%) Bush tax cut, 9/11 attacks
2002 2.4% 1.25% Expansion (1.7%) War on Terror
2003 1.9% 1.00% Expansion (2.9%) JGTRRA
2004 3.3% 2.25% Expansion (3.8%)
2005 3.4% 4.25% Expansion (3.5%) Katrina, Bankruptcy Act
2006 2.5% 5.25% Expansion (2.9%)
2007 4.1% 4.25% Dec peak (1.9%) Bank crisis
2008 0.1% 0.25% Contraction (-0.1%) Financial crisis
2009 2.7% 0.25% June trough (-2.5%) ARRA
2010 1.5% 0.25% Expansion (2.6%) ACA, Dodd-Frank Act
2011 3.0% 0.25% Expansion (1.6%) Debt ceiling crisis
2012 1.7% 0.25% Expansion (2.2%)
2013 1.5% 0.25% Expansion (1.8%) Government shutdown. Sequestration
2014 0.8% 0.25% Expansion (2.5%) QE ends
2015 0.7% 0.50% Expansion (3.1%) Deflation in oil and gas prices
2016 2.1% 0.75% Expansion (1.7%)
2017 2.1% 1.50% Expansion (2.3%)
2018 1.9% 2.50% Expansion (3.0%)
2019 2.3% 1.75% Expansion (2.2%)
2020 1.4% 0.25% Contraction (-3.4%) COVID-19
2021 7.0% 0.25% Expansion (5.9%) COVID-19
2022 8.3% 3.25% Contraction (-1.6%) As of Sept. 21. 2022
2023 2.7% (est.) 2.8% (est.) Expansion (2.2%) March 2022 projection

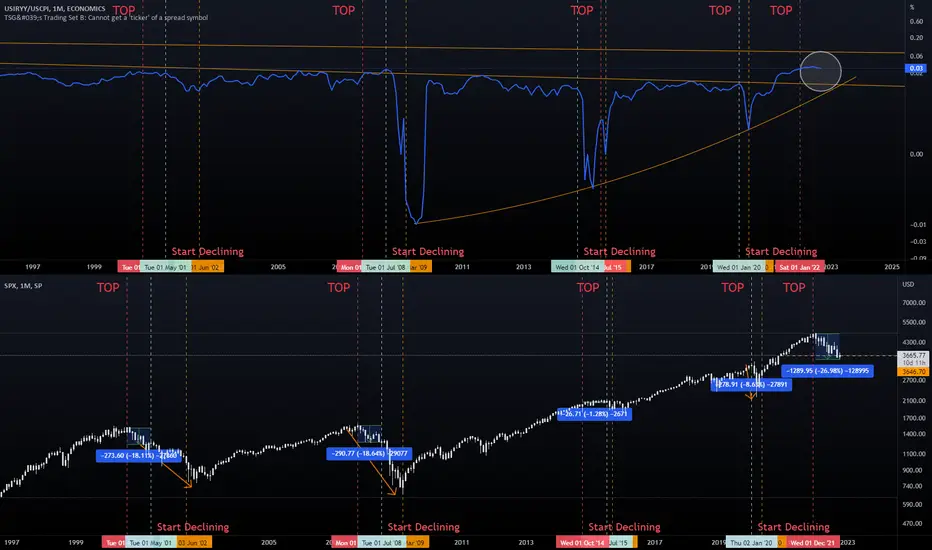
Inflation Rate against CPI IndexAs you can see - all crashes on SPX have been synced with the above chart dipping big time.
What do we have now ? The chart hasn't even gone down - yet SPX has dipped -27%.
The difference between SPX's TOP and the start of declining of Inflation Rate / CPI is of an average 15-18% decline on SPX.
The only problem is that we haven't even started properly declining (circled area).
Two assumptions based on this - Either we still have time in this market and this was just a correction...
or...
... the fall will be huge.
Personally expecting markets to recover a bit and soon inflation rate will spike down together with SPX falling.
Not investing big time before seeing a proper spike down.
Cheers!
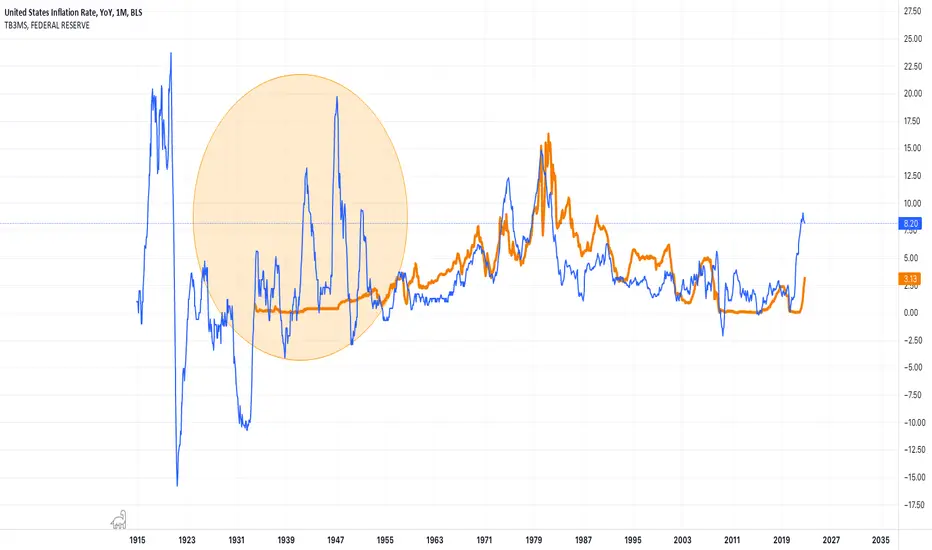
Inflation YoY vs Fed Fund Proxy in the 1940s ... Inflation YoY vs Fed Fund Proxy in the 1940s ... No need to lift rates do match inflation .... something to think about it
Inflation in the USWhen it comes to inflation in the US, some will say that it has become entrenched, others that it has come to a halt.
The FED has over stimulated the economy and is late in the process of raising interest rates. It may be some time before you see the effect of an interest rate hike e.g. the bankers are supposed to warn interest rate hike etc., but now the FED is impatient to get price stability. It can end with a ketchup effect.
When the FED raises interest rates, it will strengthen the USD and it will have an inflationary effect on other economies. After all, they are going to pay more in their currency for goods traded in USD.
The interest rate curve is inverted, but unlike previously it is attributed to the fact that the economy has been over stimulated (artificially low interest rate and QE = money printing) (1). Putting the money press in motion produces empirical inflation.
Although GDP has been negative for two quarters, it does not resemble a recession in American society, see for example unemployment, PMI and consumer confidence (2).
The S&P 500 index is back in a declining trend in the medium term and will remain so until proven otherwise. On the 5 year chart there is a support around 3400.
Now Q3 will get some attention and it can go up or down a bit. Q3 may well surprise positively (3), but after that macroeconomics will take over. Markets are volatile and trying to find a bottom. The peaks of the VIX are steadily declining (4). It indicates that we are getting closer to the bottom.
Geopolitically, Ukraine in particular, but also Taiwan, is important.
Russia is using energy supplies to Europe as a means of pressure in connection with its assault on Ukraine. Energy prices will be high and this will have an inflationary effect.
One should diversify and not depend on totalitarian systems such as Russia and China.
I found it relatively easy to get out and in of the stock market in the big V-shaped correction in February-March 2020. Since the stock market then peaked and began to fall, the trend has been insidious. If you sell out, do you come out at the bottom?
I have mostly chosen to sit still, but I want to buy a little when I think the price is low and preferably not sell anything unless there is a good reason. The stock market is coming back up.
That's how I see it and not a call for specific dispositions.
(1)
www.nordnet.no
(2)
da.tradingeconomics.com
(3)
www.nordnet.dk
(4)
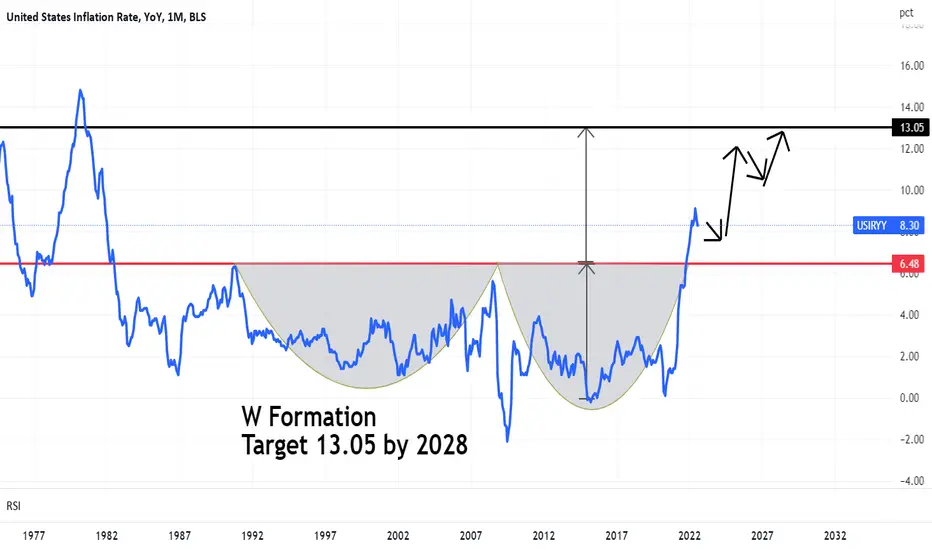
Inflation not going to slow down for the US until 2028In the short term - like today!
8:30 EST 13 Oct 2022
If the CPI (measures inflation) comes out at above 8.2% this could lead to a market crash as the Fed would likely raise interest rates by another 100 bps on 2 November to curb inflation.
If the CPI comes out below 8.2 this could spark a market rally as they will believe inflation is starting to cool down.
In the long term. Price broke out of the W Formation and is showing major upside to come for Inflation.
This could go on until 2028... If this happens, there is a potential Depression that could kick in world wide.
This depression would then last for another 10 - 20 years (if they can get it under control).
We need a government and quantitative reset...
Sorry for the doom and gloom but it's not looking good technically.
InflationThe Golden FIB is at it again!
This time it did its magical powers on Inflation.
What can can Mr. FIB do next?
Will its power dominate the world?!?!?!


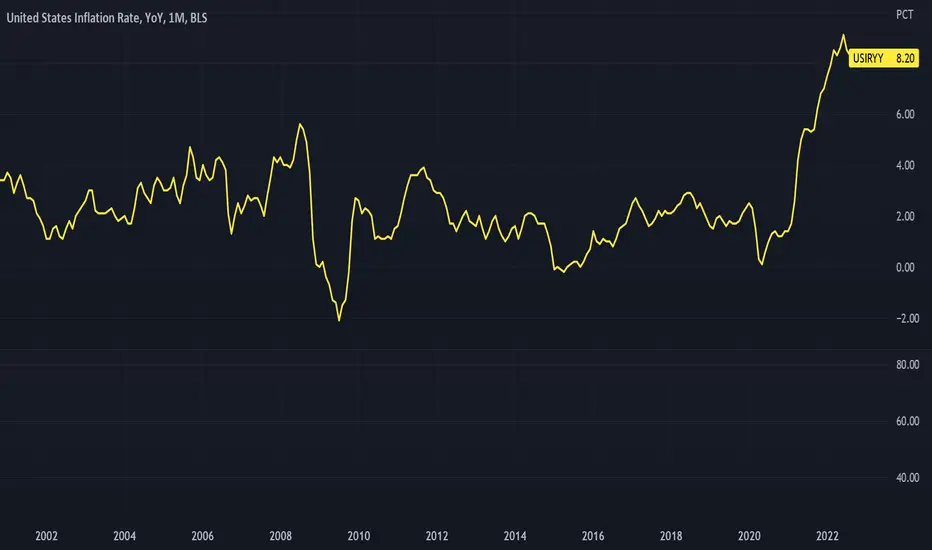
The Proper Perspective on InflationAs any true trader knows, the inflation rate DID NOT GO UP 8.3%. That is what some retail news outlets claimed "year-over-year," which is plain misinformation. The retail news was designed to trigger a panic dump among the less informed last week.
FACT: The rise in inflation started in late 2020, not this year.
FACT: The rise in 2021 went to 7%. But the news seldom mentioned it last year. Nope, it was all about vaccines and Covid, etc.
The inflation rate went down. It has been trending downward at a sustainable rate. Anyone who thought it would be lower was not paying attention. There is a 3-month decline, and it is due to falling oil prices which were constantly boosted upward during August by the big banks trying to move more investors into buying oil stocks. So, with fluctuating prices of oil between 80 - 92, there was NO WAY inflation would tick down to 8.1%.
In August of 2021, inflation had already risen to 5.3%. Now in 2022, it has dropped to 8.3% from the peak of 9.1% in June. So it's 3 points higher than a year ago, obviously not 8.3 points higher.
During the pandemic of 2020, the news about the Federal Reserve Board was all lathered up about deflation, that deflation was about to happen, and the world was coming to an end!!!! Sigh. Some people just have to have bad news to feel good, I guess.
Oil and the war in Ukraine, which appears to be settling down with the Ukrainians taking back what is rightly their country, has lowered oil prices from $125 to 80-90, fluctuating regularly. Oil needs to drop to 70-80 for inflation to move down more.
Slow improvement is how it is going to be. To assume inflation would just drop back to 2% is irrational and illogical.
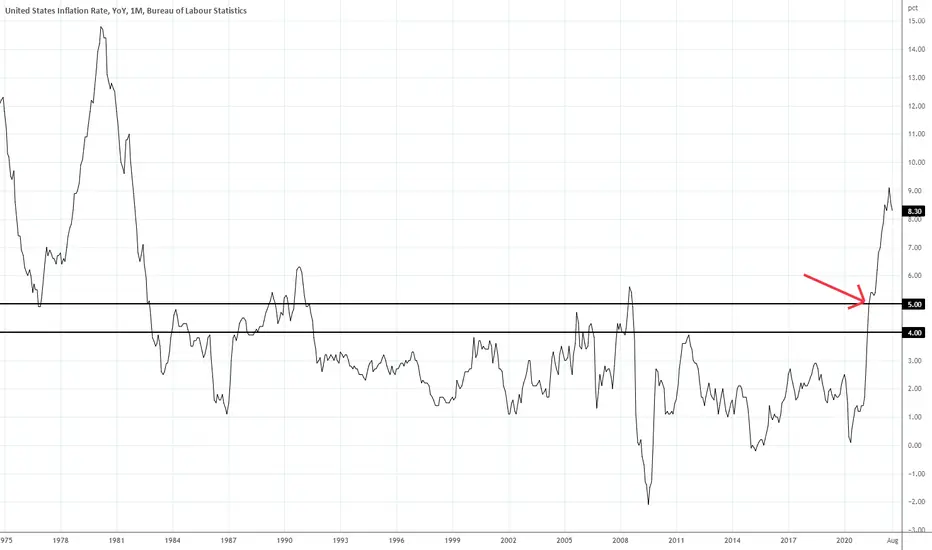
What is an ideal rate? For an expanding economy: around 4-5%.
See that red arrow? That should be the goal. It probably is not, but it should be. Inflation lower than that indicates a sluggish economy with a lack of raises for the workforce. When inflation is not in the economy, corporations use buybacks to boost their stock prices, which creates fake rallies.
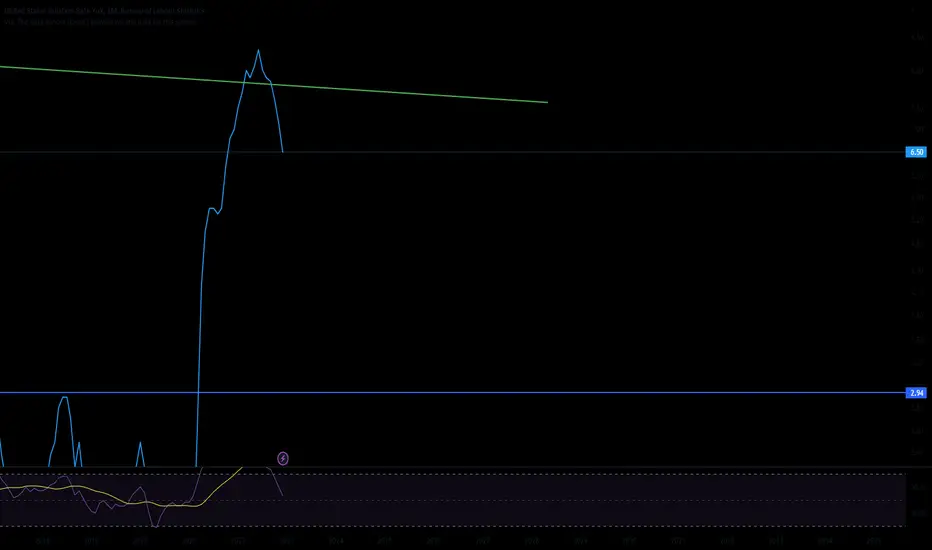
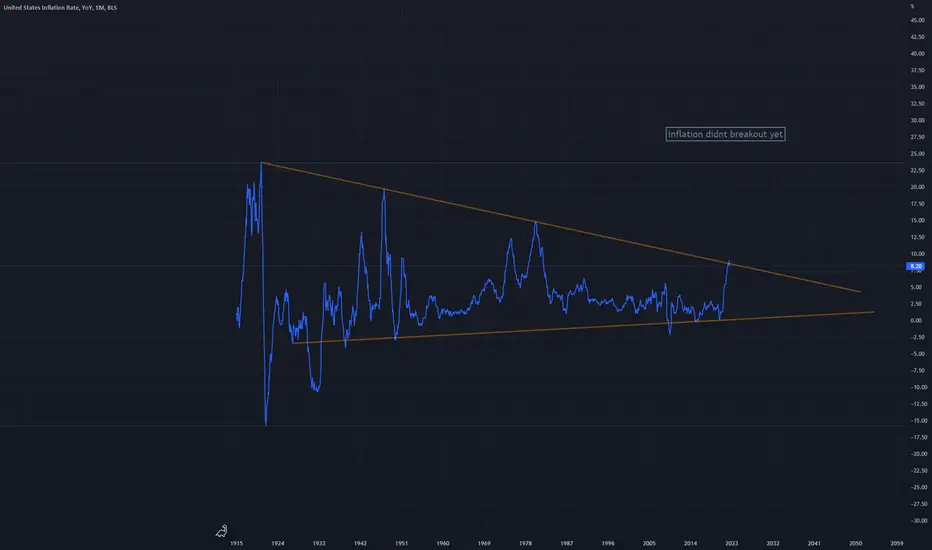
Inflation Rate - Quick ReminderI know this chart isn't driven by TA, but when I see a long-multiyear-trendline that fits all highest inflations in US history (recorded) - I won't ignore it. In the last months we've hit it - crossed it - and lately retested it.
Today keep you eye on what's next.
