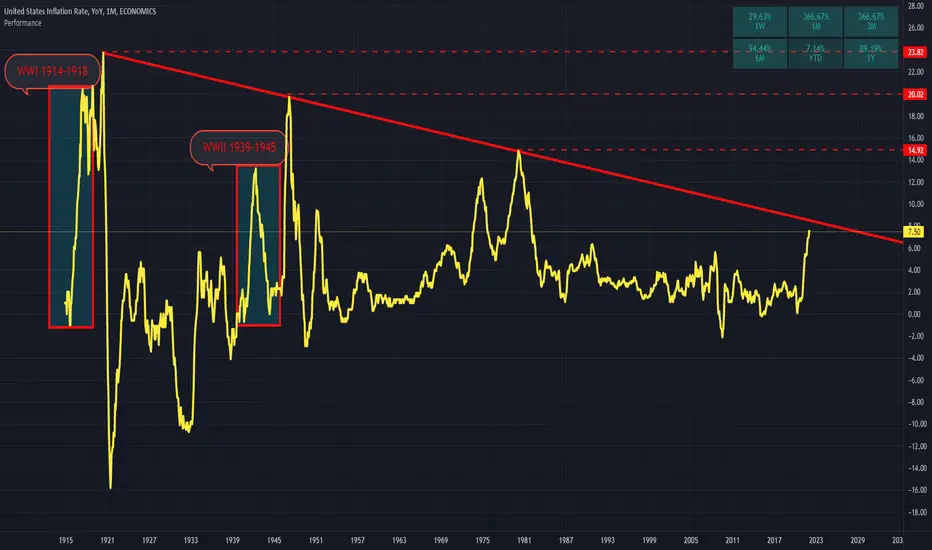
🔥 Has Inflation Peaked? A Century Old Trend Suggests YesWith inflation rising, the FED is applying quantitative tightening to the US market and the Dollar, which has caused chaos in the market of 2022. The market fears that the FED is not doing enough to combat this inflation, which will cause higher inflation, which will eventually cause further chaos in the markets.
However, looking at the chart it seems that inflation is currently at a massive "resistance" which has developed over the last 100 years or so. If inflation were to adhere to the trend, we can assume that inflation has peaked and will move down from here onwards, which would result in much better (bullish) market conditions.
I'm aware that applying TA on fundamental data like inflation is generally speculative at best. I think that inflation will rise further as long as the FED is unable (or unwilling) to rise the interest rates further.
Nevertheless, I think this analysis can shed a different light on on the most important piece of data of 2022.
Time will tell.
Do you think think inflation has peaked? Share your thoughts in the comments.
USIRYY trade ideas

US Inflation vs Fed Fund RateThe difference between US Inflation (YoY) and Fed Fund Rate reaches all time high, higher since 1955.
I conclude, The Fed is really fall behind the curve (vs Inflation).
The Fed must take a huge step. No wonder market worry.

Inflation is PeakingPeople are too fearful. Dumps have lost momentum. Bearish forecasts and bad news are not affecting stock and crypto price action too much (the opposite of so much bullish news not pumping equities and crypto too much last year).
Time to long.

USIRYY - Inflation 8.6%US inflation shows no signs of slowing down, Annual inflation rate in the US unexpectedly accelerated to 8.6% in May of 2022.
S&P 500 reacted to the peaking inflation by slowing the market by nearly 22% from ATH.
Is really America heading towards a recession?

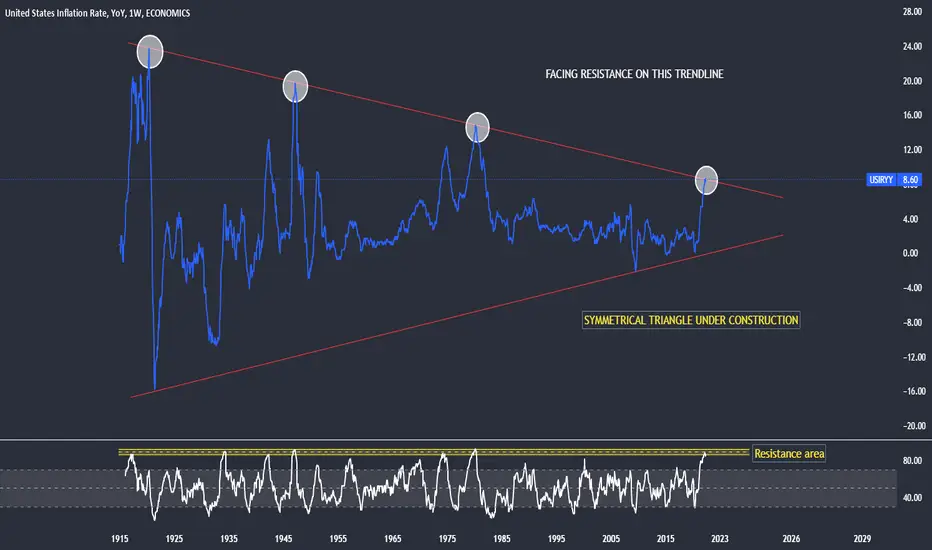
Out of the Box chart !!!US Inflation has reached falling trendline where it has faced resistance
for three times.
Also, RSI has reached the upper range from where reversal is witnessed.
But, if it gives breakout above this trendline then the doors of huge upside will
be opened, as it's a symmetrical triangle pattern whose targets are huge.
Rising inflation is never favorable for stock market so it's a sign of caution.
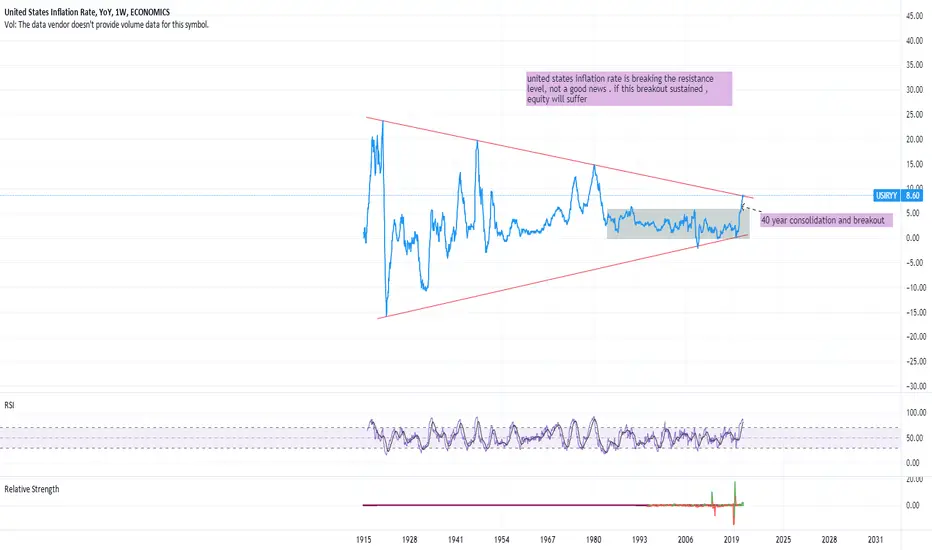
us inflation rateunited states inflation rate is breaking the resistance level, not a good news . if this breakout sustained , equity will suffer
Peak Inflation - NoKeep the dream alive Blue Turtles.
It's typically when Food Inflation crosses 35% historically...
The HOI POLLOI get nasty.
it's coming.
Count on it.
34.47% YOY....
3 Bips... 3

12% INCOMINGyall aint ready for that are ya, better be prepared, dollar aint worth that much anymore

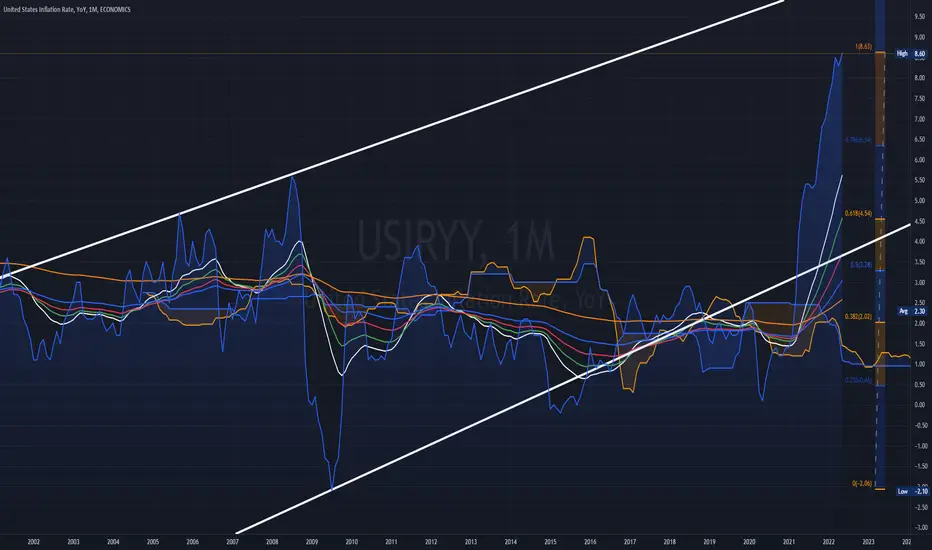
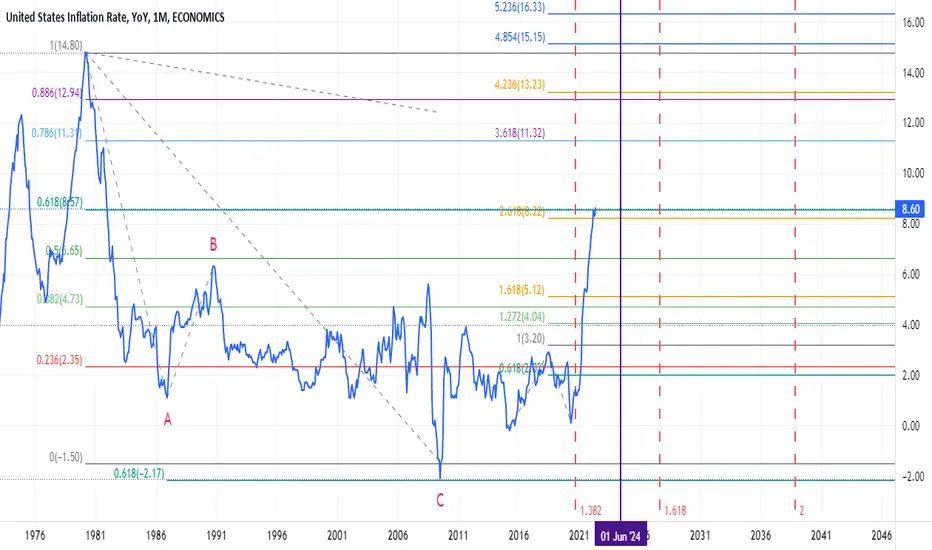
US inflation at a critical levelI was just wandering between charts and found USIRYY (US inflation) to respect Fib numbers geometrical. I'm not going into details about sub-waves and where it's going but my personal opinion is that the inflation is here to stay for months and it can stay at the current levels until 2027
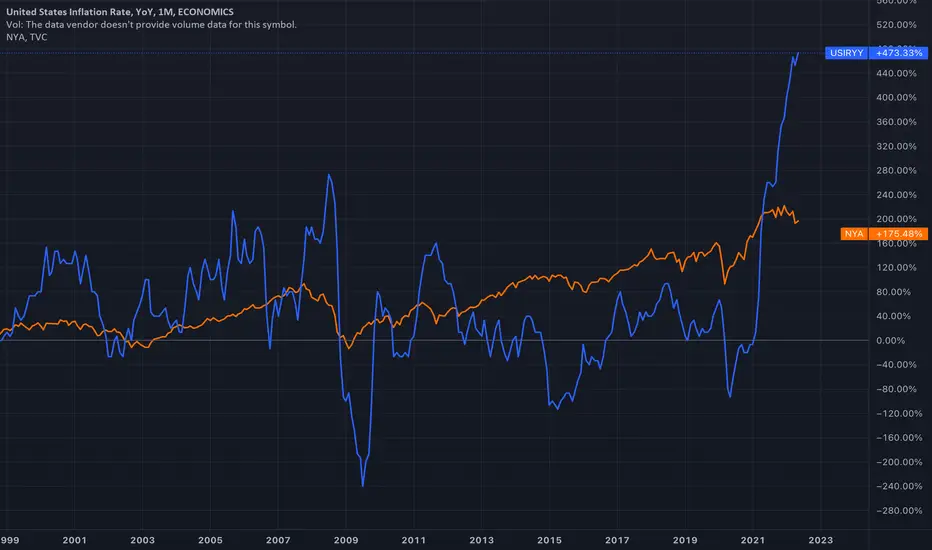
Inflation VS NYSEComparing Inflation to Previous trends trying to see if I see growth shrinking or if stocks are just overpriced.
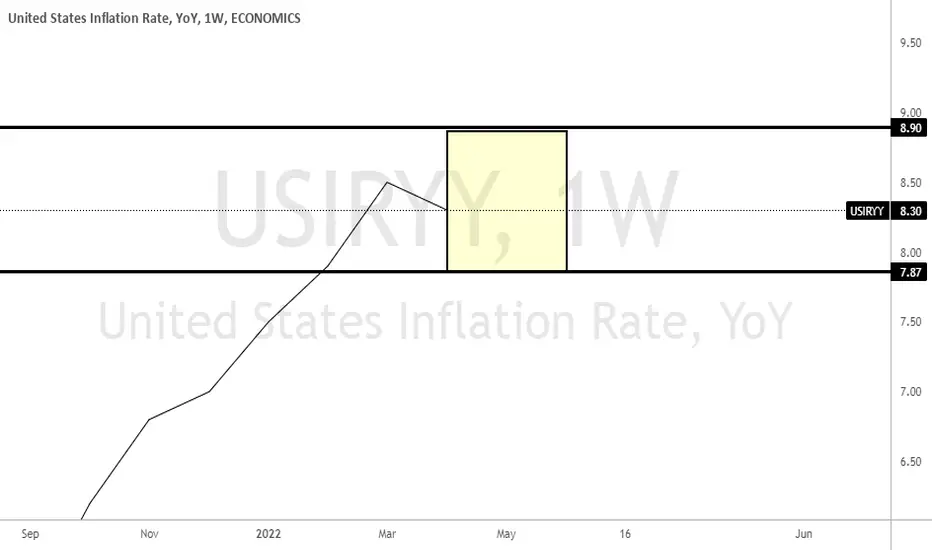
Us Inflation cooling down but trend upUs Inflation is in an up trend well defined but at this point has got some cooling down mainly due federal reserve tighting policy. For moment the analysis says CPI will be bettween 8.9 - 7.0 but the TREND IS UP! SO higher prices expected to resume later!
The unwinding of the global excesses will be epic (not here yet)I was just looking at some data and put this chart together. Pay attention to how the dynamics of USD assets have changed over the past 3+ years - and the excesses built into the global economy since the 2008-09 GFC.
As much as I want the global to navigate a soft-landing process, I see the excesses of the past 8+ years unwinding in a somewhat extended format through 2025 or beyond.
Because of this expectation, I believe the US/Global markets may enter a period of extreme consolidation over the next 4+ years before attempting to shift back into a longer-term bullish price trend. This means we need to stay focused on assets that provide safety and security while attempting to navigate a broad global capital unwinding process.
Bitcoin and other speculative assets may see massive revaluation events - same with Technology and Innovation sectors.
Traders will get chopped up unless you are able to target quick profits and/or ride our shifting capital trends in various global assets. Passive investing may seem like the safe play - but I believe CASH and HEDGING will outperform almost everything else over the next 3+ years.
Follow my research and learn how to spot these bigger cycle trends. The peak in the US markets is not here yet - but when it happens, be prepared for extreme market volatility.

Testing 100 year old US inflation trend lineIn the last 100 years the Inflation trend line has been tested 3 times and each time it was followed by a depression/recession. Will this time be different? Probably not. Will there be a total calamity and massive lines at the soup kitchen? Probably not. Will you own nothing and be happy? Definitely!

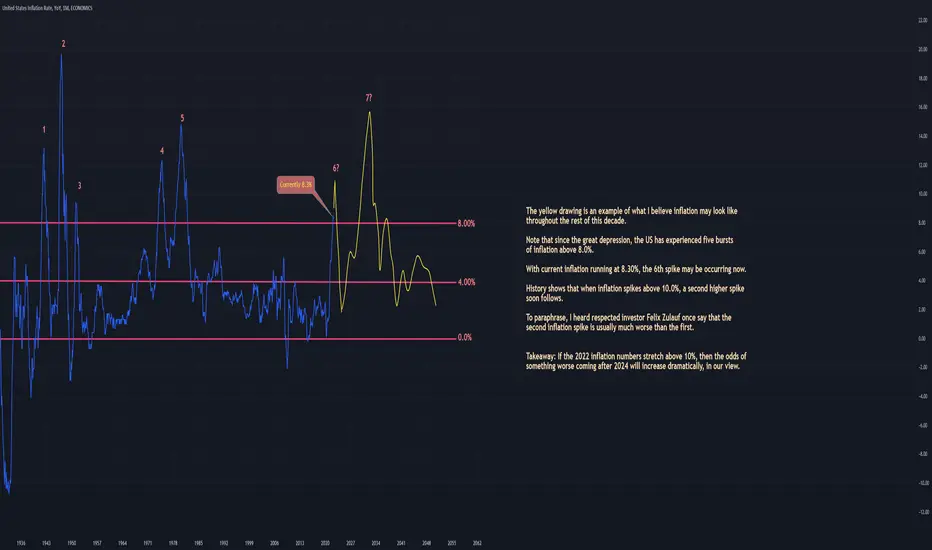
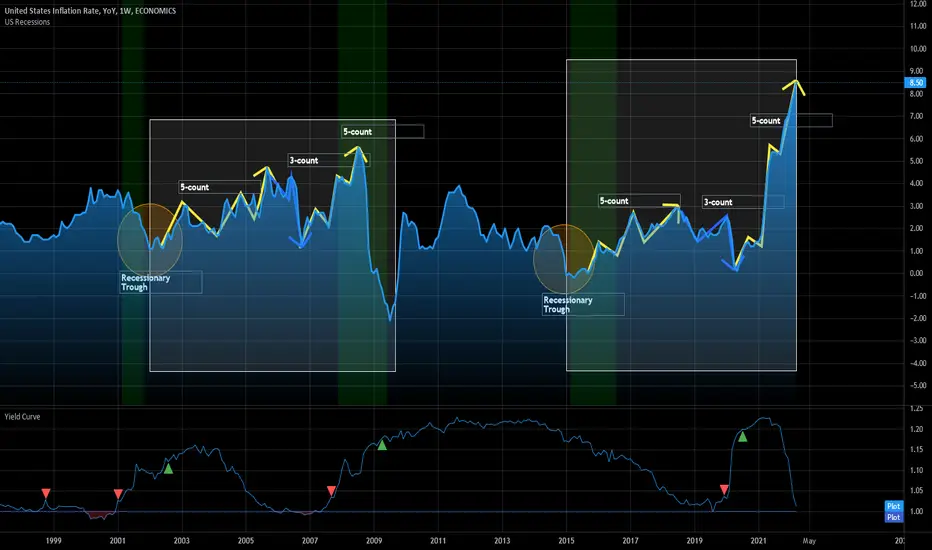
The US May See More Inflation Spikes The yellow drawing is an example of what I believe inflation may look like throughout the rest of this decade.
Note that since the great depression, the US has experienced five bursts of inflation above 8.0%.
With current inflation running at 8.30%, the 6th spike may be occurring now.
History shows that when inflation spikes above 10.0%, a second higher spike soon follows.
To paraphrase, I heard respected investor Felix Zulauf once say that the second inflation spike is usually much worse than the first.
Takeaway: If the 2022 inflation numbers stretch above 10%, then the odds of something worse coming after 2024 will increase dramatically, in our view.
The Ukraine conflict is another inflationary shock for the worldAlas, it is settled. Inflation is not transitory. Its persistent uptick has serious implications for the global economy. The ongoing conflict, in addition to all the suffering it is causing in Ukraine, has created a further inflationary shock for the world. How are investors hedging themselves?
Don’t be surprised by what the pandemic has done
Post-pandemic inflation is not a new phenomenon – that is not to say the COVID-19 pandemic is completely behind us. In the aftermath of the 14th century Black Death, the world faced a breakdown in trade, as efforts were made to contain the spread of the plague, and a shortage of workers – given the astonishingly high death toll. The world has, since then, become a lot more complex, and much more interconnected.
In the UK, airlines including British Airways and Easyjet are scrambling to hire more workers as they struggle to meet the rampant growth in travel demand with a depleted workforce. London’s Heathrow airport recently stated that it is stretched as it races to hire 12,000 new staff ahead of summer1. The first lesson in economics 101 would tell us that this means high demand and tight supply, a perfect recipe for rising prices – inflation.
How the conflict has complicated things
The conflict has exacerbated the inflation problem. It has exposed fault lines in already fragile global supply chains. Russia is among the largest producers of commodities including oil, natural gas, palladium, aluminium, nickel, and wheat among others. In certain cases, direct sanctions have been introduced. This is the starkest case of supply disruption. For example, sanctions from the US and UK on Russian oil and gas. For other commodities, there is a question mark. Direct sanctions may not have been introduced but several buyers are exploring alternatives. In an already tight global commodity market (see figure below), and options limited due to commodity supply being a function of natural resources, this is not necessarily easy.
It goes further. Ukraine is the world’s biggest exporter of corn, wheat, and sunflower oil2. Not only have the flows of these commodities out of Ukraine largely stalled, but spring planting for the next season could also be significantly hampered given the dislocation of people and destruction of infrastructure.
Moreover, Russia and Ukraine together export 28% of fertilizers made from nitrogen and phosphorus, as well as potassium3. Fertilizer shortages pose a danger to crop yields further tightening the supply of agricultural commodities and augmenting food price inflation.
What can central banks do
Central banks can’t send 12,000 new employees to Heathrow Airport. They can’t put an end to the conflict. And they certainly can’t ensure food or energy security. They can, however, cut back on monetary accommodation – the only lever at their disposal. Tightening monetary policy aims to control inflation by reducing growth. Higher rates should mean fewer people seeking new mortgages or maxing out their credit cards.
But monetary policy accommodation alone didn’t create inflation and its withdrawal alone won’t solve the problem.
What are investors doing?
Investors have been on the move in the last twelve months – even when the US Federal Reserve was clinging on to the ‘inflation is transitory’ narrative. In the last twelve months, there have been over $18bn in flows into broad based commodity basket exchange traded products worldwide. Almost $8bn of which, have come in the last three months, suggesting the trend is accelerating4.
We see investors turning towards broad commodities for three distinct reasons. First, commodity market tightness is at the heart of the inflation conundrum. There is, therefore, a natural relationship between rising commodity prices, and rising prices more widely. Investors are seeking commodities exposure as an inflation hedge. Second, broad commodities help capture the structural demand growth for metals from the energy transition. And third, they offer diversification – not just against equities and bonds but also within the basket given the heterogeneity among the different commodity sectors.
Not a question of if, but how
Until last year, whether there is a strong case to add inflation protection was still a dilemma for many investors. Now, focus seems to have shifted towards how best to hedge against it. Commodities aren’t the only solution. They do appear to be the favoured solution right now for many.
Sources:
1 news.sky.com
2 www.bloomberg.com
3 Source: Morgan Stanley as reported by CNBC: www.cnbc.com
4 Source: Bloomberg, as of 14 April 2022.
This material is prepared by WisdomTree and its affiliates and is not intended to be relied upon as a forecast, research or investment advice, and is not a recommendation, offer or solicitation to buy or sell any securities or to adopt any investment strategy. The opinions expressed are as of the date of production and may change as subsequent conditions vary. The information and opinions contained in this material are derived from proprietary and non-proprietary sources. As such, no warranty of accuracy or reliability is given and no responsibility arising in any other way for errors and omissions (including responsibility to any person by reason of negligence) is accepted by WisdomTree, nor any affiliate, nor any of their officers, employees or agents. Reliance upon information in this material is at the sole discretion of the reader. Past performance is not a reliable indicator of future performance.

Everything has changed.People ask me, "but why is Bitcoin doomed to fall back to Earth?"
People ask me, "but why has Bitcoin risen so much the last 12 years then?"
People ask me, "but why don't you want me to have a lambo?"
I tell people, "Bitcoin is a failure of its own success. Blockchain is the internet of things. It has worked so well that governments are now developing their own versions and realizing they need to regulate."
I tell people, "Bitcoin did so extremely well because (-) real interest rates caused any excess liquidity to flow into new pockets of the economy. Look at the yellow box. Most bond holders have been losing money in real terms even though bond prices were going up. You can see that all the growth since 2012 has been artificially pumped up.
I tell people, "These last 10-12 years are the quintessential example of a Wave 5 Elliott wave. The sellers had all left. Volume and fundamentals remained low even though prices kept rising. Bubbles formed and whole new markets developed (crypto) as a result of monetizing the debt.
So no, this is not like 2018, 2014, or 2011.
You cannot compare this next cycle to the previous ones.
Either the Inflation Rate (red line) crashes, or BTC and markets crash.
(Not Financial Advice. This is my opinion.)

Inflation breaking Demand Line from 1920?Will the Inflation Rate break the demand line beginning back from the 1920's? Watch out if it does...

The inflation cycle & an interesting fractal.I believe that there is a pretty clear fractal or at least a cyclical repeating pattern in inflation.
This is a very very long-term view here, so it wouldn't surprise me that nobody has noticed this because everyone is trading 15m and 5m charts.
We can see that there are two distinct cycles here with a very similar structure that seems to display some clear wave patterns.
I know I'm not using a strict Elliot Wave principle here, but that's not the point.
The point is that there is a very similar pattern emerging between the 2000-2008 expansion cycle and the 2015-2022 expansion cycle.
We have an inflation spike which looks very similar to the spike which began in 2007
If this is a fractal as I suspect, then this will resolve within 1 year and my instinct is that the forthcoming fiscal tightening regime which is being put into action by the FED is going to be the catalyst for another "event" the scope of which is unknown at this juncture.
This does signal that inflation is likely to peak right about now. That's the good news. The bad news is that this "peak" isn't going to signal happier times in the economic sense.
In fact, I am on the record as saying that the only way for the FED to get rid of inflation is to crash the assets markets.
We are also very close to a de-facto inversion in the yield curve which I think is a reflection of both the inflation panic and also the general geopolitical tensions in the bond market.
Whichever way you look at the yield curve, it is pretty clear that the bond market doesn't believe that we're going to tip back into economic expansion and especially not because the FED is embarking on fiscal tightening.
Do your own research. Happy trading.
Inflation rate hits CENTURY OLD trendline resistanceI think inflation has topped if TA works in this area. There is fundamental deflationary macro economic forces at play as well that could see a reduction in inflation by next year and the rest of this decade. The current war and supply shocks due to trade war are interim.
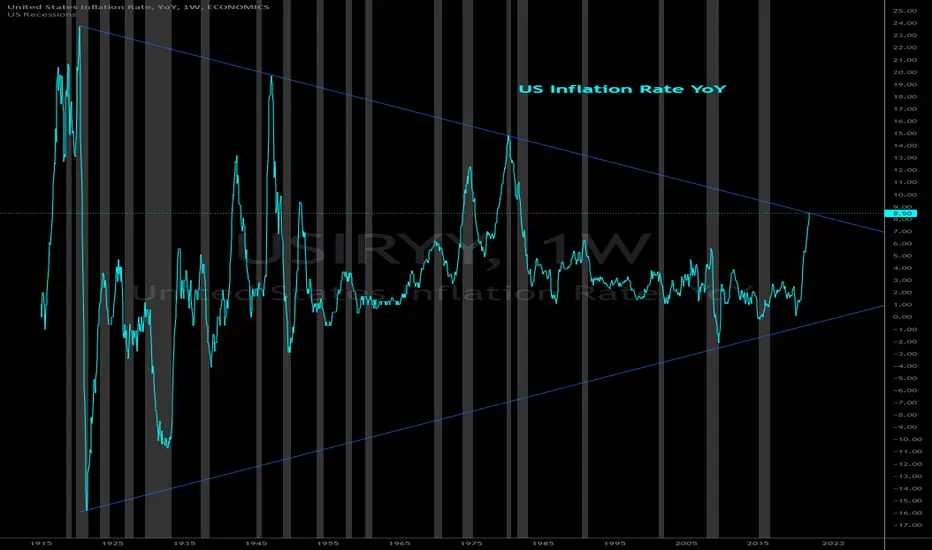
US inflation outlookThis analysis is based purely on technicals! Since the 1920 high us inflation has been on a long term downtrend. I connected the 1920 high with the 1947 high and the 1980 high touched the trend line and reversed with no overshoot. Now price is touching the trend line for the 4th time and we’ll have to wait and see if the long term downtrend continues or if we’re headed towards economic turmoil.

Inflation: long term top or century breakout?Inflation Hits Fastest Pace Since 1981, at 8.5% Through March
Gasoline weighed heavily in the increases, while prices moderated in several categories. Some economists say the overall rate may have peaked.
Inflation hit 8.5 percent in the United States last month, the fastest 12-month pace since 1981, as a surge in gasoline prices tied to Russia’s invasion of Ukraine added to sharp increases coming from the collision of strong demand and stubborn pandemic-related supply shortages.
Fuel prices jumped to record levels across much of the nation and grocery costs soared, the Labor Department said Tuesday in its monthly report on the Consumer Price Index. The price pressures have been painful for American households, especially those that have lower incomes and devote a big share of their budgets to necessities.
But the news was not uniformly bad: A measure that strips out volatile food and fuel prices decelerated slightly from February as used car prices swooned. Economists and policymakers took that as a sign that inflation in goods might be starting to cool off after climbing at a breakneck pace for much of the past year.
In fact, several economists said March may be a high-water mark for overall inflation . Price increases could begin abating in the coming months in part because gasoline prices have declined somewhat — the national average for a gallon was $4.10 on Tuesday, according to AAA , down from a $4.33 peak in March. Some researchers also expect consumers to stop buying so many goods, whether furniture or outdoor equipment, which could begin to take pressure off overtaxed supply chains.
By Jeanna Smialek NYT
April 12, 2022

What would happen if Inflation pass 8.5%..!In this chart, you can not see Inflation (7.9%), however, it is still below the red line..!
Based on my forecast if YOY inflation passes 8.5% it will fly far above it and soon it will be double..!
Notice: We are going to experience a super volatile week: Interest Rate + Economic Projection + Quadruple Witch..!
Best,
Dr . Moshkelgosha M.D
DISCLAIMER
I’m not a certified financial planner/advisor, a certified financial analyst, an economist, a CPA, an accountant, or a lawyer. I’m not a finance professional through formal education. The contents on this site are for informational purposes only and do not constitute financial, accounting, or legal advice. I can’t promise that the information shared on my posts is appropriate for you or anyone else. By using this site, you agree to hold me harmless from any ramifications, financial or otherwise, that occur to you as a result of acting on information found on this site.