ARVA - Potential long position ARVA – Arab Valves Co.
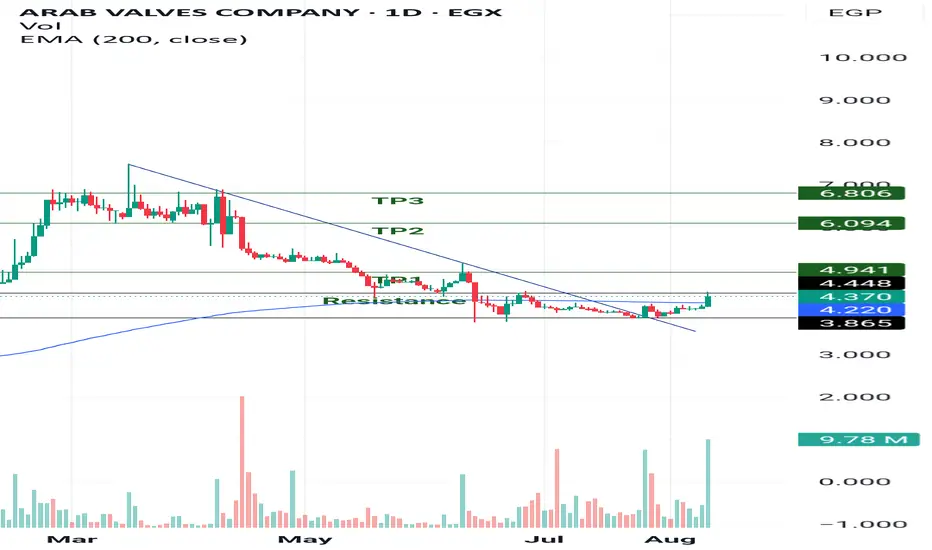
ARVA has broken a declined resistance line and successfully closed above the EMA200 today, accompanied by a trading volume higher than the 3-month average.
On the weekly chart, ARVA has rebounded from the 61% Fibonacci retracement level.
A confirmed breakout and sustained close above the horizontal resistance at 4.45 would pave the way for the following upside targets: 4.90, 6.00, and 6.80.
Trade Setup:
- Potential Buy Range: 4.40 – 4.50
- Target 1: 4.90
- Target 2: 6.00
- Target 3: 6.80
Stop Loss: Below 4.25 (confirmation required)
Note: Trailing stop-loss levels are recommended to lock in profits.
Key Level to Watch: Holding above 4.45 is crucial for maintaining the bullish outlook.
ARVA trade ideas
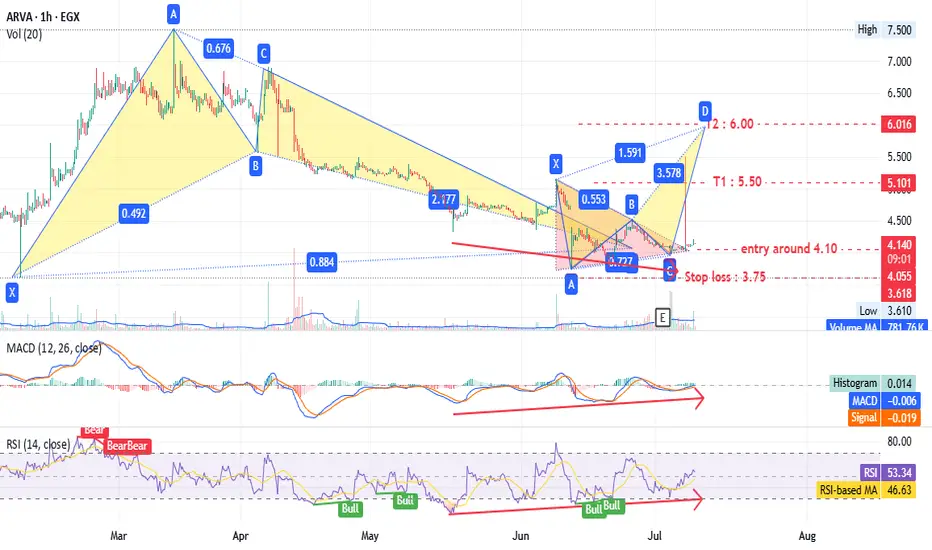
ARVA - many patterns give one target - Amazing EGX:ARVA timeframe 1 hour
Entry around 4.10
Stop loss at 3.75 (10% loss).
Targets at 5.50 and 6.00 (up to 44% profit).
Hourly chart shows a triangle pattern and bearish Gartley pattern.
Daily timeframe also indicates a bullish pattern with the same targets.
MACD and RSI support this analysis.
Note: This is not investment advice—only my analysis based on chart data. Consult your account manager before investing. Good luck!
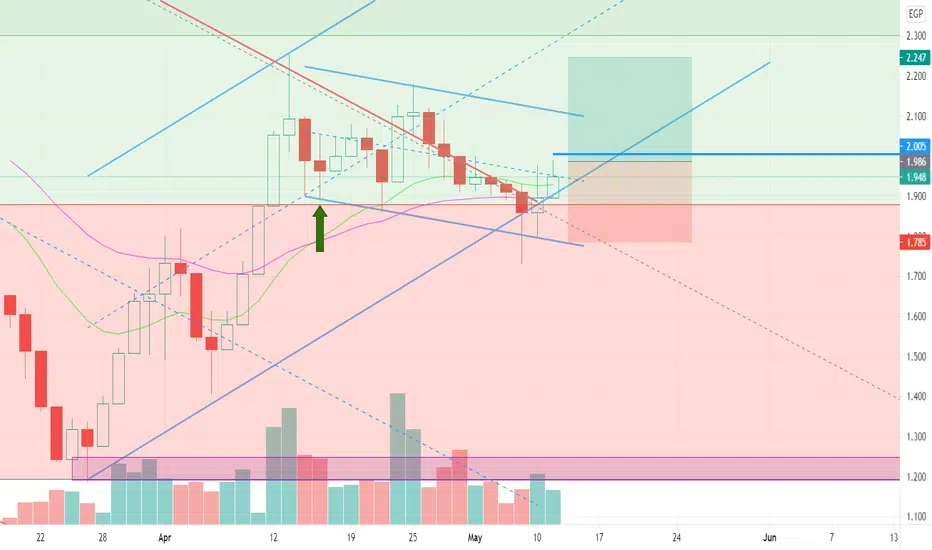
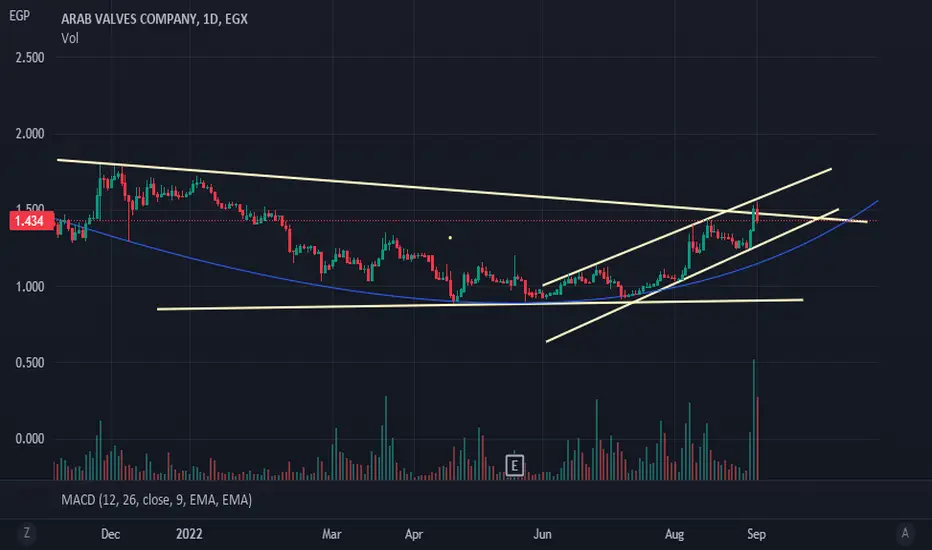
ARVA Rounding bottom and channel chartAs we can see down below the stock is moving between the prices of a channel and is continuing with the rounding bottom chart formation. Almost hit the high of the channel might test it again and might go to the down line to bounce back to a higher high accordingly. to be followed
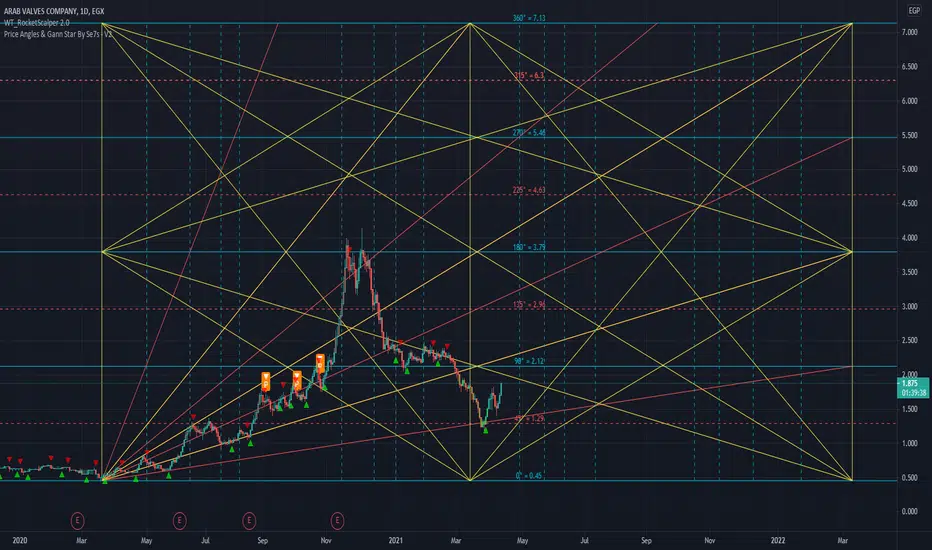
Arva Important levels and TIME!Support and resistance lines..
horizontal lines are Support/Resistance .
Vertical lines are time pivots .
Appreciate your Comments.
GL
1.16
.88
.60 <
Wake me up Later.
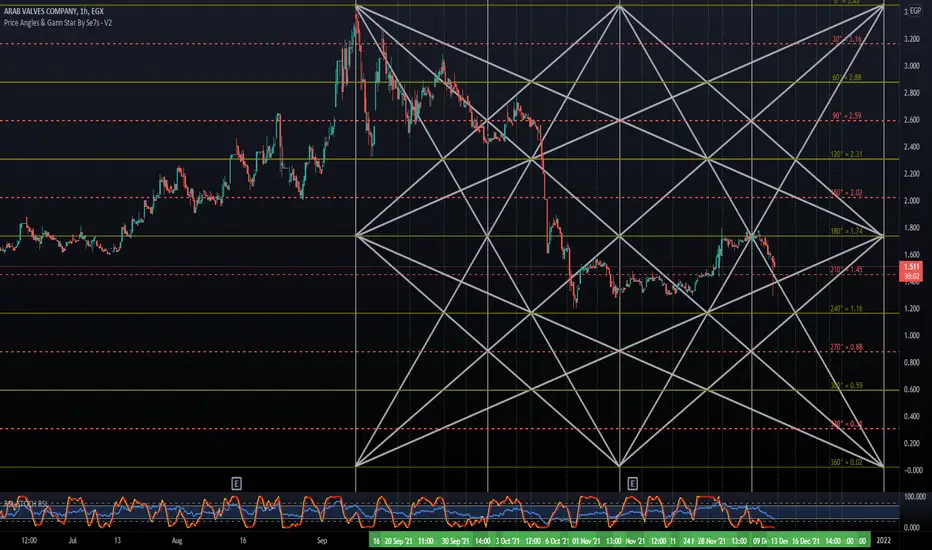
Gann star, Gann fansupport and resistance lines..
horizontal lines are Support/Resistance .
Vertical lines are time pivots .
Appreciate your Comments. GL
Gann fans in pink...works as support and resistance.