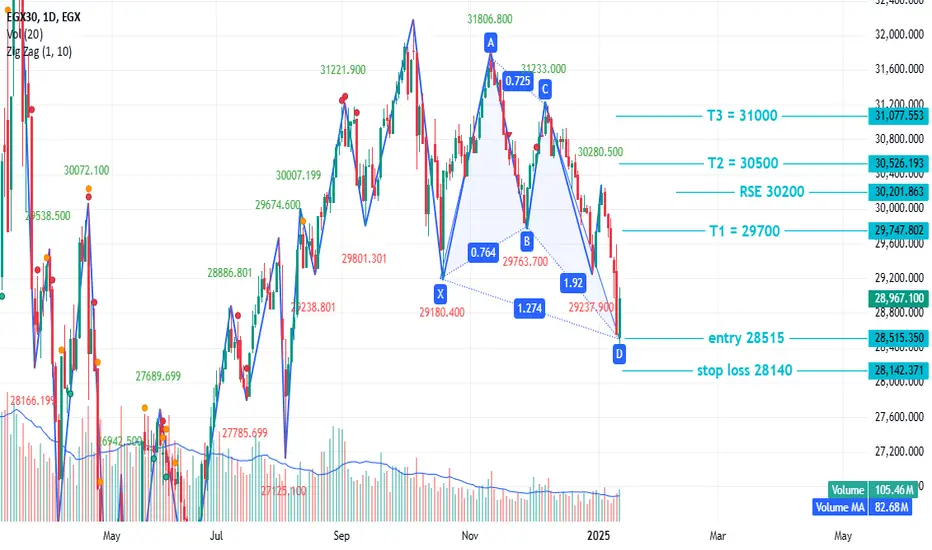
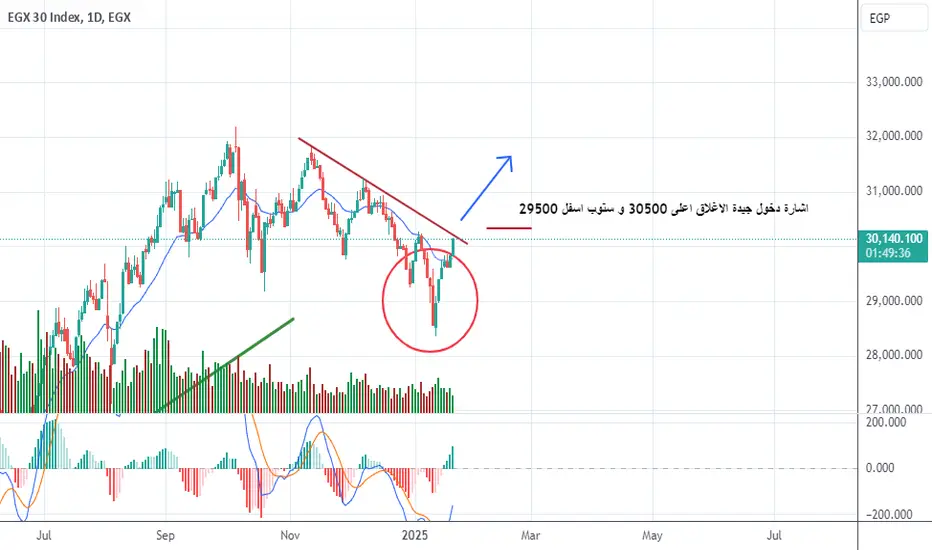
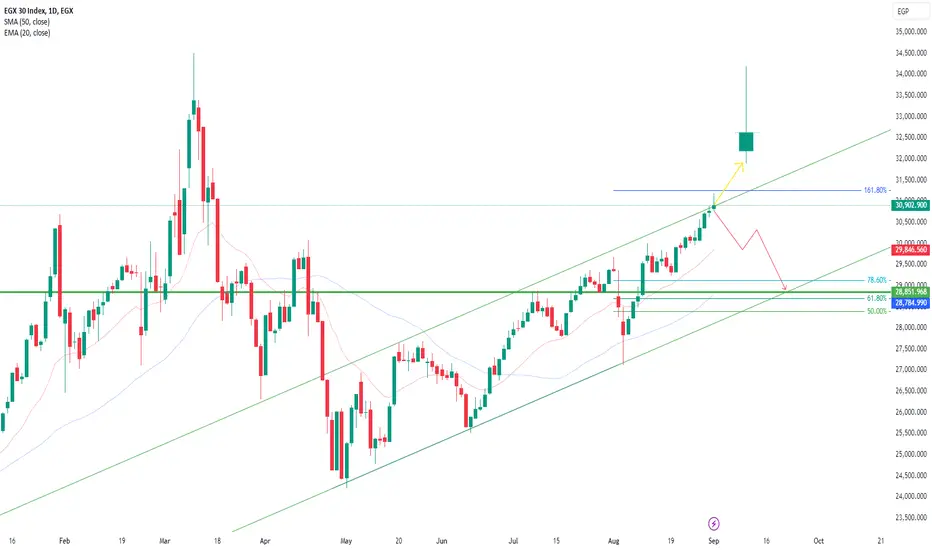
EGX30 - Egyptian market index - good news#EGX30 - time frame 1 DAY
created 2 Bullish pattern ( Gartley and AB=CD ) , Action price in this point already done ,but in anther hand we are still in a downtrend targeted 28050 to 27000 unless closed weekly uber 32200 .
now we have a chance to improve our investment as follow :
Entry level at 28515 ( already done , closed today at 28967 )
Stop loss 28515 ( daily close , may index achieve this target but close uber it )
First target at 29700 ( if index close uber 29700 it will be good support )
there is resistance point at 30200 before achieve next target
Second target 30500
Third target 31000 ( if index achieved this target and closed weekly uber it , It will be a good indicator of the beginning of entering an upward phase and the end of the decline )
NOTE : this data according to time frame I DAY ,
NOTE ; EGX30 still have lower target up to 27000 so my advice is don't be Very optimistic but be careful .
Its not an advice for investing only my vision according to the data on chart
Please consult your account manager before investing
Thanks and good luck
EGX30 trade ideas
EGX30… Our Warning Came True, and Our Followers Didn’t Lose!We previously warned about EGX30 and clearly stated: Confirmation is required for the breakout! But what happened? It was a false breakout, and now the index has broken the channel downward and breached important moving averages! ⚠️📉
🔴 The biggest risk: If it breaks below 29,315, the trend will turn strongly bearish, and the probability is very high!
⚠️ Our warnings were clear, and those who followed us avoided this risk! Don’t make the same mistake—follow us now so you don’t miss future insights!
💬 Have any questions? Drop them in the comments, and follow us now to stay ahead! 🔥👇
#EGX30 #StockMarket #TechnicalAnalysis #Trading #Investing

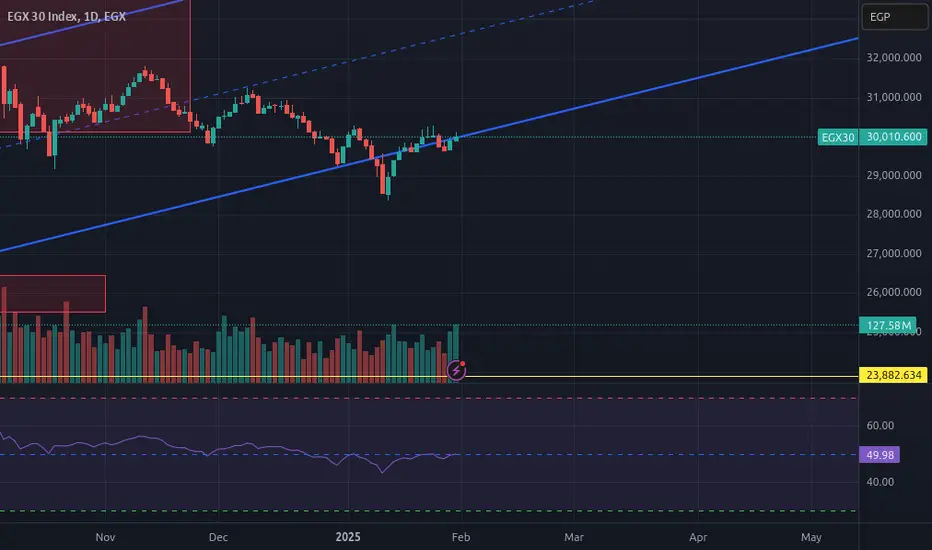
EGX30 on Watch – Weak Weekly Candle!The weekly candle is weak, signaling caution! Don't rush—wait for a channel breakout and confirm stability. Entry conditions:
✅ Two consecutive sessions closing inside the channel
✅ Closing above the lower boundary of the channel
🚨 Entering before confirmation = high risk! Stay patient and make smart decisions!
⏳ Follow me for real-time updates and don’t miss the next move!
🔔 Hit Follow & Stay Ready! 📊📉
#EGX30 #StockMarket #Trading #TechnicalAnalysis #RiskManagement #Investing #Stocks #TradingSignals #FinancialMarkets #TradingView
EGX 30 end of correctionMy point of view for the EGX 30 next coming days and we have a good hammer in weekly frame and tomorrow in shaa allah closing above the mentioned entry point will give us a turbine jump above on daily basis , and closing above the hammer in weekly frame, thank god for coming back EGX 30 ,
Hesham Fouad
note please wait for entry points to be achieved before entering the market , don't forget to use stop loose for risk management
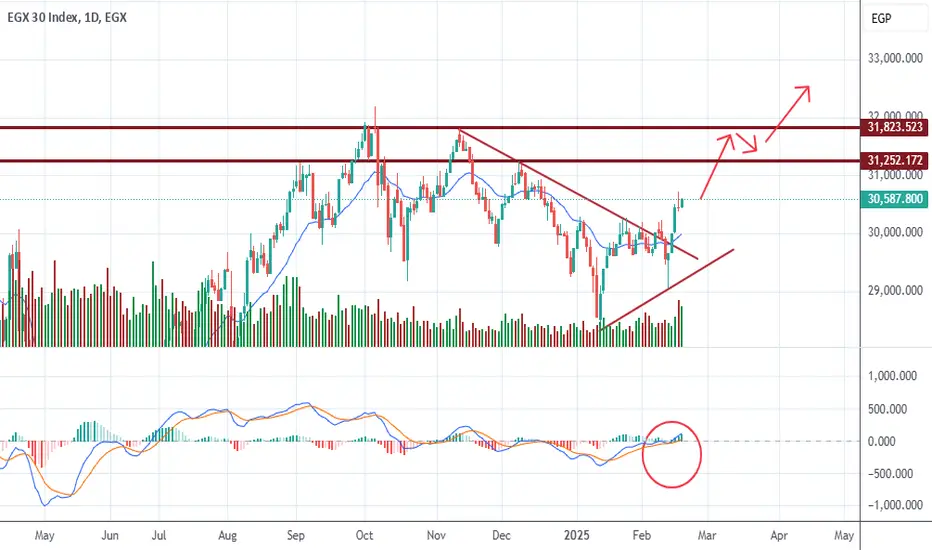
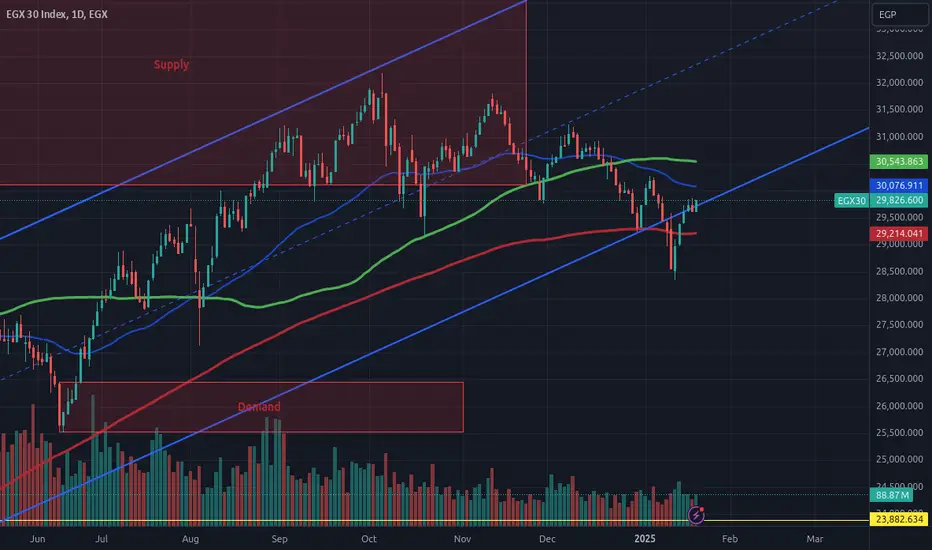
Play the patience game!(Egx30 Recommendation )Don't let greed push you into impulsive buying or selling. Wait for breakouts to confirm the next move!
🔻 Support level: 29,214
🔺 First resistance: 30,076
🔺 Second resistance: 30,543
⚠️ Recommendation:
No entry before a confirmed breakout above 30,543. This level indicates a strong bullish move. Until then, stay on the sidelines and avoid unnecessary risks."
#TechnicalAnalysis #TradingTips #Patience
Egx 30 Egyptian stock As appearing on the chart
EGX30 has made ab=cd pattern
That's give it 2 low targets
1- 29630 ( done then made a little correction )
2- 28057 up to 27500 ( in progress )
In addition MACD appears negative diversion
Lower bottom than the previous although egx30 show the opposite
Note : This vision according to the ab=cd pattern And the MACD diversion
And it's cancelled by closing daly above 32185
Its not an advice for investing only my vision according to the data on chart
Please consult your account manager before investing

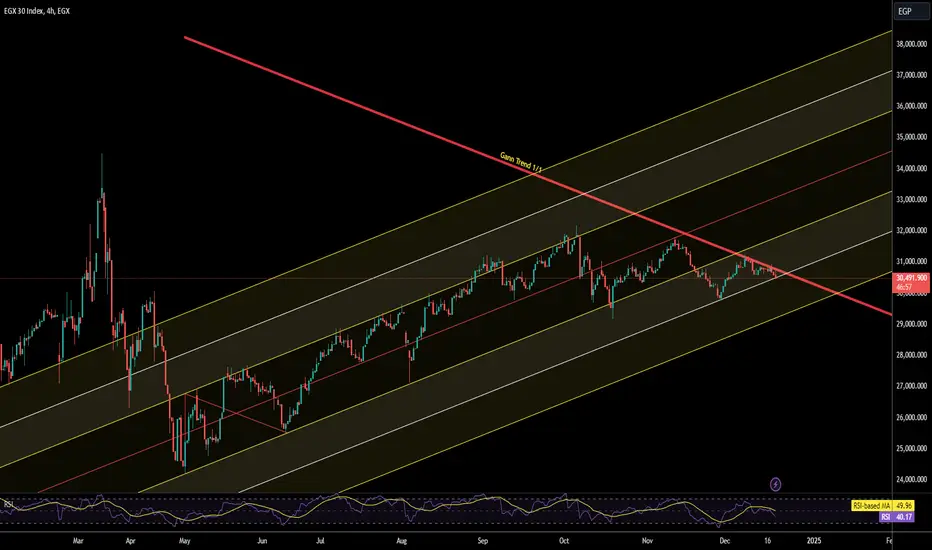
Technical Analysis of EGX 30 Index ChartHello Dear Traders,
### **1. Overview of the Chart**
- **Gann Trend 1/1 Line:** Represented by the red diagonal trendline, indicating a significant Gann angle.
- **Parallel Channels:** Yellow and white lines represent upward-sloping price channels.
- **Current Price:** **30,474.90 EGP**
- **RSI Indicator:** The Relative Strength Index (RSI) is displayed at the bottom to show market momentum.
---
### **2. Key Observations**
1. **Price Position Relative to Gann Line:**
- The price is hovering **near the Gann 1/1 line** (red trendline) acting as resistance now..
- This line acts as both a **support** and a **resistance**. A break above this line may trigger further bullish momentum.
2. **Price Channels:**
- The price is trading within an **upward-sloping channel**.
- **Midline (white):** The price has been consolidating near this critical area. A sustained move below this level could target the lower channel boundary.
- **Upper Boundary:** Resistance lies near **32,000 - 33,000 EGP**.
- **Lower Boundary:** Support near **30113 - 29,000 EGP**.
3. **RSI Analysis:**
- **Current RSI Value:** **39.60**, which indicates the market is **approaching oversold conditions**.
- **RSI-based Moving Average:** **49.92** shows bearish momentum.
---
### **3. Potential Scenarios**
#### **Bullish Scenario:**
- **Condition:** Price holds above the **Gann 1/1 line** and rebounds towards the upper channel.
- **Target Levels:**
- **32,000 - 33,000 EGP** (upper boundary).
- **Current support from here to **30,113 EGP**
---
### **4. Recommendations:**
- **Short-term Traders:** Watch for price behavior near the **Gann 1/1 line** and RSI support.
- **Breakout Watch:** Monitor price for a break above the current channel midline.
- **Confirmation Signals:** Use **RSI divergence** or price reaction near **30,113 EGP** for entry signals.
EGX 30 Downtrend I believe EGX on Down Trend unless there's is a major shift in market structure or Economic situation
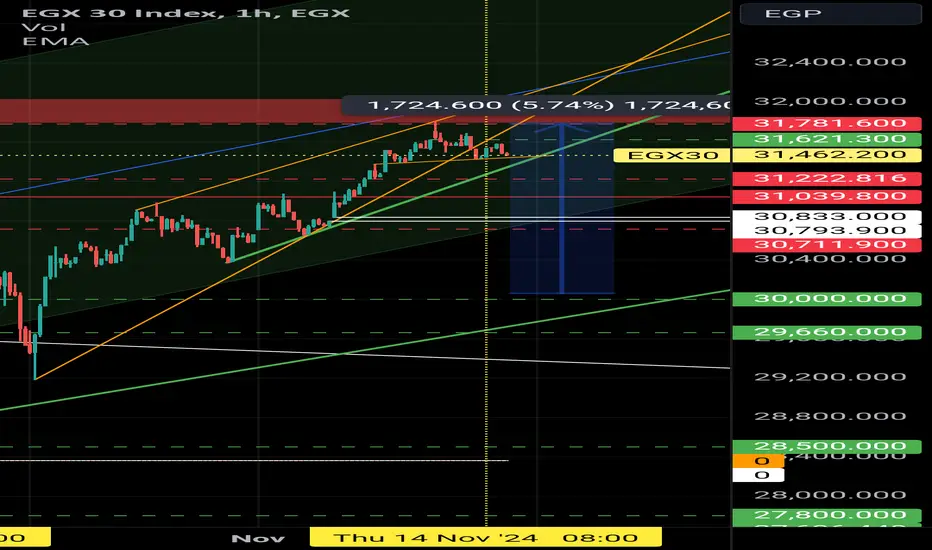
EGX30 analysis..-A sideways movement tending to the downside is expected this week.
-Note that it is a head and shoulders pattern with a bearish target. The lower limit of the ascending price channel, specifically the area 30833 to 30793. There is no need to worry, it is simple speculation in the upward direction.
- I advise reducing negative positions and committing to supporting your stock And repurchase when the target is achieved, which is 30,900. This is not the case if 31800 is hacked. Thank
--------dont forget to support my idea---
Comprehensive EGX30 Analysis (Sept 8, 2024)
Given the current market conditions, we’ll integrate a detailed analysis of EGX30 using a variety of technical indicators: Price Action, Ichimoku Cloud, Bollinger Bands, ATR (Average True Range), Support & Resistance, Cash Flow, PVT (Price Volume Trend), and the Law of Diminishing Returns. Let’s go step by step.
1. Price Action Overview:
• Current Price: 30,665.90 EGP, showing a decline after a recent rally.
• Candlestick Formation: The chart currently suggests a bearish candle with wicks on both ends, indicating market indecision and potential for further correction.
• Support Levels:
• Support 1: 29,933.43 (R1) — Strong support level where buyers previously stepped in.
• Support 2: 29,844.60 — If this level breaks, we could see deeper corrections towards 29,500.
• Resistance Levels:
• Resistance 1: 31,221.90 (High) — Immediate upside cap based on previous highs.
• Resistance 2: 32,274.29 (DynaR RES 2) — Longer-term upside target if the market recovers.
2. Ichimoku Cloud Analysis:
• Ichimoku Lagging Span: The lagging span (Chikou Span) is currently indicating bearish momentum as it has moved below recent price action, confirming downside pressure.
• Kumo (Cloud): The price is hovering near the top of the cloud, and any further decline would push the index deeper into the cloud, confirming a neutral-to-bearish trend. A break below the cloud could signal a more prolonged downtrend.
• Tenkan-sen & Kijun-sen Cross: No cross is currently visible, but the Kijun-sen (baseline) is flattening, indicating consolidation. A bearish crossover would strengthen the downside momentum.
3. Bollinger Bands:
• The price is testing the upper Bollinger Band, suggesting the index is in an overbought zone and may experience mean reversion.
• Middle Band: The middle Bollinger Band (~30,300) will serve as the first area to watch for a bounce if the price continues to correct downward.
• Lower Band: Any strong correction might take the price towards the lower Bollinger Band around 29,800, which aligns with critical support levels.
4. Average True Range (ATR):
• ATR: 0.5 — A low value suggests that the market volatility is decreasing. With ATR declining, the potential for explosive moves diminishes, but this can change quickly if there’s an external trigger (such as fundamental news or a major market event).
• Conclusion from ATR: Lower volatility suggests that if we see price movement, it might be more gradual, indicating the importance of monitoring consolidation or breakdowns at key levels like 29,933 and 29,844.
5. Support & Resistance:
• Support:
• Immediate: 29,933.43 — Strong support zone. If broken, it could trigger a sell-off toward 29,844.
• Secondary: 29,500 — If the market sees a significant breakdown, this is the next key support level.
• Resistance:
• Immediate Resistance: 31,221.90 — Recent high and critical resistance level.
• Secondary Resistance: 32,274.29 — Longer-term target if the market rebounds with strength.
6. Volume & PVT (Price Volume Trend):
• PVT (Price Volume Trend): The PVT has started to flatten after a brief spike, suggesting that buying momentum is slowing down.
• Volume: The total volume stands at 40.267M, which is above the average (Volume MA: 207.369M). However, we see lower volumes in recent candles, signaling reduced conviction from buyers, which could foreshadow a retracement.
7. Cash Flow Analysis:
• Cash Flow Index: 31,106.76 (below signal line). This indicates potential liquidity outflows from the market, suggesting that investors might be taking profits at current levels.
• Signal Line: The CASHFLOW signal at 31,221.90 confirms this is a critical level. If the price fails to break above, it will signal a weakening bullish trend.
8. Law of Diminishing Returns:
• With the recent rally losing steam, the law of diminishing returns comes into play. As the index has already made substantial gains in the past week, the market is showing signs of exhaustion. Any further gains may require significantly more buying power, which the reduced volume suggests is lacking. This could explain why we’re seeing stronger resistance and reduced momentum.
Conclusion:
• Short-Term Bias: Bearish/Neutral. Expect a pullback to support levels. Key level to watch: 29,933.43. If it breaks, further downside is likely.
• Medium-Term Bias: The market could rebound if it holds the 29,933 support. Look for potential upside toward 31,221.90 as a take-profit target for short-term traders.
• Long-Term Bias: If the market clears the 32,000 resistance zone, the next leg up could test 32,274.29. However, any failure to hold key support may trigger a retest of 29,500.
Trade Setup:
1. Entry Point: Watch for the price to hold above 29,933.43 for a potential long setup, or short below this level.
2. Stop Loss: Place stops below 29,844.60 to protect against further downside.
3. Take Profit:
• Conservative Target: 30,300 (Bollinger middle band).
• Aggressive Target: 31,221.90 (resistance level).
Always manage risk, especially given the current overbought conditions and lower volatility.

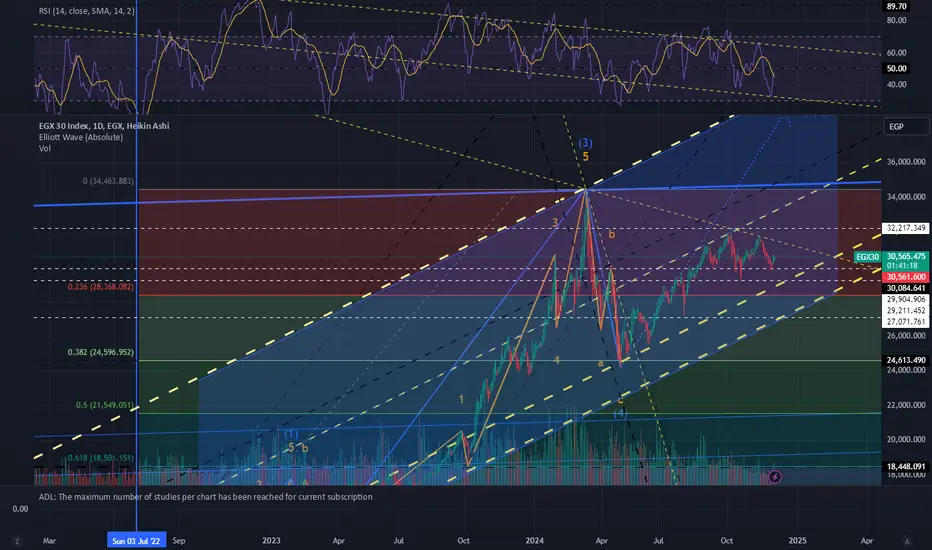
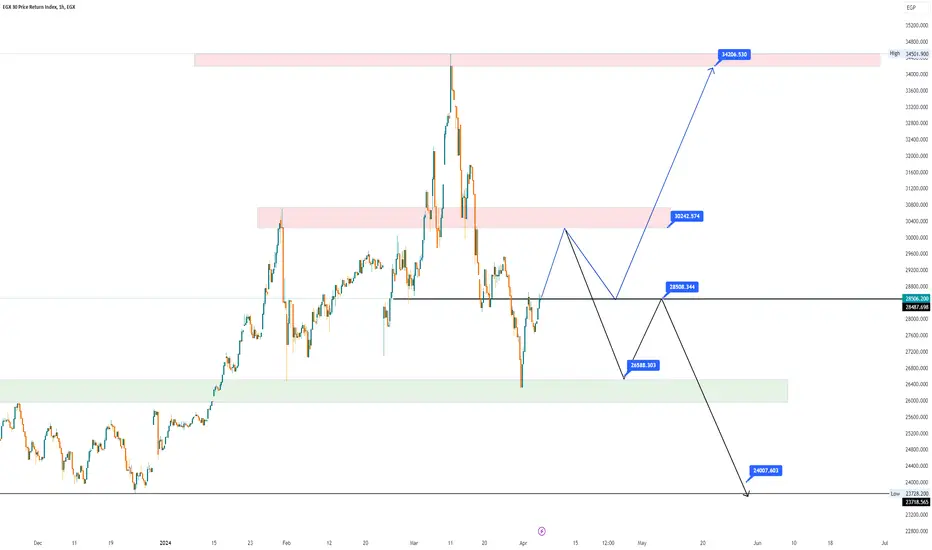
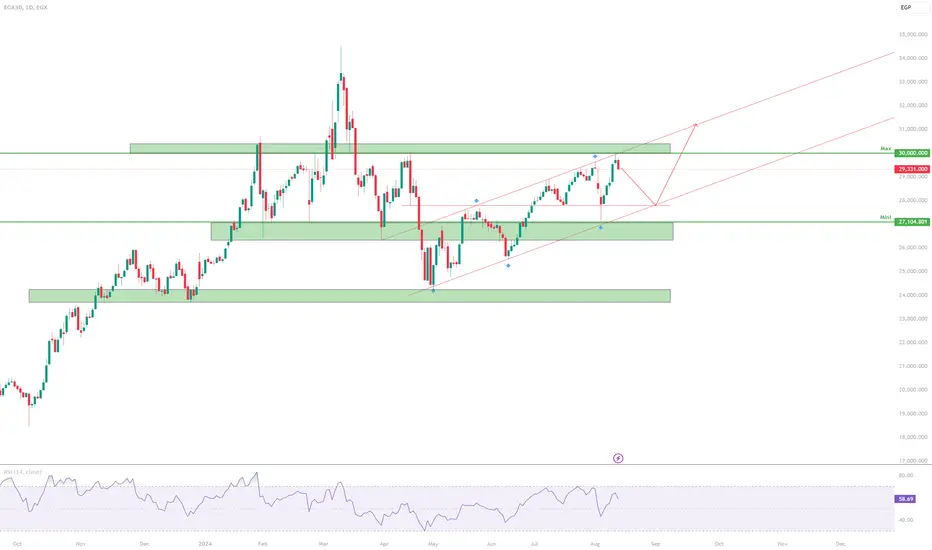
EGX30 Possible Scenarios EGX30 Possible Scenarios :
1. Bullish scenario following the blue lines.
2. bearish scenario following the black lines.
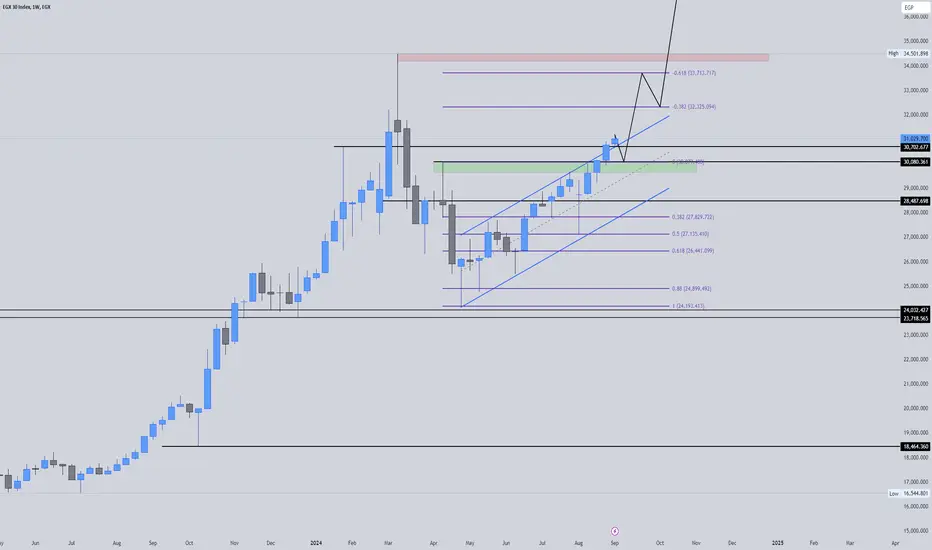
EGX30 Bullish ScenarioEGX Bullish after reaching 31000 the current scenario targeting 39.500 Fibo 1.618
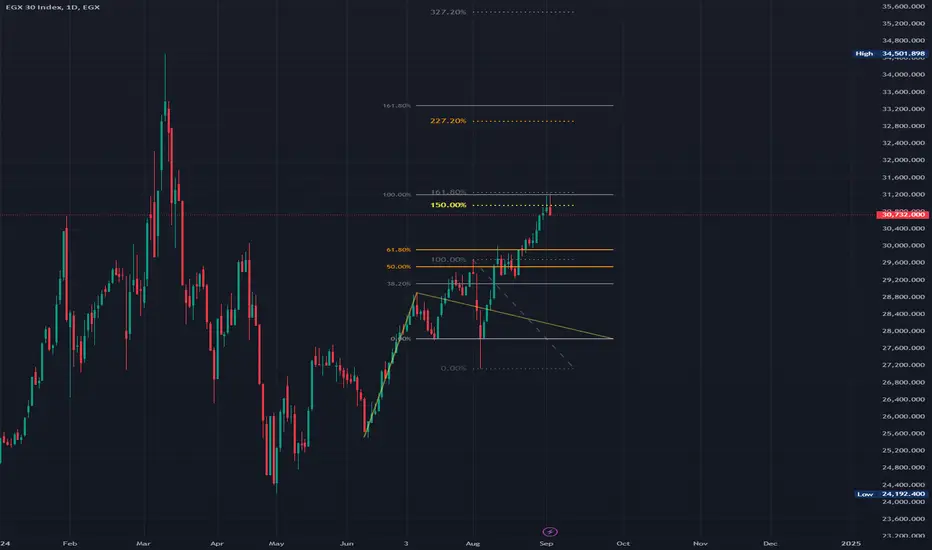
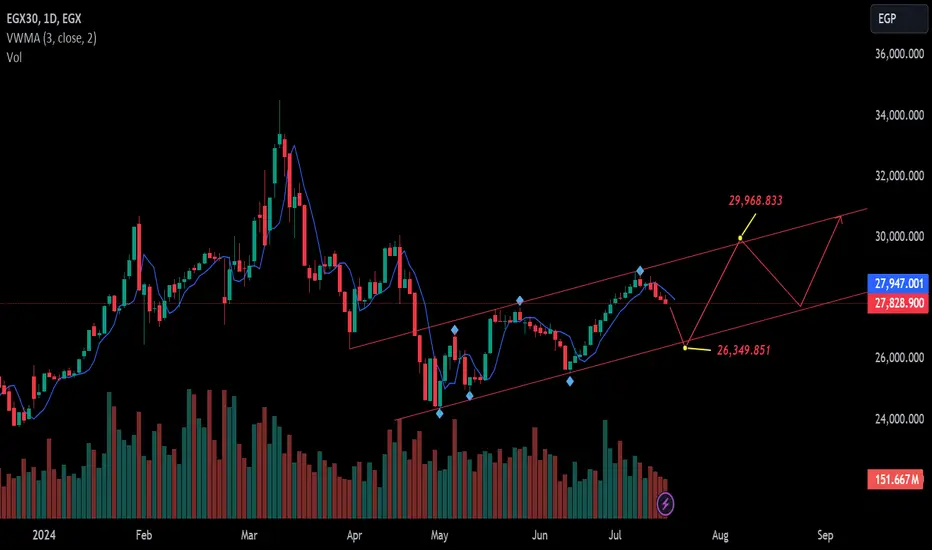
EGX30 is at a critical targetFib trend-based extension from June till July target 31,200
It can drop to 29,600
EGX30 may correctsimple as mentioned in title
i feel EGX30 will correct soon
it is good idea to reduce Whight and reentry level 28500
you know me this is not advice to buy or sell
EGYX 30 uptrend, nevertheless counter trend is ready to launch with reach to 30,000 points the EGX 30 may need to take a break before the breaking 30,000 level.
the trend momentum is not too much strong.
for short traders in the markets profit taking and re-entry from lower edge of the uptrend channel
for medium term hold
the above is not advice for trading
sell mode for EGX30waiting for buying signal near 26300 then, while volumes is not good, so care is needed
Tom & Jerry's Market Chase: ABUK EditionTom & Jerry's Market Chase: ABUK Edition
Narrator:
"In the dynamic world of stock trading, it's all about understanding the correlations. Just like in our Tom & Jerry chase, knowing how ABUK moves in relation to EGX30 and EGX33 can help traders stay ahead of the game."
--------
Scene: Tom (EGX30) and Jerry (ABUK) are back at it again in their never-ending chase around the stock market, with a new twist—Spike the Bulldog (EGX33) is joining the fray!
Narrator:
"In today's episode, we see ABUK's performance as a cheeky Jerry, always finding a way to outsmart Tom (EGX30). Interestingly, whenever Tom seems to be on the losing end, Spike (EGX33) steps in to back up Jerry."
Tom (EGX30): "Grrr... every time I make a move, Jerry runs in the opposite direction! It's like we're inversely correlated or something!"
Jerry (ABUK): "Hehe, Tom, you just don't get it. I dance to a different tune. Whenever you go up, I go down. And when you drop, I rise to the occasion!"
Spike (EGX33): "That's right, Jerry! We're in sync, buddy. When I grow stronger, you do too! It's all about our strong correlation, leaving Tom scratching his head."
Narrator:
"Watch as Tom (EGX30) struggles to keep up with Jerry (ABUK), only to find Jerry always has a trick up his sleeve. Meanwhile, Spike (EGX33) ensures Jerry stays ahead of the game."
Tom: "One day, Jerry... one day, I'll catch you!"
Jerry: "Keep dreaming, Tom! With Spike by my side, you’ll always be two steps behind!"
And so, the chase continues, with Jerry always one step ahead of Tom, thanks to his strong correlation with Spike, leaving Tom perpetually frustrated.

EGX30 USD Based Vs. EGPWith the EGX30 index showing a promising 1.44% increase in EGP, it's a bit like the Egyptian national football team clinching a spot in the World Cup, driven by Mo Salah's dazzling offense and Shinawy's impenetrable goalkeeping, reminiscent of the mighty Aswan Dam. The difference between the EGX30's actual value in EGP (25,896) and its USD equivalent (25,528) is 368, symbolizing the team's unwavering determination. This percentage increase hints at positive market movement, akin to Egypt's dynamic play on the field. Just as the team's success is underpinned by strong fundamentals, Egypt's economic stability and favorable conditions attract hot money investors, eager for short-term gains but wary of market volatility. Like passionate football fans rallying behind their squad, these investors seek solid returns and a stable environment. If the EGX30 continues to capitalize on Egypt's robust economic policies, favorable interest rates, and a stable political climate, it could mirror the team's winning streak, drawing in capital the way the national team draws in supporters. In this dynamic landscape, the EGX30 stands poised, much like Salah ready to strike, captivating hot money investors with its potential for growth and stability.

The Jungle Battle: Bulls vs. Bears in the EGX30The Jungle Battle: Bulls vs. Bears in the EGX30
In the wild jungle of the EGX30, the bulls and bears are in a fierce fight for dominance. Today, the local institutions and local Egyptians were the main driving force behind the bearish market. Unfortunately, there are no certainties in this untamed market, only the struggle between the bulls and the bears. The winner in this battle will be determined by the liquidity flowing into the market.
Liquidity is the lifeblood of this jungle. When a large number of investors bring new money into the market, the bulls charge forward, driving prices up. Conversely, when investors withdraw their funds, the bears take control, dragging prices down.
For the EGX30, the current landscape shows significant support levels at 25,506, 25,421, and 25,343. These are the strongholds where the bulls may regroup and mount their defense. On the other hand, the resistance levels stand at 26,050, 26,264, and 26,234. These are the barriers the bulls must overcome to claim victory.
Today's bearish performance, driven by local institutions and local Egyptians, underscores the importance of understanding the intricate dance of market forces. Our analysis integrates a comprehensive suite of technical tools, including Fibonacci retracements, linear regression, trendiness indicators, support and resistance levels, MACD, RSI, stochastic RSI, RVI, VPT, the Law of Diminishing Marginal Returns, ATR, Bollinger Bands, Elliott Waves, classical patterns like head & shoulders and falling/rising wedges, and finally, the bread & butter analysis done by Ichimoku Kinko Hyo. The candlesticks are represented by Heikin Ashi for a clearer view of market trends.
The ongoing fight for liquidity and investor interest will be crucial. Without positive liquidity inflows and renewed interest from investors, the disappointing performance may persist. In this jungle, the battle continues, and the next moves of the bulls and bears will determine the market's direction. Stay vigilant and watch the flow of liquidity closely, for it is the key to understanding who will emerge victorious in the EGX30.

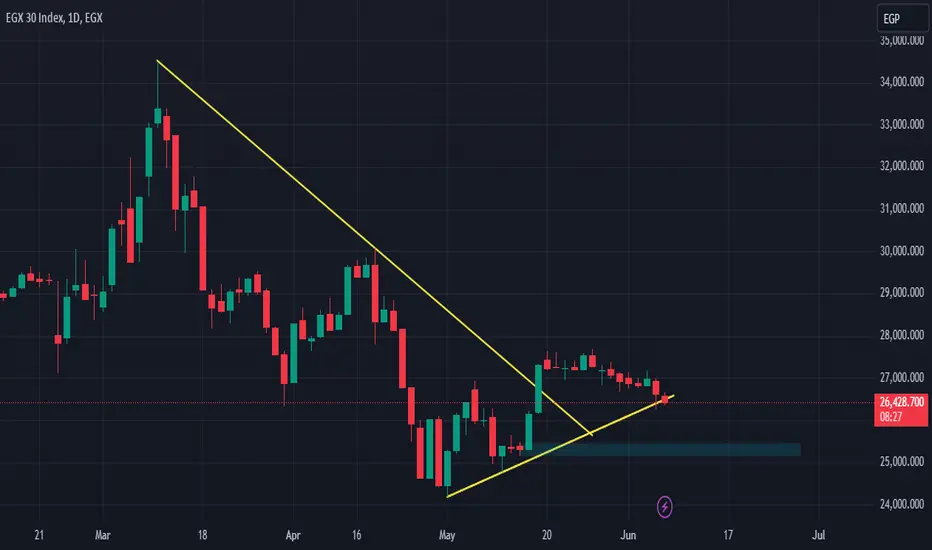
WAIT FOR EGX30 UPWARD MOVEhigher lows with breaking of downtrend with bullish move then retracement happened with no sign of big bearish movement so expect upward move after fomration of bullish momentum again
EGX30 OUTLOOK….El Clásico Unfolds: Barcelona Battles Real Madrid
In the highly anticipated matchup between Barcelona and Real Madrid, akin to the recent market dynamics in EGX30, a notable shift in sentiment is witnessed. The sequence of three red candles reflecting a downtrend mirrors the tactical back-and-forth in the early stages of the game. The emergence of a green doji candle signifies a period of uncertainty and strategic positioning on the field, while the subsequent red hammer candle, reminiscent of a long lower wick, hints at strong offensive plays and potential game-changing moments in favor of one team.
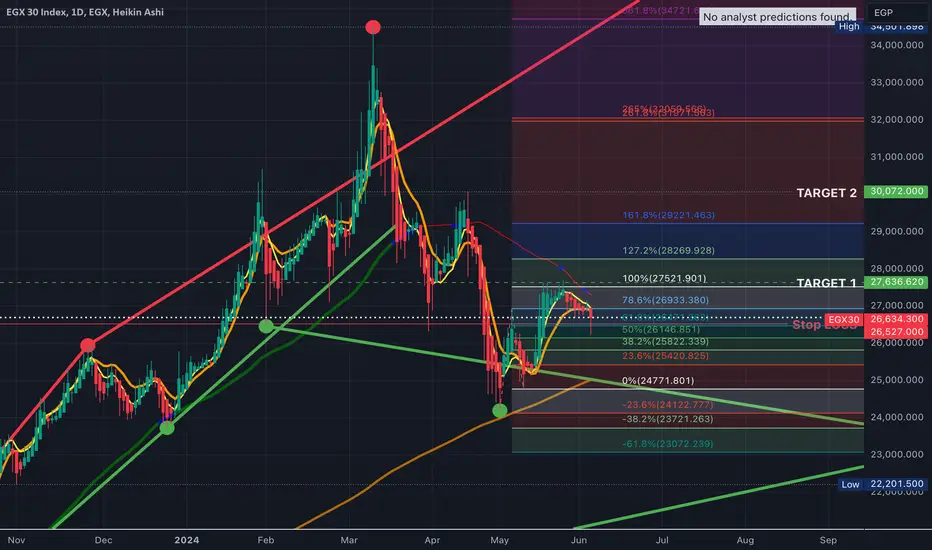
The candle patterns observed, particularly the hammer candle and the preceding doji, point towards a potential reversal in momentum from a defensive to an attacking stance. With support levels like immediate backing around key ranges and psychological stronghold at strategic points like the 26,000 level, the teams maneuver around these zones akin to players seeking strategic advantages on the field. Resistance levels, such as the impending challenges presented by 27,000 and the formidable 61.8% retracement point at approximately 27,316, act as critical hurdles to overcome for both teams aiming to secure dominance in the game.
Moving averages, similar to analyzing player performance over a season, offer insights into the ongoing momentum and potential shifts within the match. Meanwhile, indicators like the Relative Strength Index (RSI) and the MACD (Moving Average Convergence Divergence) serve as valuable tools akin to understanding player stamina and making strategic substitutions to turn the game around in one's favor.
Amidst the volume analysis spotlighting the intensity of actions and reactions by both teams on the field, indicators like Fibonacci retracement levels become the strategic playbook for setting and surpassing performance targets and breaking through crucial resistance zones for a victorious outcome. Just as in football, where every pass, shot, and tackle can shape the final result, in the world of market analysis, each candlestick pattern, support level, and indicator plays a vital role in determining which team emerges triumphant in this exhilarating face-off between Barcelona and Real Madrid.
_______—————______
Recent Price Action and Candle Patterns
- Three Red Candles: This indicates a clear downtrend driven by selling pressure.
- Green Doji Candle: Signals market indecision; it represents a potential weakening of selling pressure or the emergence of buyers.
- Red Hammer Candle: The long lower wick indicates strong buying interest at lower price levels, suggesting a potential reversal of the downtrend.
Together, these patterns suggest a potential shift from bearish to bullish sentiment. The formation of the hammer candle after a series of red candles and the doji points to a possible upward trend reversal.
We will use Fibonacci retracement levels and recent price action to determine potential support and resistance levels.
Support Levels
1. Immediate Support - Around 26,227 to 26,695
- Significance: This range is indicated by the long lower wick of the hammer candle. It shows a significant buying interest where price action encountered strong support.
- Reasoning: The long lower wick specifically emphasizes a potential reversal zone due to the buying pressure that pushed the prices back up from around 26,227 to 26,695.
2. Psychological Support - 26,000
- Significance:Round numbers often act as psychological support levels.
- Reasoning:Traders typically place buy orders around such levels, expecting a bounce or reversal.
3. Fibonacci Support - 50% Retracement Level (~26,528)**
- Significance:The 50% retracement at this range indicates strong support given it is a common retracement level where prices often find support during a pullback.
- Reasoning:Falling back to this level often symbolizes a reasonable correction in the overall trend.
Resistance Levels
1. Immediate Resistance - Around 27,000
- Significance: This level is close to where the upper wick of the recent hammer candle ends (~26,972), making it a psychological resistance level.
- Reasoning: Psychological levels such as 27,000 often act as significant barriers due to the tendency of traders to place sell orders around these round numbers. The proximity of this level to the recent hammer’s upper wick further solidifies it as a critical resistance point.
2. Fibonacci Resistance - 61.8% Retracement Level (~27,316)
- Significance: The 61.8% Fibonacci retracement line is a key level that often acts as a resistance in technical analysis.
- Reasoning: The 61.8% retracement is known as the “Golden Ratio” and often predicts substantial resistance as prices have historically reacted strongly to this level.
3. Previous Highs and Fibonacci Resistance - 78.6% Retracement Level (~28,051)
- Significance:This level, indicated as Target 1 on the chart, is crucial because it combines the Fibonacci 78.6% retracement with previous highs, forming a strong resistance zone.
- Reasoning: The 78.6% retracement level is significant in technical analysis as prices often reverse from this level. When this level also coincides with prior high points, it becomes an area where significant selling pressure is expected, adding to the resistance strength.
4. Confluence Resistance - Previous Peaks and Fibonacci Extensions (~29,300 to 29,800)
- Significance: This region, marked as Target 2, aligns with multiple technical signals, including prior price peaks and Fibonacci extension levels.
- Reasoning: This confluence zone is critical because multiple resistance signals converge here. The presence of previous peaks around this level, alongside the 127.2% Fibonacci extension, further establishes it as a heavy resistance zone due to the likelihood of accumulated sell orders and profit-taking activities from traders.
Moving Averages:
- The price is oscillating around the moving averages (such as the 50-day and 200-day moving averages).
- 50-Day MA:Acts as a near-term indicator of price momentum. Crossings of the price above or below this level can signify short-term bullish or bearish trends.
- 200-Day MA: This is a key long-term indicator. If the price breaks above this, it could solidify the bullish reversal narrative.
- Golden Cross/Death Cross: If the 50-day MA crosses above the 200-day MA (Golden Cross), it would be a strong bullish signal. Conversely, if it crosses below (Death Cross), it would indicate bearish sentiment.
- Relative Strength Index (RSI)
- Current Level: The RSI level can provide insights into whether the index is overbought (>70), oversold (<30), or in a neutral zone.
- Analysis: Given the recent downtrend followed by the potential reversal signals, a bounce from oversold levels towards the 50/60 level on the RSI would indicate increasing buying momentum.
- MACD (Moving Average Convergence Divergence):
- MACD Line vs Signal Line: A bullish crossover where the MACD line crosses above the signal line suggests upward momentum.
MACD (Moving Average Convergence Divergence):
- MACD Line vs Signal Line: Look for a bullish crossover where the MACD line crosses above the signal line, suggesting an upward momentum. A continuation of positive histogram bars (above the zero line) can reinforce the bullish sentiment.
- Divergence: Positive divergence between MACD and price action (where MACD makes higher lows while the price makes lower lows) can also suggest decreasing bearish momentum and potential bullish reversal.
Volume Analysis
- Volume Confirmation:It's important to observe the volume accompanying recent price actions. High volume during the formation of the hammer candle would indicate strong buying interest and substantiate the bullish reversal hypothesis. Conversely, if volume declines while prices rise, the current trend might lack conviction.
Additional Observations
- Fibonacci Retracement Levels:
- 61.8% Level (~27,316): This is a critical resistance level. If the price can break above this with substantial volume, it would be another strong indication of bullish momentum.
- 78.6% Level (~28,051): Already identified as Target 1, breaking this level could set further bullish targets toward higher Fibonacci extension levels.
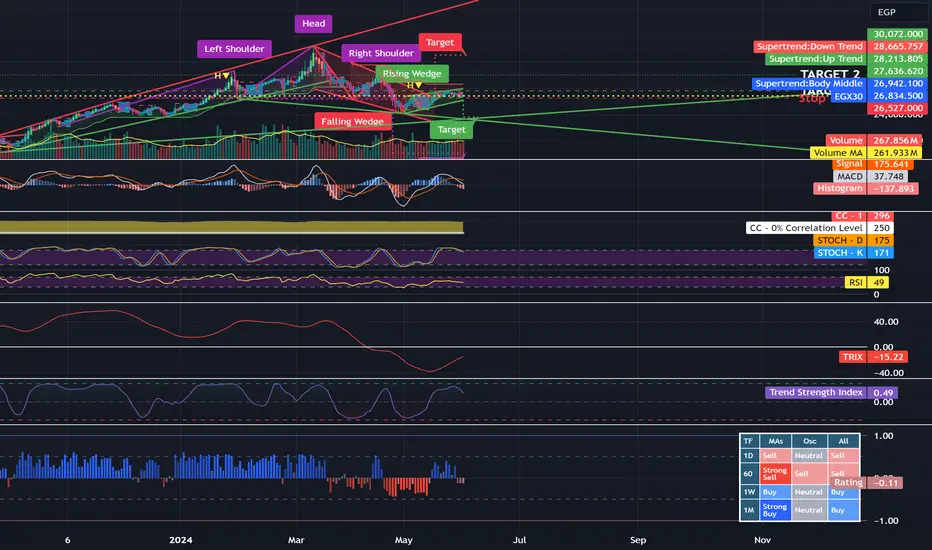
EGX30 Technical Analysis: The Tale of King TutEGX30 Technical Analysis: The Tale of King Tut and the Building of the Pyramids
I n the grand tapestry of the Egyptian markets, the current technical readings for the EGX30 are akin to the hieroglyphs etched in the ancient walls of King Tut’s tomb:
• TRIX: Like the rising sun over the Nile, the TRIX indicator is ascending but remains below the zero line, hinting at a potential shift in momentum.
• TSI: The True Strength Index (TSI) is descending from its zenith, much like the setting sun, suggesting a weakening momentum.
• Price Action: For the past three days, the market has been in a state of consolidation, reminiscent of workers pausing in the construction of the great pyramids.
• Volume: Over the past five days, the volume has been red, aligning with the 9-day moving average, indicating a steady flow of selling pressure, akin to the relentless sands of the desert.
• RSI: The Relative Strength Index (RSI) stands in overbought territory, much like an overflowing Nile, suggesting the potential for a pullback.
• MACD: The Moving Average Convergence Divergence (MACD) is above the zero line but has experienced a bearish crossover, indicating potential downside risk, like a dark cloud over the kingdom.
Chart patterns reveal:
• Falling Wedge: A falling wedge pattern has emerged, with a downside target of 23,618, akin to the base of a newly discovered pyramid.
• Rising Wedge: Prior to this, a rising wedge had formed with an upside target of 33,047, symbolizing the peak of a majestic pyramid.
• Head and Shoulders: A head and shoulders pattern still lingers, with a downside target of 17,971, representing the shifting sands of time and potential danger ahead.
These mixed signals suggest caution, as the market may be poised for further consolidation or a potential pullback given the overbought RSI and bearish MACD cross, despite the rising TRIX indicating a potential momentum shift.
Recommendations: Building Strategies Like Pyramids
1. Caution with New Long Positions: Just as ancient builders would proceed cautiously with the construction of new pyramids, avoid initiating new long positions until clearer bullish signals emerge, given the bearish indicators such as the declining TSI, bearish MACD crossover, and overbought RSI.
2. Monitor Support Levels: Keep vigilant watch over the falling wedge target of 23,618 as a potential support level. Should the price approach this level, it may offer a buying opportunity if there are signs of reversal, much like discovering a hidden treasure.
3. Watch for Reversal Patterns: Look for potential reversal patterns near the current support levels. A bullish divergence in momentum indicators (like RSI or MACD) around these support levels could signal a buying opportunity, akin to deciphering ancient scripts revealing hidden truths.
4. Evaluate Existing Positions: For existing long positions, consider tightening stop-loss orders to protect against downside risk, especially given the head and shoulders pattern with a downside target of 17,971, much like fortifying the walls of a fortress against impending threats.
5. Volume Confirmation: Pay close attention to volume. A significant increase in buying volume could indicate a potential reversal, while continued selling volume matching or exceeding the 9-day moving average suggests ongoing bearish sentiment, similar to the ebb and flow of the Nile’s waters.
6. Short-Term Trading Opportunities: Traders may seek short-term opportunities to capitalize on potential price swings within the consolidation range, but should be prepared to act swiftly given the mixed signals, much like ancient warriors ready to seize the moment in battle.
In summary, the market is showing signs of potential downside risk. Exercise caution, focus on protecting capital, and wait for more definitive signals before making significant trading decisions, much like the strategic planning required in the construction of the timeless pyramids.