MPRC - Announce your seriousness about raising pricesEGX:MPRC timeframe: 2 hours
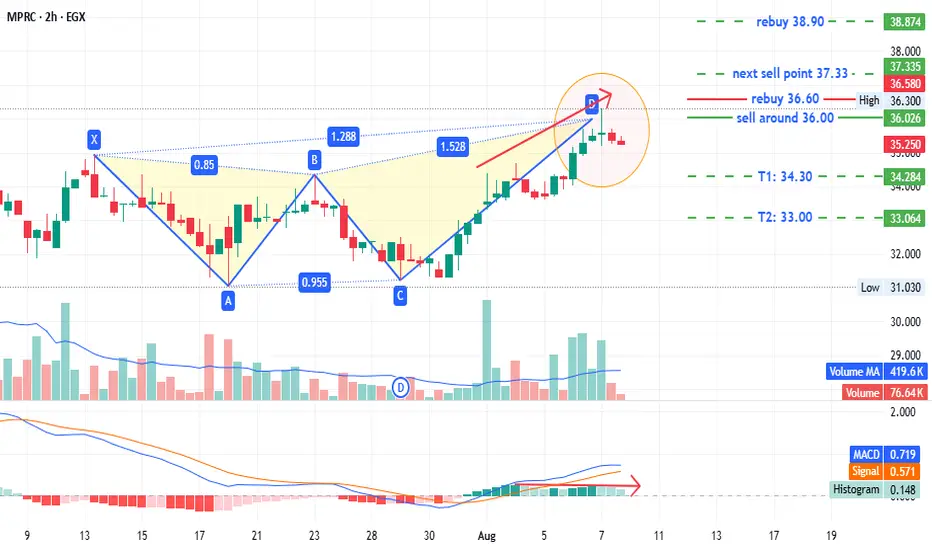
Identified a bearish Gartley pattern with:
- Sell point: ~36.00
- Targets: T1 at 34.30, T2 at 33.00
- Stop loss/rebuy: 36.60
If prices close above 36.60, the next resistance at 37.33 (1.618 extension of XA) could serve as another sell point. All data is on the chart.
The MACD shows a negative signal, supporting the bearish outlook. Meanwhile, EGX30/EGX70 are hitting new highs, which might push prices higher.
Given the multiple scenarios, adhere to stop losses or rebuy points to protect profits and minimize losses.
Disclaimer: Not investment advice; consult your account manager before acting. Good luck.
MPRC trade ideas
$MPRC - Beware of the bears trap** EGX:MPRC - 1-Day Timeframe**
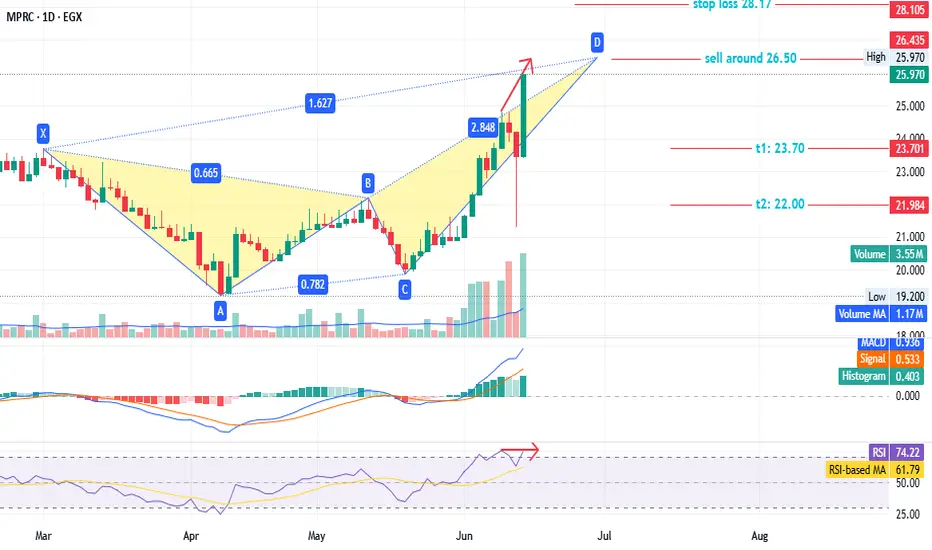
A highly complete bearish Gartley pattern is forming.
- **Sell Point:** Around 26.50
- **Stop Loss/Reentry:** 28.17 (estimated loss: -7.00%). A close above 28.17 would signal continued upward momentum.
- **First Target:** 23.70 (estimated profit: 10.40%)
- **Second Target:** 22.00 (estimated profit: up to 16.87%)
**Notes:**
- The RSI shows weakness but remains above 70, indicating strength. A close below 70 would signal a halt to the upward trend. Until then, the stock remains positive for the long term.
- This analysis is based on the 1-day timeframe.
**Disclaimer:** This is not investment advice—only my interpretation of the chart data. Consult your account manager before making any decisions. Good luck!
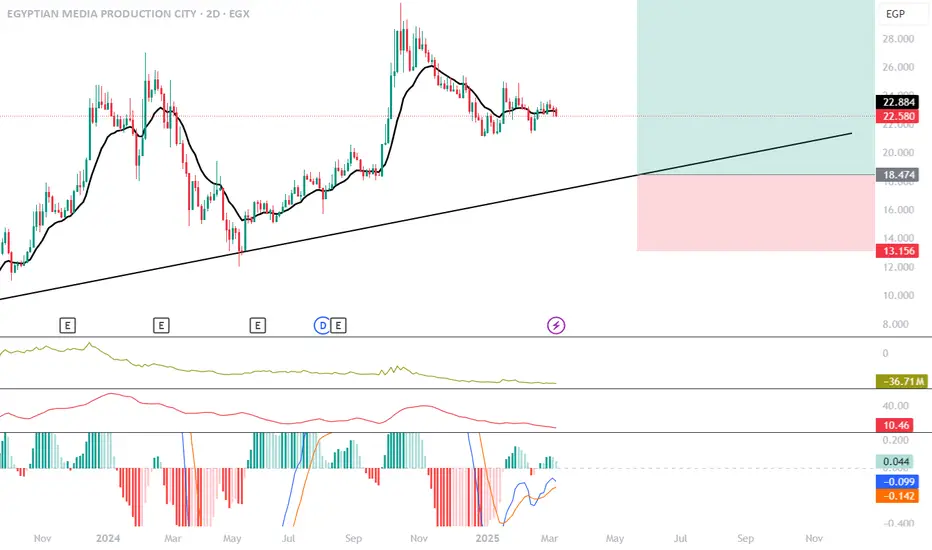
- **Entry Plan:** Expecting a **reversal from the trendlineBased on your chart analysis:
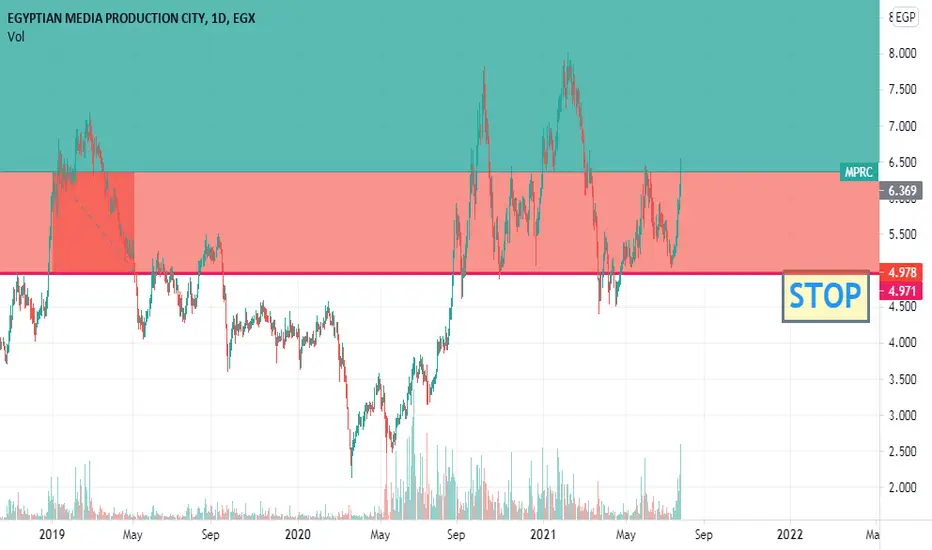
- **Entry Plan:** Expecting a **reversal from the trendline** and **60% Fibonacci level**, you plan to **start Dollar-Cost Averaging (DCA)** at current levels.
- **Stop Loss:** Placed at **13 EGP** to limit downside risk.
- **Take Profit:** Targeting **27 EGP** for a solid risk-reward ratio.
### **Additional Observations:**
1. **Trendline Support:** The price is near a long-term **ascending trendline**, which has acted as support before.
2. **Indicators:**
- The **moving average** (black line) shows a consolidation phase.
- **Momentum indicators** at the bottom suggest a potential reversal.
3. **Risk Management:**
- DCA is a good strategy if the price dips further before bouncing.
- The **stop loss at 13 EGP** is placed wisely below support to avoid unnecessary risk.
- The **profit target at 27 EGP** aligns with a previous resistance level.
Would you like a more detailed breakdown or adjustments to your trading plan? 🚀📈
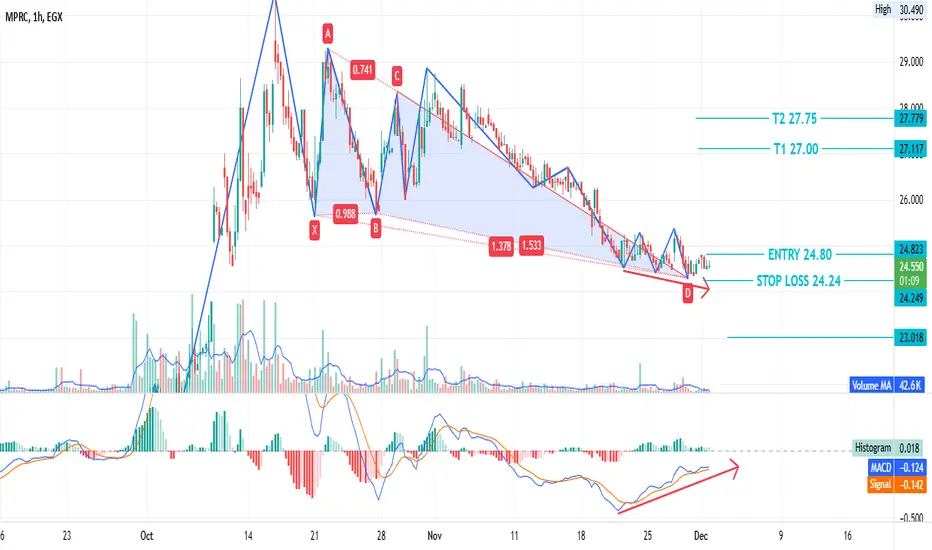
#MPRC Egyptian stock#MPRC time frame 1 HOUR
created a bullish Gartley pattern
entry level at 24.80
stop loss 24.24
first target at 27.00
second target 27.75
MACD indicator show positive diversion , may that is support our idea.
NOTE : this data according to time frame 1 HOUR
Its not an advice for investing only my vision according to the data on chart
Please consult your account manager before investing
Thanks and good luck
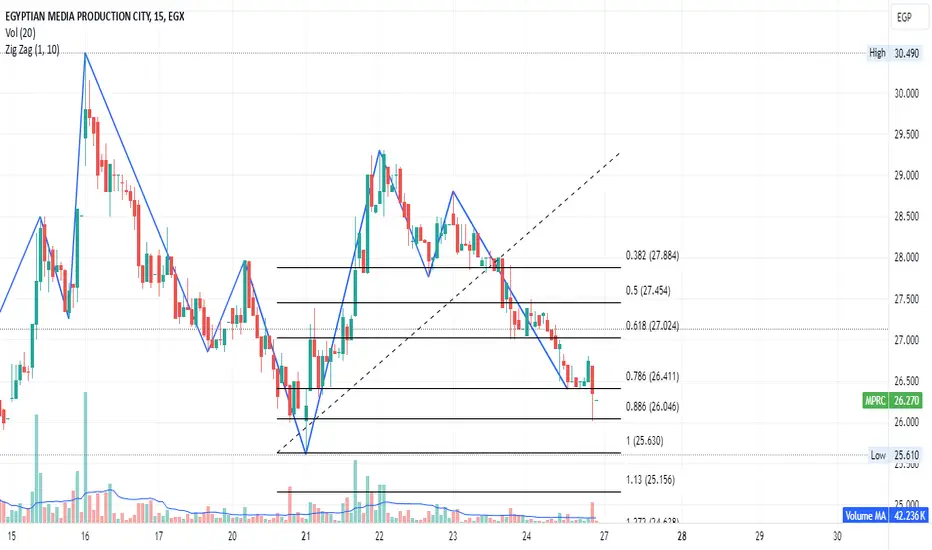
MPRC EGYPTION STOCKMPRC now at FIP (0.886) 26.01 (15M CHART)
may be target 27 TO 27.80 by stop loss 25.63
NOTE : IT is on CHART 15M
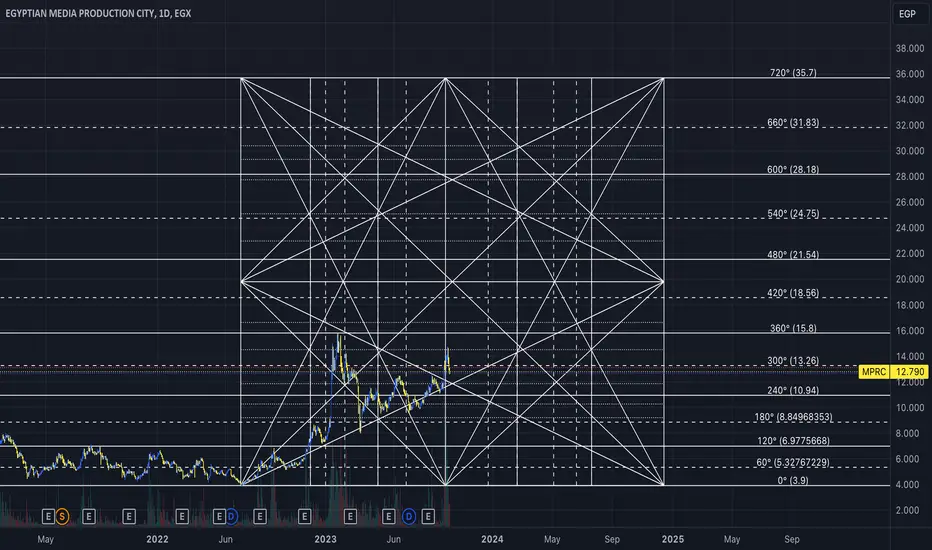
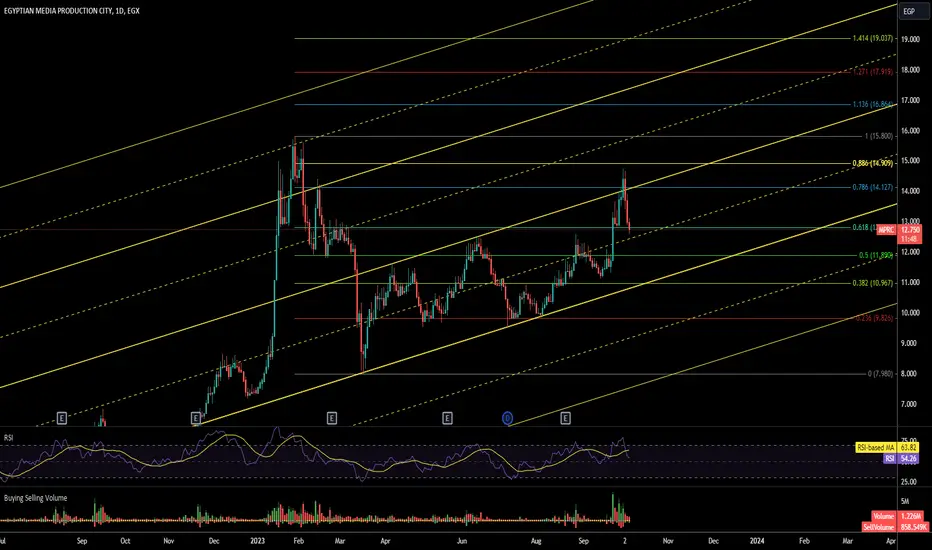
MprcTarget 15.79
Support 12.75
Stop Below 12.5
On Chart Fib Levels
12.75 is .618 FIB level,, Good Area to buy.
Top not Reached yet.. Possible Double top or more 15.799
Good Luck