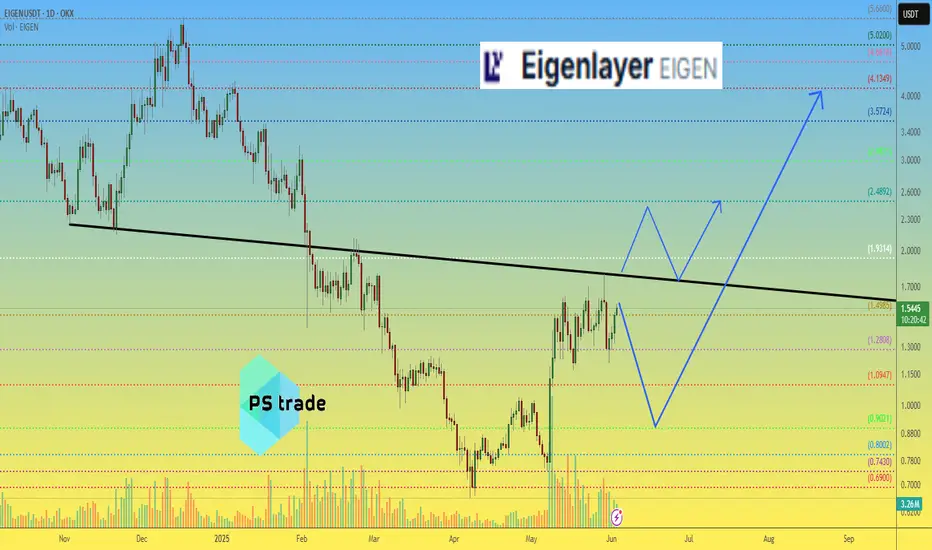
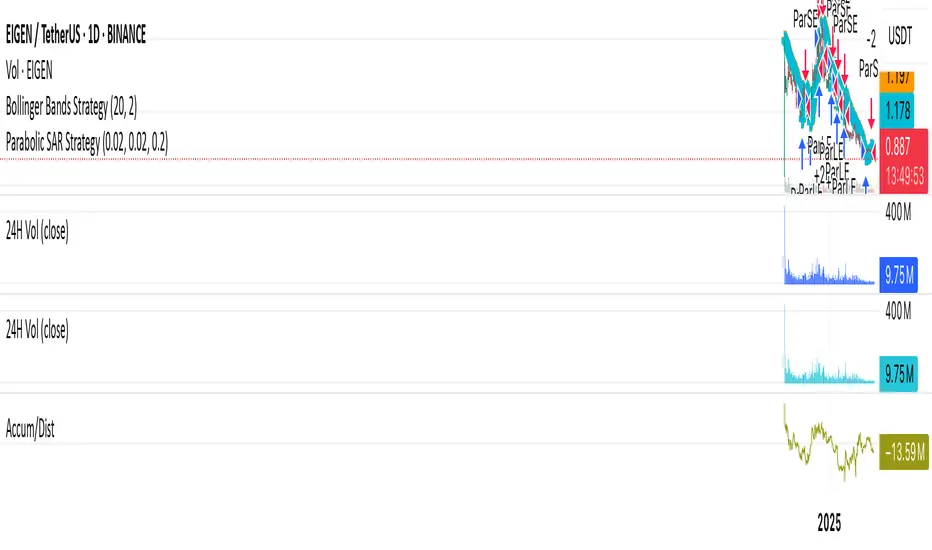
Eigenlayer EIGEN price analysisLooking at the OKX:EIGENUSDT chart, we can see that the growth amplitude is “choking” and trading volumes are decreasing.
Therefore, at the current price, we would not risk buying #EIGEN
But at $0.90, it's safer! Or at $1.80-1.90, but only after the price breaks through and consolidates above the
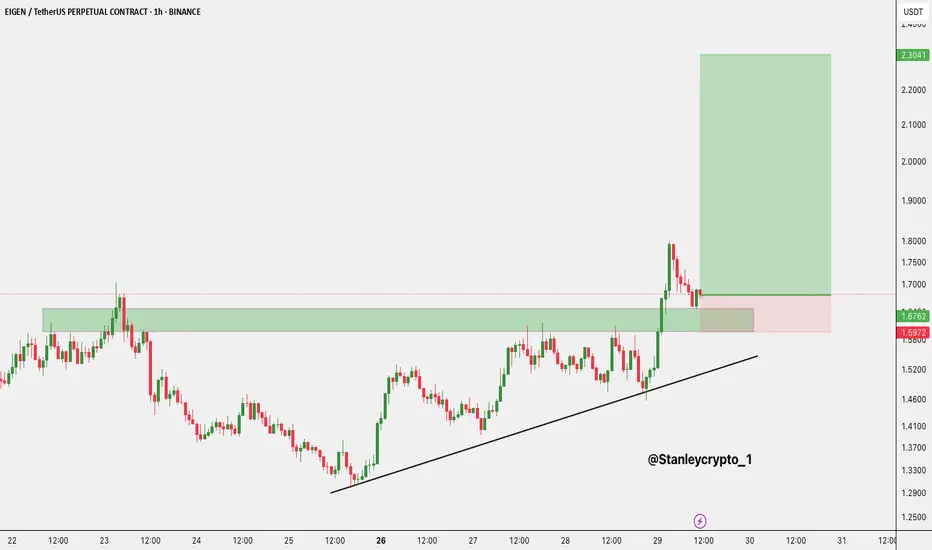
$EIGEN/USDT Trade SetupPrice broke above key resistance and is now retesting the zone.
- Entry: CMP
- Stop Loss: $1.5972
- Targets: $2.0211 / $2.2899
Holding the trendline demand flip strong bullish bias.
Breakout traders, keep it on your radar.
DYRO, NFA
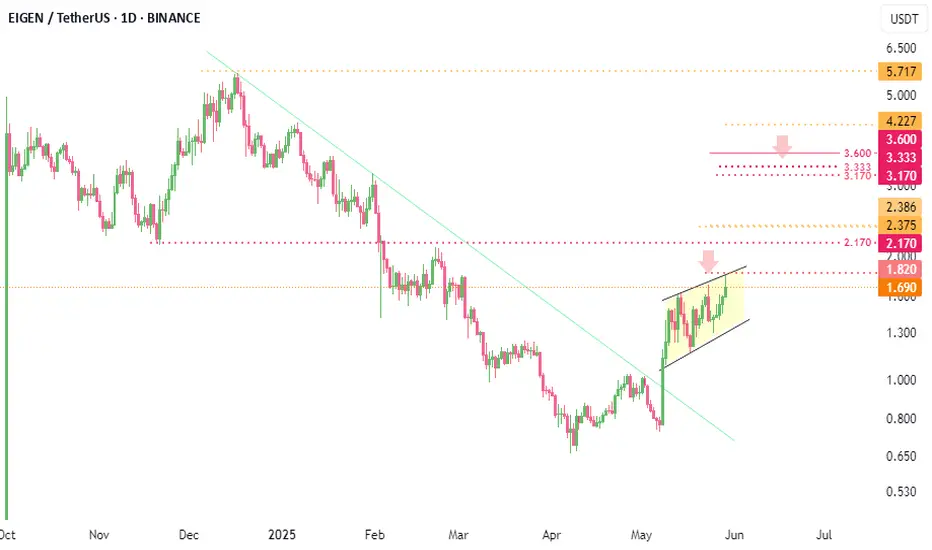
#EIGENUSDT ( flag )Maybe the yellow flag pattern could have been imagined for him.
We are monitoring the crossing above the yellow flag 👀
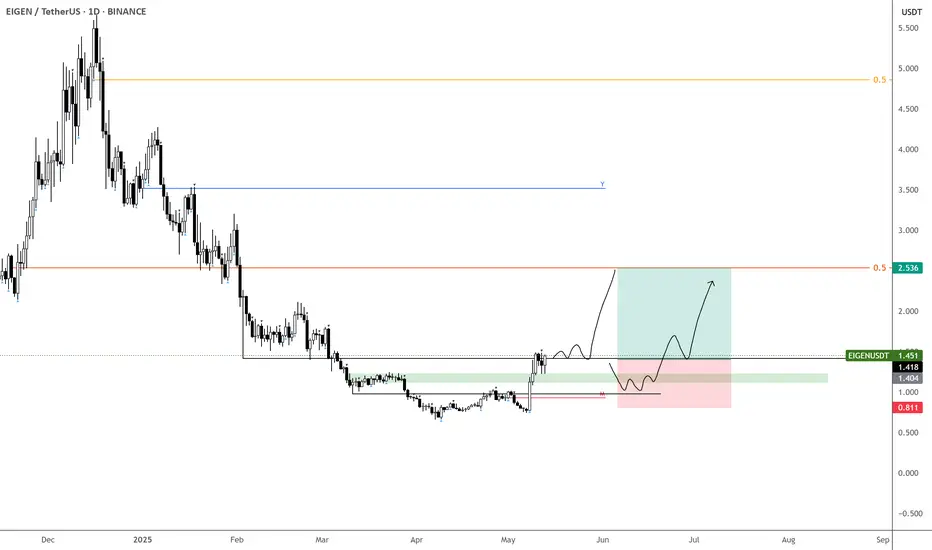
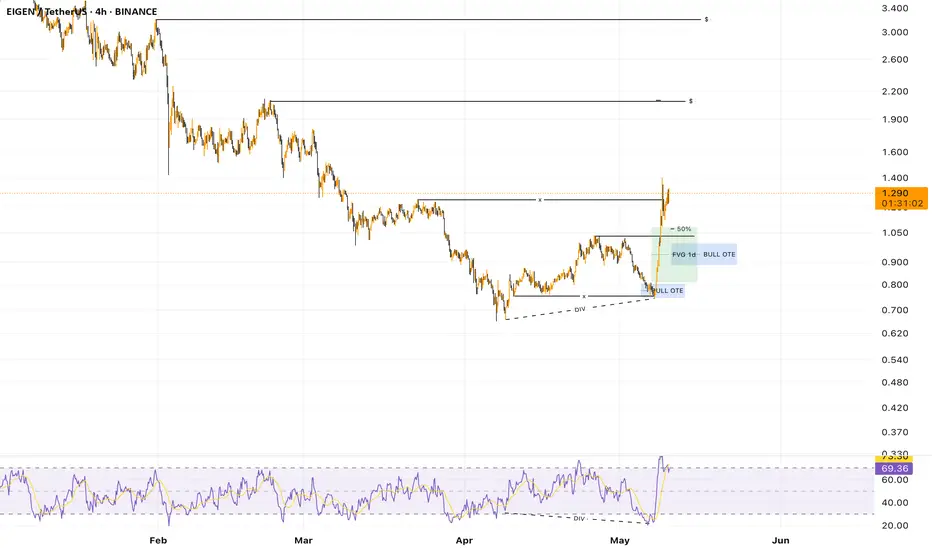
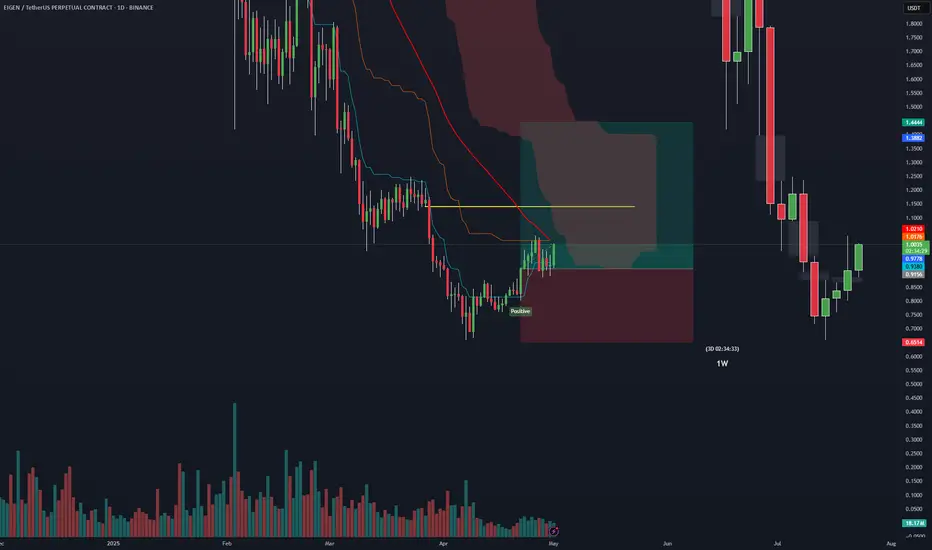
EIGEN – Chasing Strength Over PerfectionDoubt I’ll see BINANCE:EIGENUSDT back below $1—so here’s my take:
Risk/reward isn’t ideal at this level, but there’s a clear chance of continuation, and this isn’t one I want to miss.
Buying a small bag now, with plans to add in the green zone if it dips. While a revisit to the Monthly Open is u
EigenLayer (EIGEN) – Overview and Technical Analysis
🔎 What is EigenLayer ?
EigenLayer is a restaking protocol built on Ethereum that aims to enhance network security and scalability by allowing validators to reuse their staked ETH or other liquid staking tokens (LSTs) to secure additional decentralized applications (dApps) and services.
This innova
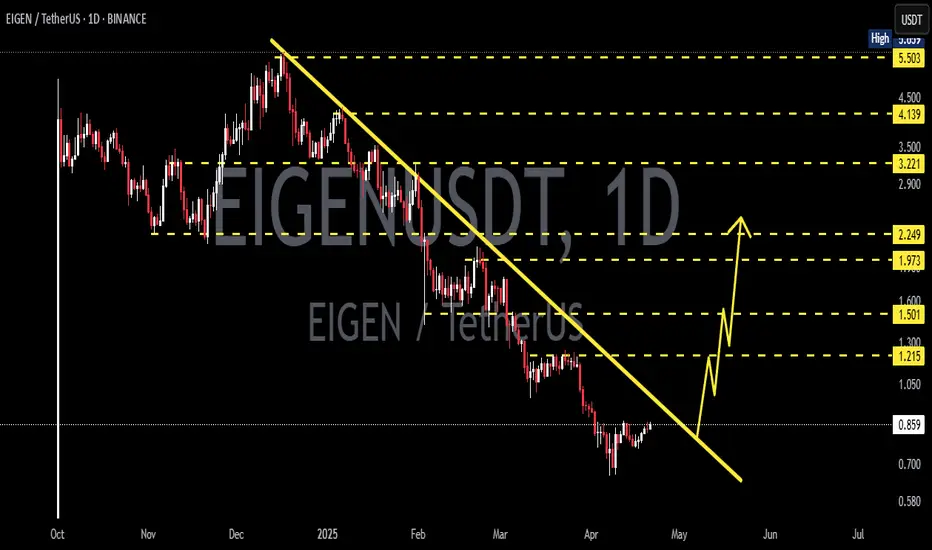
EigenLayer Easy Targets, Broken Downtrend —500%Now we are looking at EigenLayer, a new project.
Notice the very strong downtrend that started in mid-December 2024. It is hard to believe that it has been already more than five months.
Notice this huge downtrend and how EIGENUSDT broke out without breaking bullish. This is ok if you are looking
EIGENUSDTMy expectation is to powerfull explode to high. EIGEN is so strong and it target to min 1:2 risk ratio. lets wait and see
EIGENUSDT 1D AnalysisEIGEN ~ 1D Analysis
#EIGEN Buy after successfully penetrating this resistant line with a short -term target of at least 10%+.
their original 32$32.45M is worth only $10.03M (-69%)Remember that whale (or institution) who made a big move buying EIGEN last year? They’re not doing so well 😂
They started with 32.45MinUSDC,bought8.917MEIGEN at an average price of 3$3.64, and lost 17.19M.ThentheyswitchedpartoftheirpositiontoHYPE at the peak, only to lose another $5.21M. Now, after
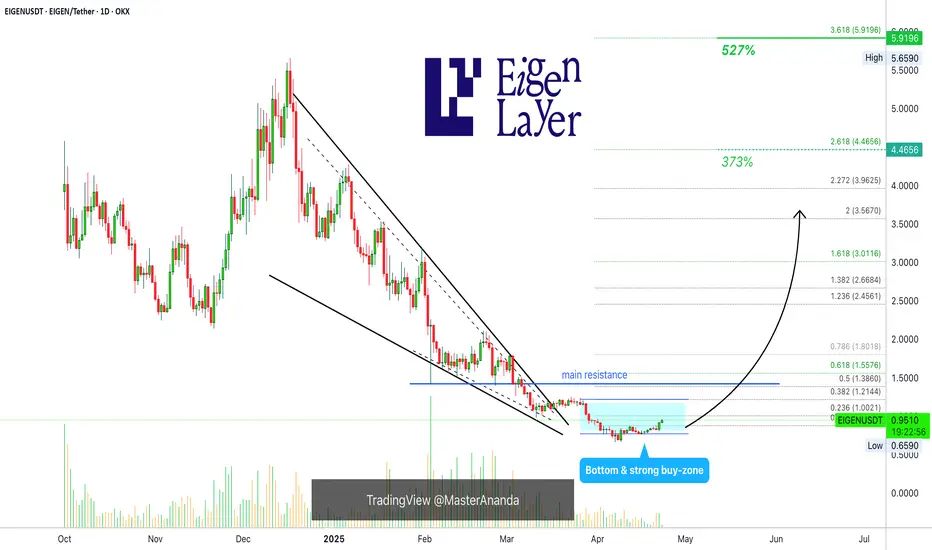
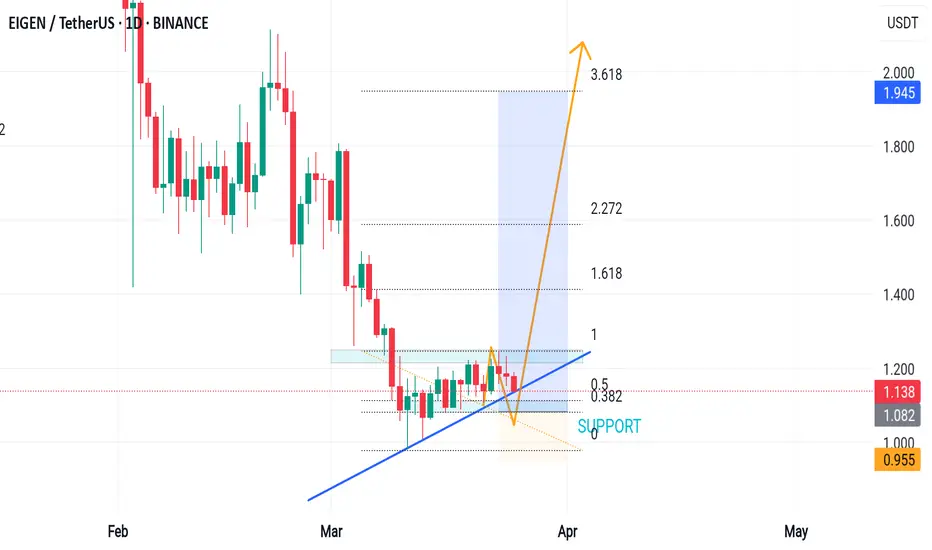
EIGEN/USDTEIGEN/USDT Analysis
Time frame (1D)
Buy Setup:
Entry Zone: $1.08 - $1.14 (strong support area & Fibonacci 0.382).
Target Levels:
TP1: $1.94 (Fibonacci 1.618).
TP2: $2.27 (Fibonacci 2.272).
TP3: $3.61 (Fibonacci 3.618).
Stop Loss: Below $0.95 (support breakdown).
Key Insights:
1. Price contin
See all ideas
Summarizing what the indicators are suggesting.
Oscillators
Neutral
SellBuy
Strong sellStrong buy
Strong sellSellNeutralBuyStrong buy
Oscillators
Neutral
SellBuy
Strong sellStrong buy
Strong sellSellNeutralBuyStrong buy
Summary
Neutral
SellBuy
Strong sellStrong buy
Strong sellSellNeutralBuyStrong buy
Summary
Neutral
SellBuy
Strong sellStrong buy
Strong sellSellNeutralBuyStrong buy
Summary
Neutral
SellBuy
Strong sellStrong buy
Strong sellSellNeutralBuyStrong buy
Moving Averages
Neutral
SellBuy
Strong sellStrong buy
Strong sellSellNeutralBuyStrong buy
Moving Averages
Neutral
SellBuy
Strong sellStrong buy
Strong sellSellNeutralBuyStrong buy
Displays a symbol's price movements over previous years to identify recurring trends.