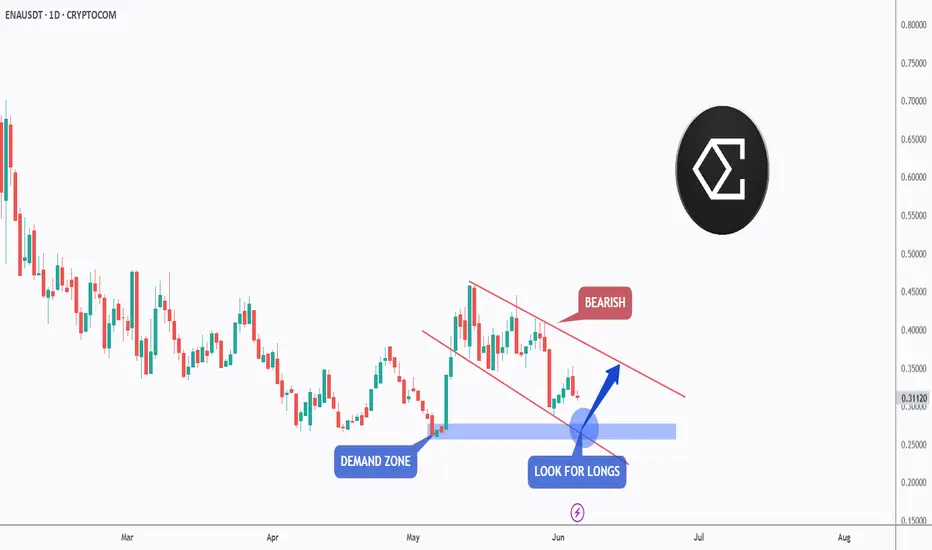
ENA NEXT MOVE ?ENA/USDT is at a critical point. It's either poised for a breakout above 0.3030-0.3050 resistance (bullish) or a breakdown below the ascending trendline support (bearish). Volume and confirmed candle closes are key for conviction.
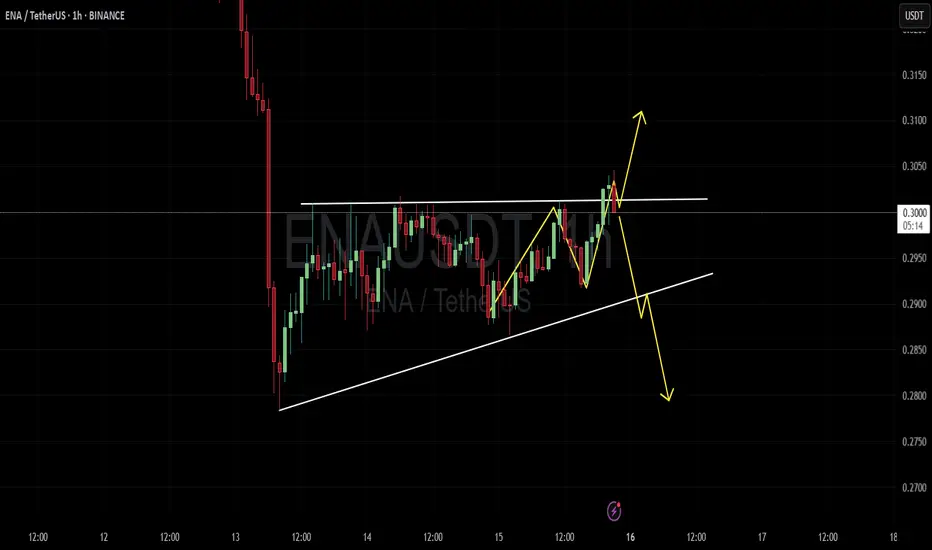
ENAUSDT Ascending Triangle Breakout – Long Setup in PlayThis chart displays a potential bullish breakout for ENAUSDT on a lower time frame, forming a classic ascending triangle pattern. The price has been making higher lows while repeatedly testing the horizontal resistance around $0.303, signaling increasing buying pressure.
A long position has been in

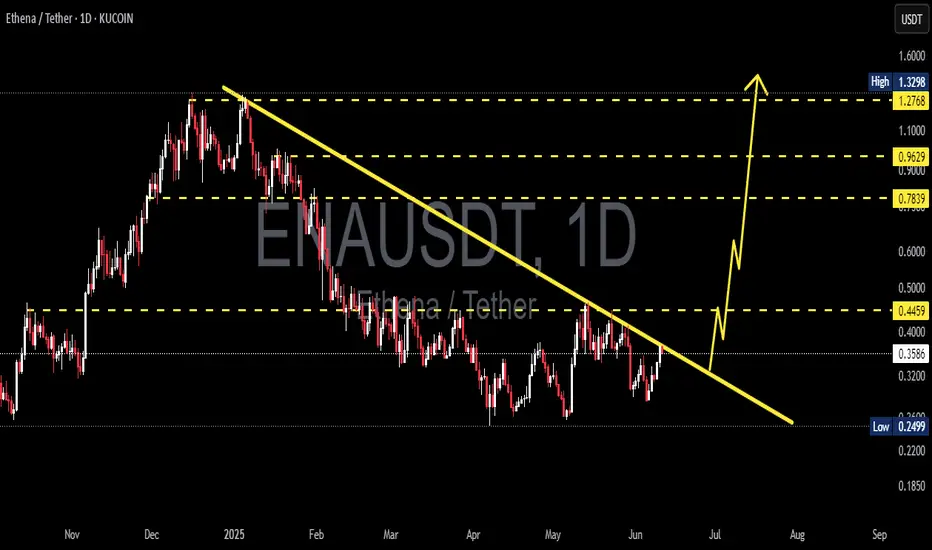
ENAUSDT 1D Analysis ENA ~ 1D Analysis
#ENA Buy after successfully breaking this resistance line with a short term target of at least 15%+, Long term target $1.3
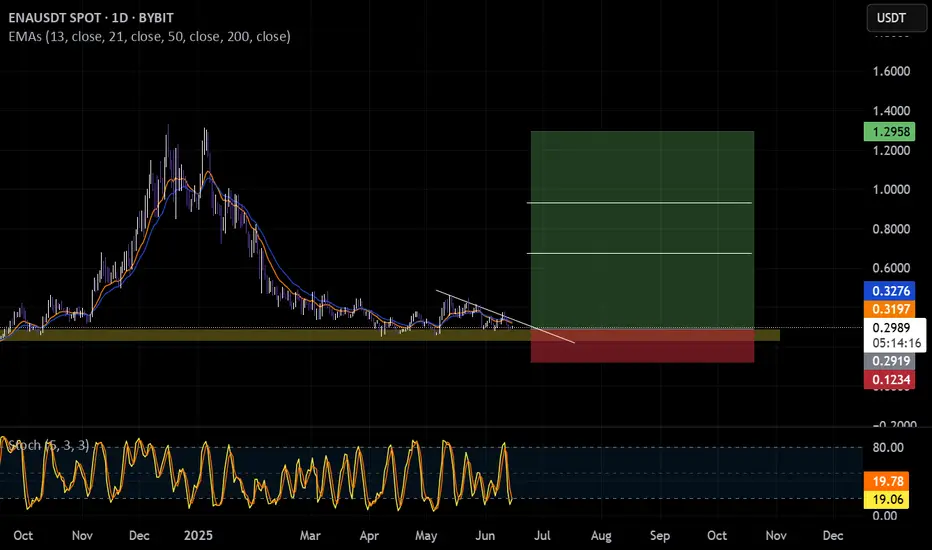
ENAPossible swing play
- in a consolidation range not a bad area to bid.
- new coin with good fundamental.
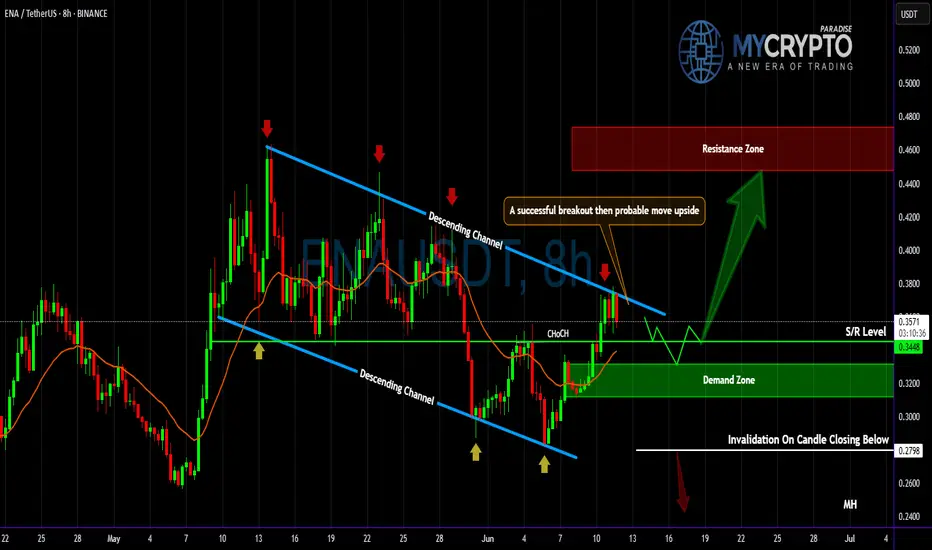
ENA About to Explode or Dump? Key Levels You Can’t Ignore!Yello Paradisers — are you positioned right for the next potential explosion in #ENA, or will you get caught on the wrong side of the move like most retail traders? After a brutal grind in a descending channel, something big is brewing... and it’s coming faster than many realize. Let's dive in.
💎#E
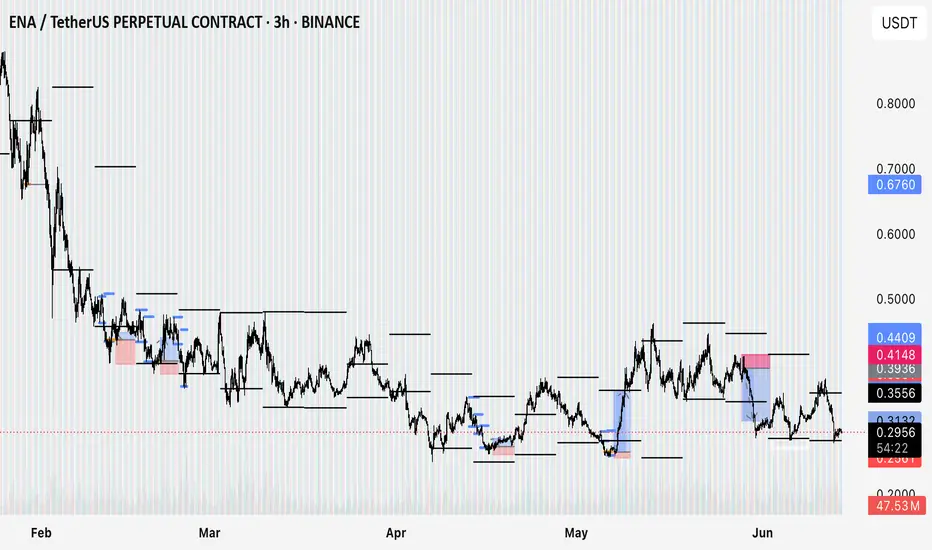
The high low weekly trading system performanceJust testing system to see that I actually have en edge
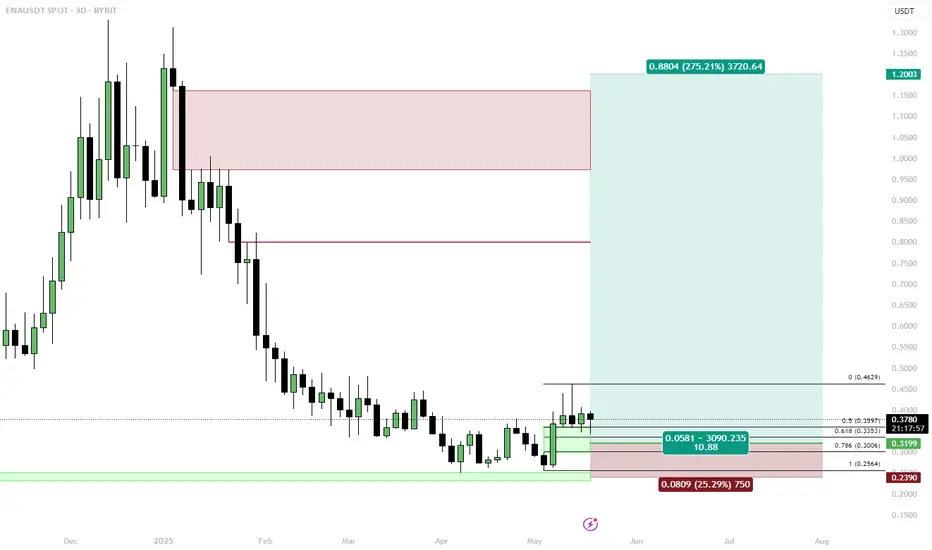
ENA 3D LONG SETUPMIL:ENA is holding tight above the 3D demand cluster at $0.3199–$0.3397 (61.8–78.6% Fib). With equal lows just below, we could see a stop-run before a real reversal.
1. Context & Structure
• Key support defended at $0.3199–$0.3397
• Demand zone aligns with Fib levels (0.618–0.786)
• Series of equa
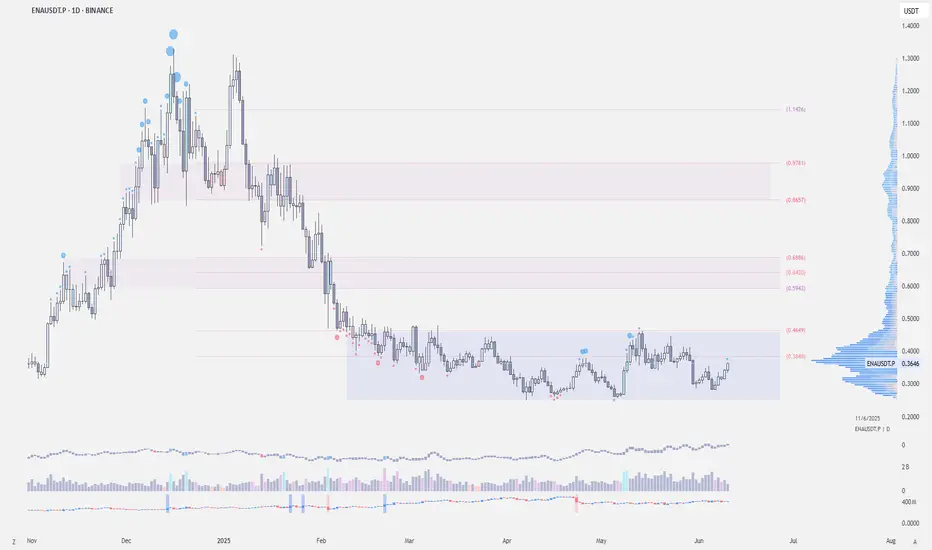
$ENA - Long Trade IdeaBINANCE:ENAUSDT | 1D
Scaling into long here at cmp, dca .32-.30
Stoploss just below the low .25
TPs:
.54-60
.64-.70
.80-.86
ENA - Already Over-Sold!Hello TradingView Family / Fellow Traders. This is Richard, also known as theSignalyst.
📈ENA has been overall bearish trading within the falling channel marked in red and it is currently retesting the lower bound of the channel.
Moreover, the blue zone is a strong demand.
🏹 Thus, the highlighte
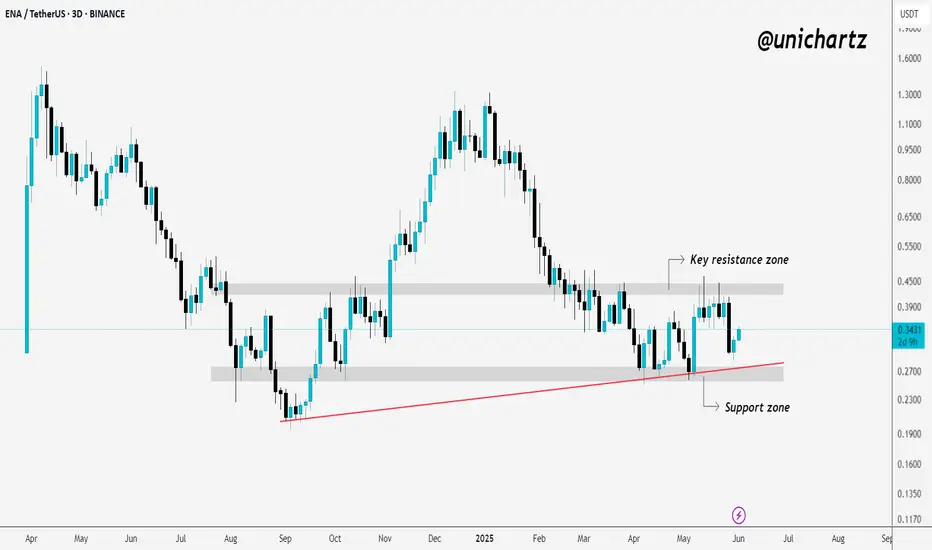
ENA Coiling Up — Parabolic Rally or Pullback Ahead?$ENA/USDT Analysis:
Price is currently moving sideways, stuck between a clear support and resistance zone.
It’s been bouncing off the lower support zone and consistently facing rejection from the upper resistance zone.
A breakout above the resistance could trigger a strong upward move — possibly
See all ideas
Summarizing what the indicators are suggesting.
Oscillators
Neutral
SellBuy
Strong sellStrong buy
Strong sellSellNeutralBuyStrong buy
Oscillators
Neutral
SellBuy
Strong sellStrong buy
Strong sellSellNeutralBuyStrong buy
Summary
Neutral
SellBuy
Strong sellStrong buy
Strong sellSellNeutralBuyStrong buy
Summary
Neutral
SellBuy
Strong sellStrong buy
Strong sellSellNeutralBuyStrong buy
Summary
Neutral
SellBuy
Strong sellStrong buy
Strong sellSellNeutralBuyStrong buy
Moving Averages
Neutral
SellBuy
Strong sellStrong buy
Strong sellSellNeutralBuyStrong buy
Moving Averages
Neutral
SellBuy
Strong sellStrong buy
Strong sellSellNeutralBuyStrong buy
Displays a symbol's price movements over previous years to identify recurring trends.