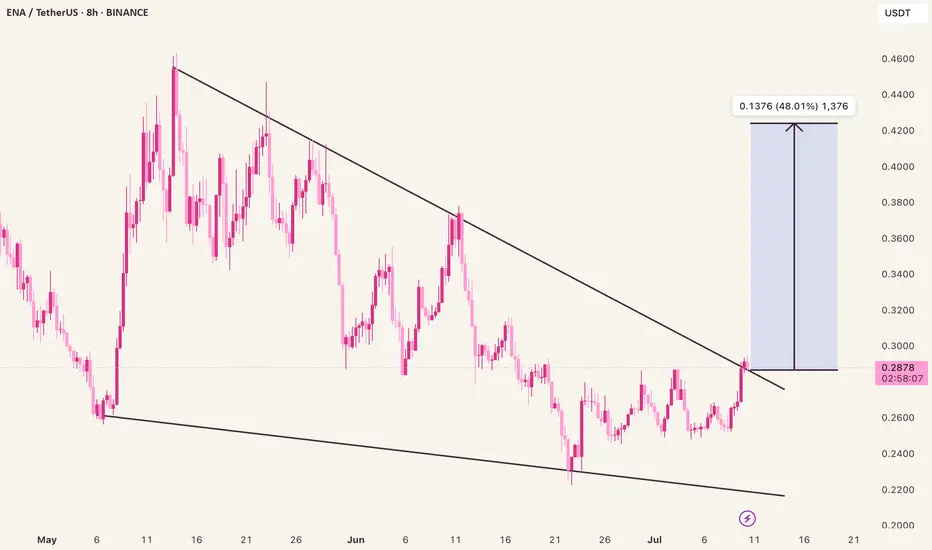
ENA/USDT – Compression Break Imminent?Market forming a clean falling wedge, typically bullish.
We’re at the upper boundary now, looking for a clean breakout and retest.
Volume rising could confirm the move.
Watch levels:
Breakout trigger: 0.32
Target: 0.42
Invalid if it dumps below 0.27
Want more of these setups? Hit follow & I’ll keep them coming.
ENAUSDT trade ideas
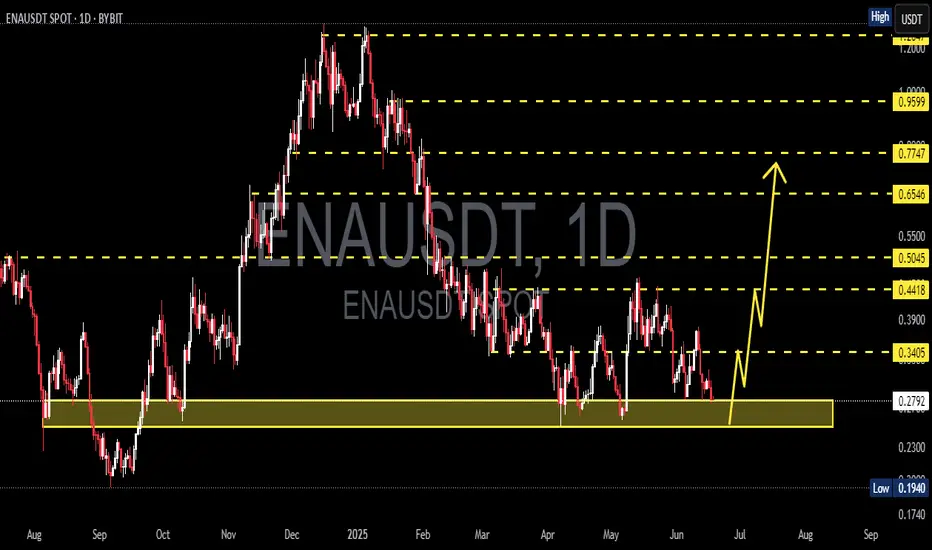
ENA/USDT Breakout Watch Signs of Reversal from a Key Demand Zone🔍 Full Technical Analysis:
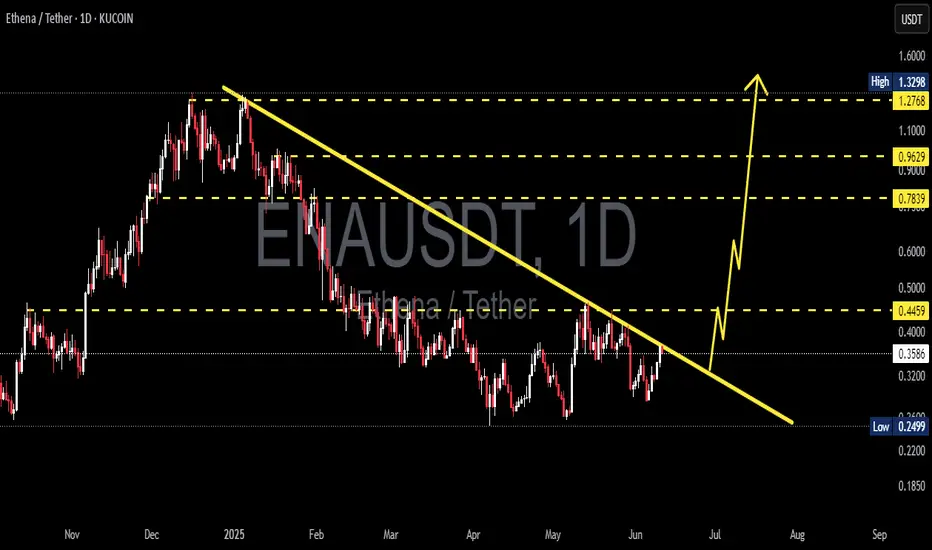
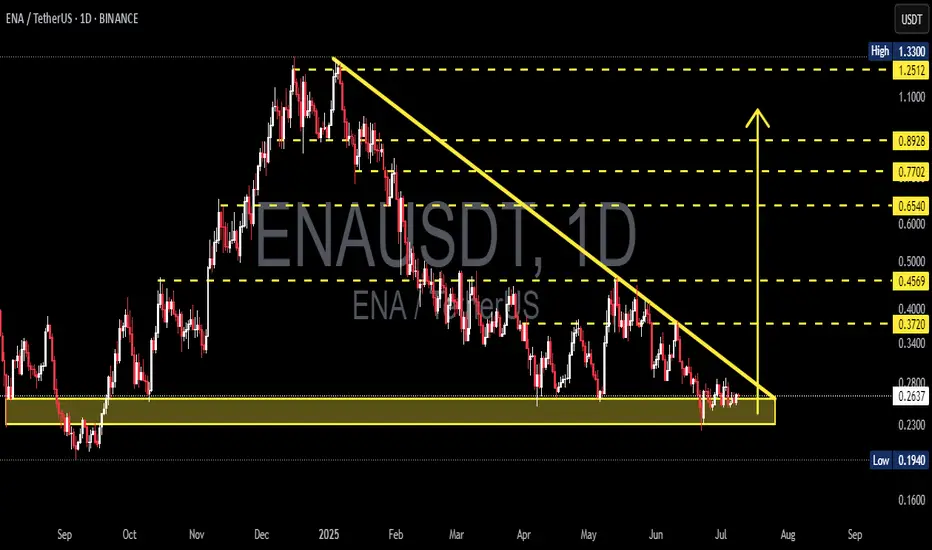
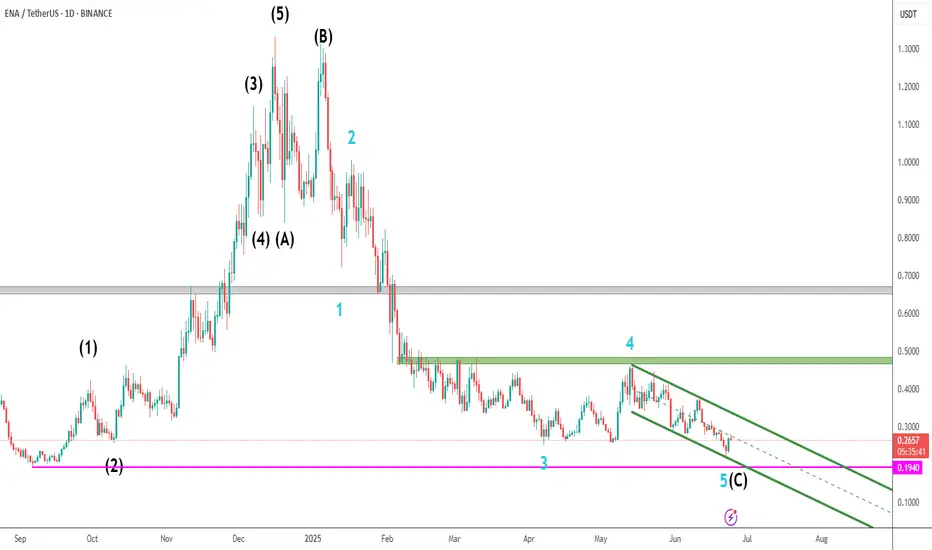
ENA/USDT has been forming a Descending Triangle pattern since the December 2024 high — a structure often seen in continuation moves, but here it may act as a potential reversal pattern, especially since price is consolidating around a strong historical demand zone.
The price is hovering within a key support area between $0.1940–$0.2624, which has repeatedly held against bearish pressure. Recent candles are showing signs of accumulation, indicating possible base formation before a breakout.
✅ Bullish Scenario (Breakout Setup):
If the price successfully:
1. Breaks above the descending trendline (yellow line), and
2. Confirms with a breakout above the $0.28–$0.30 zone with strong volume,
We could see a powerful bullish reversal with the following upside targets:
📈 Target 1: $0.3720
📈 Target 2: $0.4569 – breakout structure confirmation
📈 Target 3: $0.6540 – prior resistance zone
📈 Target 4: $0.7702
📈 Target 5: $0.8928
💥 Extended Targets: $1.2512 – $1.3300 (Major High from December 2024)
🚨 A clean breakout from this setup may trigger major FOMO and offer multi-level swing trading opportunities.
❌ Bearish Scenario (Breakdown Risk):
If the downtrend continues and:
The price fails to break above the trendline, and
Breaks below $0.1940, which is the historical low support,
Then the door opens for further downside towards: 🔻 Bearish Target: $0.1600 or lower
⚠️ A confirmed breakdown below this key zone would suggest trend continuation and weakness in buyer interest.
🧠 Strategic Summary:
Strong Demand Zone + Historical Support suggest high probability of trend reversal.
Descending Triangle offers a textbook breakout opportunity with favorable risk-reward.
High RR potential makes this setup ideal for swing traders and mid-term investors.
💡 Success tip: Wait for breakout confirmation and volume spike before entering.
#ENAUSDT #CryptoBreakout #DescendingTriangle #BullishReversal #AltcoinSetup #CryptoTrading #SwingTrade #TechnicalAnalysis #ChartPatterns #SupportAndResistance
Buy Trade Strategy for ENA: Backing the Ethena Protocol VisionDescription:
This trading idea is based on ENA, the native token of the Ethena Protocol, a rising star in the decentralized finance (DeFi) space aiming to build a crypto-native, yield-bearing stablecoin alternative called USDe. ENA plays a critical role in governance, staking, and incentivizing ecosystem participants. Ethena’s innovative architecture, which combines delta-neutral strategies with Ethereum-based infrastructure, has drawn significant interest from both institutional and retail users. With growing adoption, strong investor backing, and real-world use cases, ENA is positioned as a key asset for those looking to gain exposure to next-generation DeFi protocols focused on scalability and stability.
That said, the crypto market is known for its volatility. Factors such as regulatory uncertainty, market sentiment, and ecosystem risks can dramatically influence price action. Investors should consider these dynamics when planning their trades and ensure proper risk management is in place.
Disclaimer:
This trading idea is for educational purposes only and does not constitute financial advice. Trading cryptocurrencies, including ENA, involves substantial risk and can result in the loss of your entire investment. Always perform thorough research, assess your personal financial situation, and consult with a qualified financial advisor before making any investment decisions. Past performance is not indicative of future results.
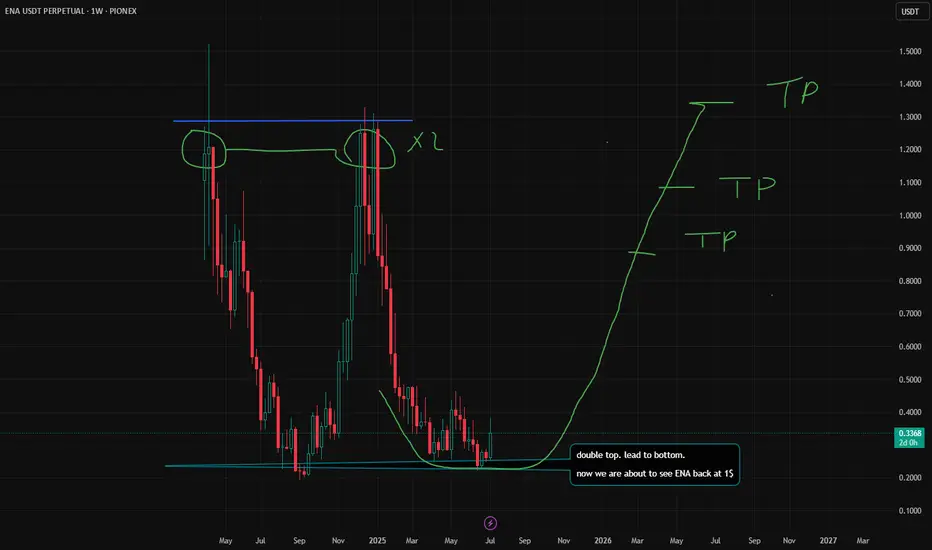
ENA / USDT LONGSafe liquidation prices. and long to the 1 dollar range yet again for ENA. BITCOIN looks strong. the rsi and macd look healthy and the global m2 chart is realistically following the same pursuit and has not pulled back yet!
we are looking at a very nice alt season to come. DONT let anyone fool you. this is the bullrun incoming and BTC is not done yet.
follow me for more alpha; for the future. and dont forget to leave a ROCKET
$ena A Pattern - UP? ENA
Potentially forming an accumulation phrase.
Wait for a breakout with volume.
SPOT first.
ENA : The largest token release...Hello dears
Given the long-term price decline that we have witnessed, it has now been announced that this currency is going to do a token release, which will naturally cause the price to fall, so be careful.
In case of a fall, we have identified important supports for you so that you can buy with risk and capital management.
The target has also been identified.
*Trade safely with us*
Trading plan for ENAThis week, price has been attempting to break through the pivot point but has faced consistent rejection. We may see a retest of the local high, and if price reverses back below the pivot, the next target would be the support zone
Trade safe and stay adaptive!
ENAUSDT Long / Buy SetupOn lower tf ena showing bullish momentum, while previous setups went bad due to war, but ena still holding the previous marked area, this is a short term setup not long term, still expecting another low for whole market. Will share swing setups if found strong momentum. Must use SL as btc as it's peak.
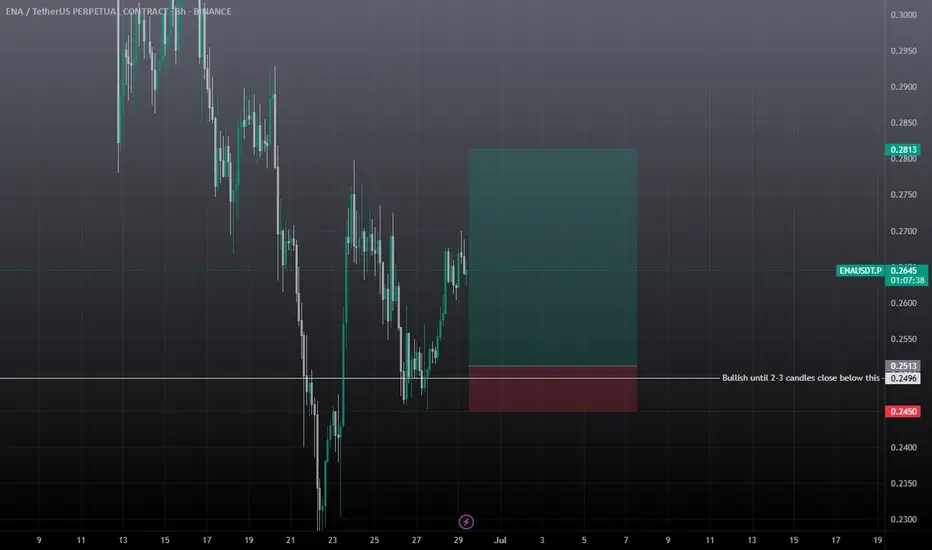
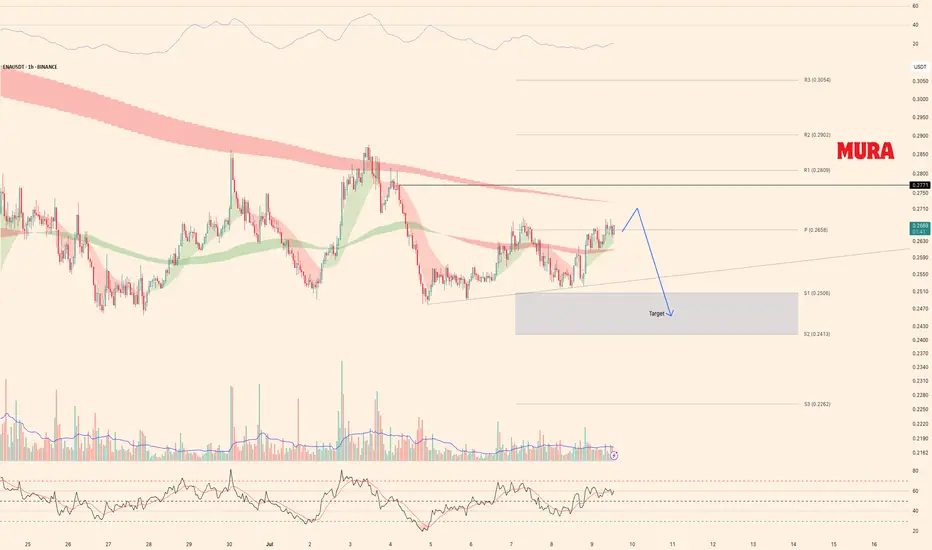
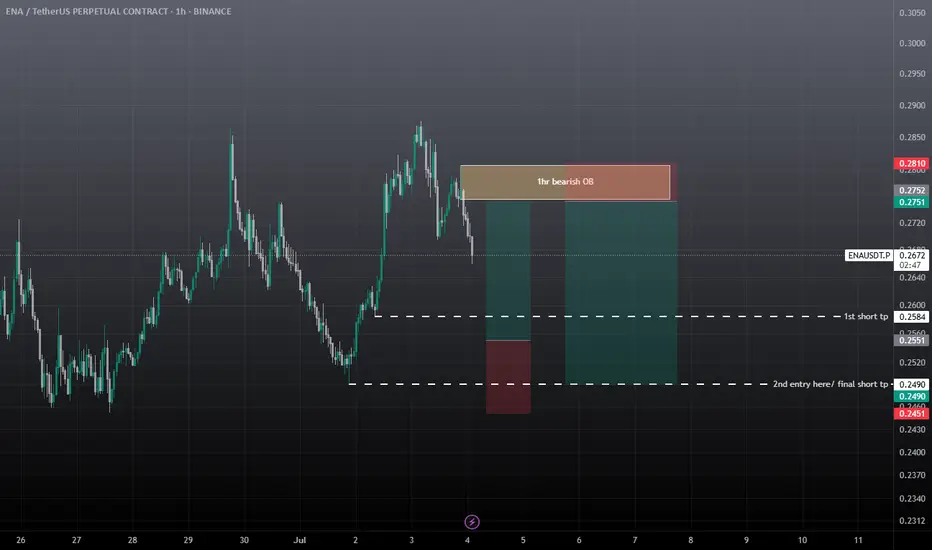
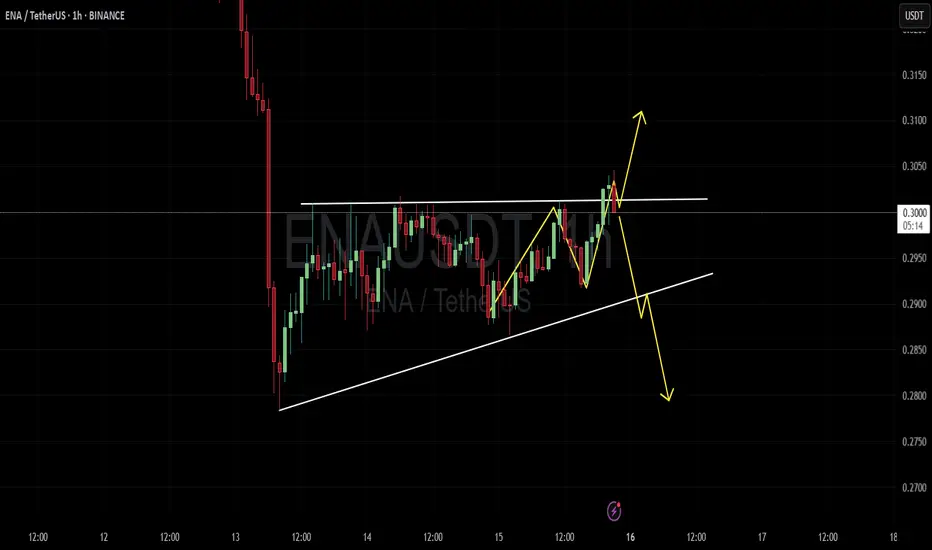
ENAUSDTENA/USDT – 1H Analysis (July 7, 2025)
Structure:
Price formed a rising wedge, already broke down.
Currently retesting 0.2630–0.2640 zone.
Scenarios:
Bearish: If rejected, target is 0.2540–0.2555.
Bullish: If price reclaims 0.2650, may go to 0.2700.
Indicator:
Stochastic is falling, confirming bearish pressure.
Ena to 0.4$?I like it and i like it from here.
Looks like 7th july will be gud
Looks gud and bullish.
Send it .
NFA
WIF/USDT NeoWave Analysis (Daily, Range-Based Chart)
🔍 WIF/USDT NeoWave Analysis (Daily, Range-Based Chart)
Based on a range-based (constant range bar) chart, this analysis follows Glenn Neely’s NeoWave principles for identifying complex corrective and impulsive structures:
🌀 Wave Count Summary:
1. Initial Impulsive Wave (Wave A?)
Strong bullish movement with high volume around March–May.
Likely the start of a terminal pattern (e.g., Leading Diagonal or Expanding Triangle).
2. Prolonged Correction (Wave B?)
Large, noisy sideways correction through the summer.
Structure appears to be a complex correction (possibly WXY or WXYXZ).
3. Second Sharp Rally (Wave C or E?)
Intense bullish move in November, but quickly reversed.
Could be Wave C of a Flat or Wave E of an Expanding Triangle.
4. Final Drop (Wave C of Higher Degree)
Strong decline into February 2025, likely completing the entire corrective pattern.
Appears impulsive, suggesting a terminal wave.
5. Current Phase – Base Building
Price consolidating near historical support (~$0.65–$0.85).
Potential beginning of a new bullish cycle (Wave 1 or A forming).
📌 Key Levels:
Support Zone: $0.50–$0.65
Resistance Zone: $1.10–$1.30
Breakout above resistance with strong volume may confirm the start of a major bullish wave (Wave 3 or C).
📈 Bias: Accumulation and base-building phase with bullish breakout potential if resistance
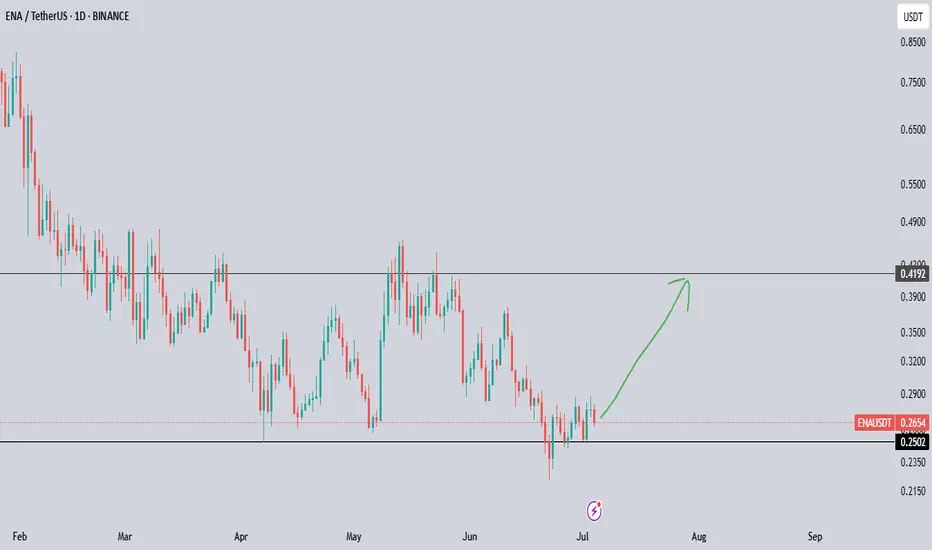
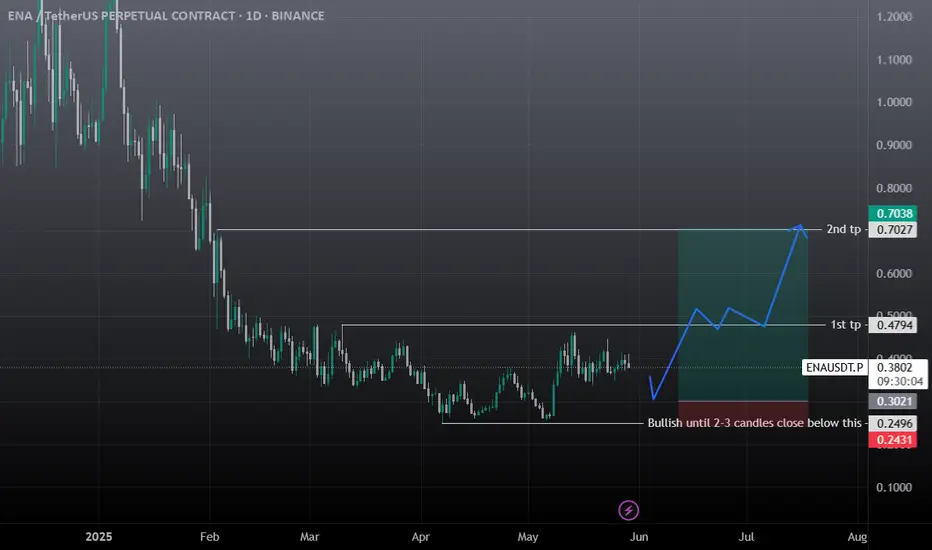
ENA Long / Buy Swing SetupENA Looking Good here, daily closing above 1st tp guaranteed tp 2. Ena can be the next SUI, Ondo. Below 0.31$ buying is a good choice and hold till 1st and then 2nd tp. While for the long term investors it has the potential to hit 2-3$ mark.
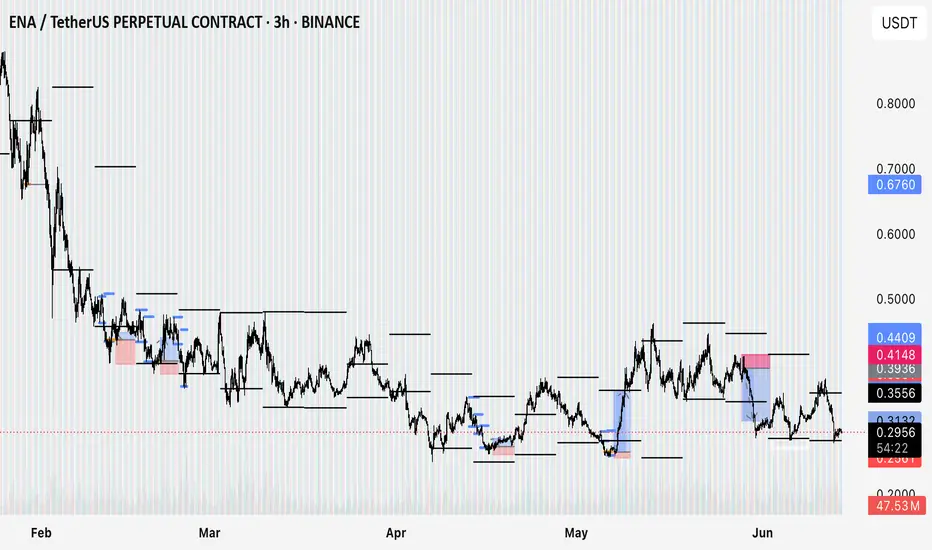
ENA SCALP & Intraday Setup Both Long & Short SetupWait for the entries to be filled first. If short entry achieved first then go for the short, if long entry achieved first then go for the long, in both cases must use SL, cause it's consolidating in a range, any side impulse move is expected from ena.
ENA Downtrend WeakeningWe are getting close to the invalidation level (all time low), but the downtrend is losing strength.
First bullish signal would be a break of the green descending channel.
Or, if you´re into YOLOing, begin building a position from current levels (high risk, since we don't have any bullish price action yet).
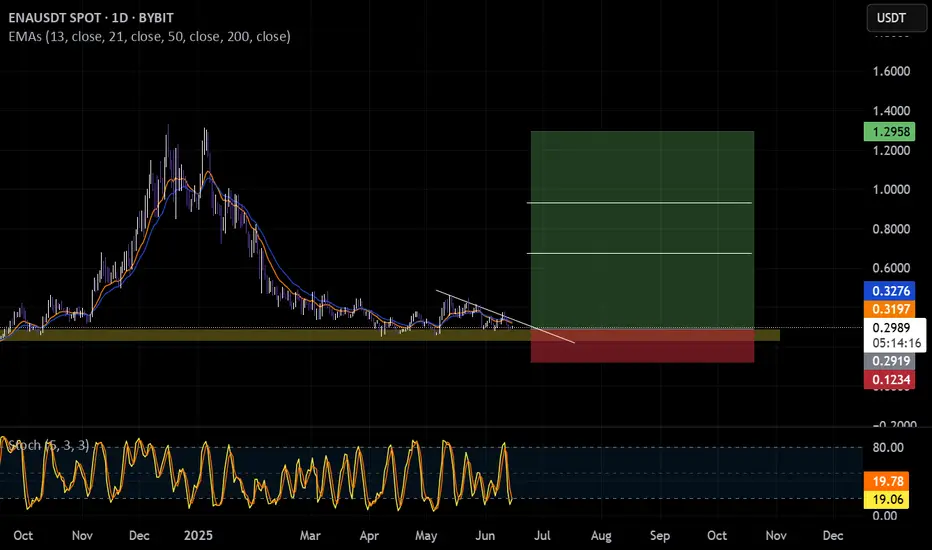
ENA At Make-or-Break Demand — Long-Term Thesis on the Line🎯 BINANCE:ENAUSDT Trading Plan:
Scenario 1 (Reversal from Demand):
Watch for strong reaction in demand zone ($0.24–$0.20)
Long-term entries on confirmation (H4/D1 SFP or reclaim above demand)
Scenario 2 (Breakdown):
No trade if $0.20 breaks with high volume/no bounce
Next demand much lower, patience required
🔔 Triggers & Confirmations:
Wait for clear reversal signal in HTF demand before entries
No knife catching if breakdown occurs
📝 Order Placement & Management:
🟩 Watch Zone: $0.24–$0.20 (set alert)
🛡️ Stop: Below $0.20 (on breakdown confirmation)
🚨 Risk Warning:
This is the last major demand before price discovery lower
Only enter if there’s clear strength or volume spike on reclaim

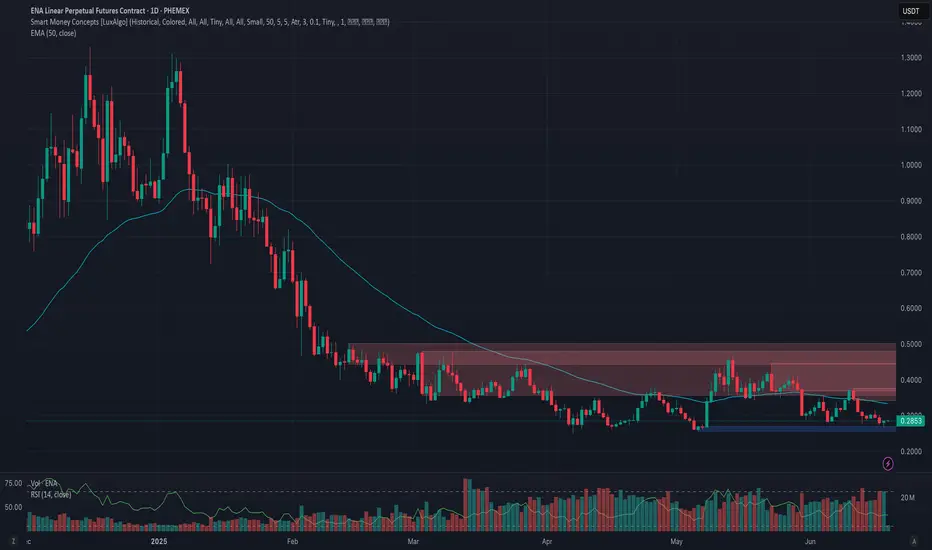
Phemex Analysis #91: Pro Tips for Trading Ethena (ENA)Launched in 2024, Ethena ( PHEMEX:ENAUSDT.P ) has swiftly risen as a powerful innovator in decentralized finance (DeFi). Its flagship synthetic dollar stablecoin, USDe, has achieved remarkable growth—ballooning from a mere $100 million supply at the beginning of 2024 to an impressive $5.8 billion, securing the third position among stablecoins by market capitalization. Concurrently, the ENA token itself delivered an astounding 550% price surge over the last five months, placing Ethena firmly among the top 10 DeFi protocols by total value locked (TVL), currently at approximately $5.8 billion.
In December 2024, Ethena expanded its stablecoin offerings by launching USDtb, a stablecoin backed 1:1 by cash and cash equivalents, with a remarkable 90% of reserves held in BlackRock’s USD Institutional Digital Liquidity Fund via Securitize. Ethena’s innovative USDe and the newly introduced USDtb represent crypto-native alternatives to established stablecoins such as USDT and USDC, promising censorship resistance and enhanced on-chain transparency.
Given USDtb's institutional-grade backing and advanced risk mitigation, it stands to substantially impact the broader stablecoin ecosystem, particularly as traditional USD-backed stablecoins face heightened regulatory scrutiny.
With Ethena’s significant innovations and market momentum in mind, let's carefully examine several potential price scenarios traders should be prepared for.
Possible Scenarios
1. Breakout Rise (Bullish Scenario)
Technical analysis indicates that ENA has formed a notable "triple bottom" around the $0.25 area, suggesting robust buying interest at this support level. If this support further solidifies, ENA could soon experience a bullish breakout above the immediate resistance at $0.37.
However, traders should exercise patience as the $0.50 zone represents strong resistance. It is expected that ENA’s price may fluctuate considerably before breaking confidently above this key psychological level.
Pro Tips:
Entry Strategy: Look to enter positions upon a confirmed breakout above $0.37, ideally with increasing trading volume.
Risk Management: Place stop-losses slightly below recent lows around $0.24–$0.25 to safeguard against false breakouts or reversals.
Profit-Taking: Consider partial profit-taking as the price approaches the critical resistance zone near $0.50.
2. Bearish Drop (Caution Scenario)
In a bearish scenario, potentially driven by broader negative market sentiment, ENA’s price could experience renewed downward pressure. A decisive, high-volume breakdown below the crucial support at $0.25 would strongly signal this bearish trend continuation.
Pro Tips:
Short Opportunities: Advanced traders might explore short-selling opportunities if ENA convincingly breaks below the $0.25 support.
Risk Mitigation: Set tight stop-losses to manage exposure, particularly if trading in volatile conditions.
3. Accumulation Phase (Neutral Scenario)
If the key $0.25 support successfully withstands selling pressure, Ethena’s price may enter a period of consolidation, bouncing between $0.25 (support) and $0.37 (resistance). Such consolidation typically reflects market indecision and accumulation before a substantial directional move.
Pro Tips:
Range Trading: Consider employing strategies such as grid trading to benefit from regular price oscillations within this trading range.
Observation and Patience: Stay observant for changes in volume or price momentum, as these could signal an imminent breakout or breakdown.
Conclusion
Ethena (ENA) is positioned at an intriguing crossroads, supported by impressive fundamentals, innovations, and growing market influence. Traders should closely monitor the outlined technical scenarios—recognizing key support and resistance levels, employing disciplined risk management, and capitalizing strategically based on evolving market conditions. With careful planning and timely execution, traders can confidently navigate Ethena’s current volatility and capture potential upside opportunities.
🔥 Tips:
Armed Your Trading Arsenal with advanced tools like multiple watchlists, basket orders, and real-time strategy adjustments at Phemex. Our USDT-based scaled orders give you precise control over your risk, while iceberg orders provide stealthy execution.
Disclaimer: This is NOT financial or investment advice. Please conduct your own research (DYOR). Phemex is not responsible, directly or indirectly, for any damage or loss incurred or claimed to be caused by or in association with the use of or reliance on any content, goods, or services mentioned in this article.
ENAUSDT 1D Analysis ENA ~ 1D Analysis
#ENA Buy back gradually from here if you still have confidence in this coin with a short term target of at least 15%+ from here.
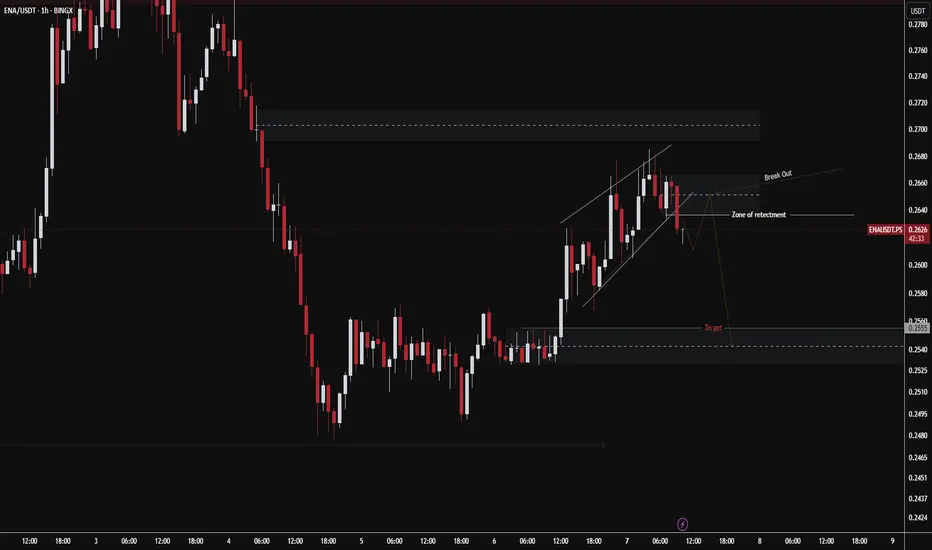
ENA NEXT MOVE ?ENA/USDT is at a critical point. It's either poised for a breakout above 0.3030-0.3050 resistance (bullish) or a breakdown below the ascending trendline support (bearish). Volume and confirmed candle closes are key for conviction.
ENAPossible swing play
- in a consolidation range not a bad area to bid.
- new coin with good fundamental.
ENAUSDT Ascending Triangle Breakout – Long Setup in PlayThis chart displays a potential bullish breakout for ENAUSDT on a lower time frame, forming a classic ascending triangle pattern. The price has been making higher lows while repeatedly testing the horizontal resistance around $0.303, signaling increasing buying pressure.
A long position has been initiated right at the breakout point, with:
Entry: Around $0.303
Stop Loss: Below the ascending trendline, around $0.290
Take Profit: Targeting above $0.34, offering a highly favorable risk-to-reward ratio.
This setup suggests a continuation of the bullish move if the breakout holds, especially if accompanied by increased volume.

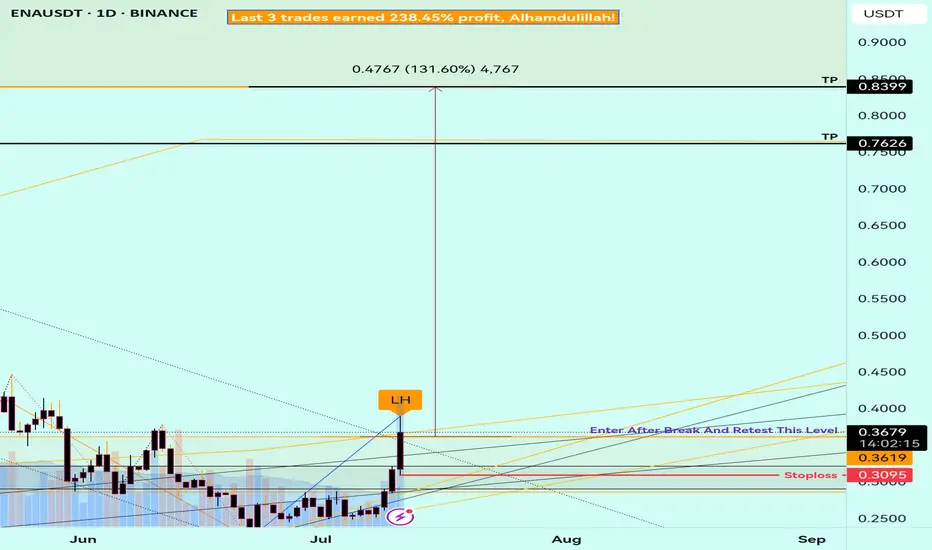
The high low weekly trading system performanceJust testing system to see that I actually have en edge
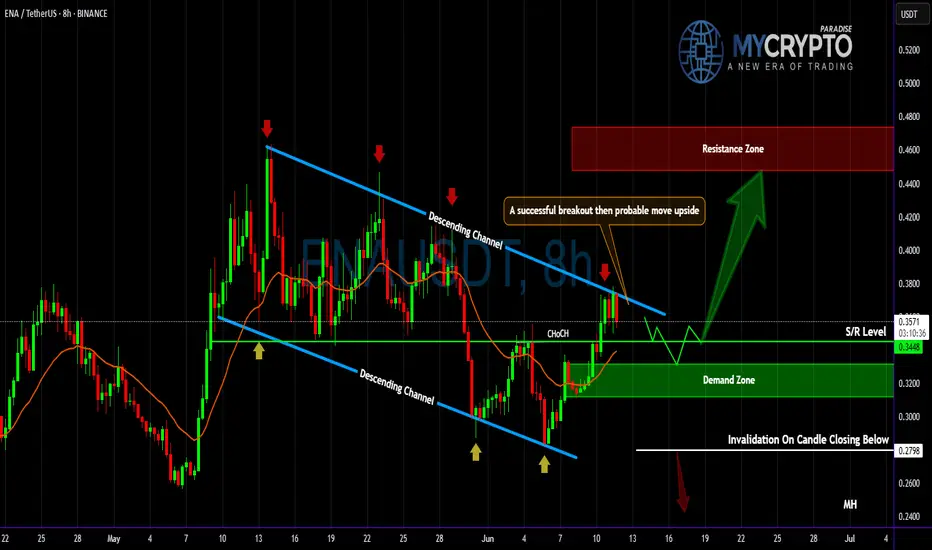
ENA About to Explode or Dump? Key Levels You Can’t Ignore!Yello Paradisers — are you positioned right for the next potential explosion in #ENA, or will you get caught on the wrong side of the move like most retail traders? After a brutal grind in a descending channel, something big is brewing... and it’s coming faster than many realize. Let's dive in.
💎#ENAUSDT currently facing a key resistance at the upper boundary of the descending channel, clearly tested multiple times and respected well by the market structure. A candle close above this channel would trigger a confirmed breakout, which opens up a clean path for continued upside movement — the next major target sits at the resistance zone between 0.446 and 0.4725.
💎There’s a high-probability alternative setup unfolding as well: ENA holding the S/R level around 0.3448 and the demand zone below, which aligns perfectly with the multi-timeframe EMA support. If this area holds strong, expect another impulse move toward our resistance zone as momentum builds.
💎Price had been forming lower highs and lower lows, respecting the downtrend But recently we observed a Clear Change of Character (ChoCH) — ENA broke market structure by forming a higher high.What usually follows? A higher low, and that’s where we are now.
💎The most probable scenario is for price to pull back to the S/R level or dip into the demand zone, and then form a higher low before making the next leg upward toward resistance.
💎Invalidation is simple and must be respected: if we see a confirmed candle close below 0.2798, then the bullish case breaks and the setup is no longer valid. This is where you must cut quickly, avoid hope-trading, and reassess the structure from scratch.
Don’t chase. Don’t panic. React with strategy, not emotion. This is how real professionals win in crypto. Stay sharp, Paradisers.
MyCryptoParadise
iFeel the success🌴
ENAUSDT 1D Analysis ENA ~ 1D Analysis
#ENA Buy after successfully breaking this resistance line with a short term target of at least 15%+, Long term target $1.3