ENA/USDT #ENA/USDT
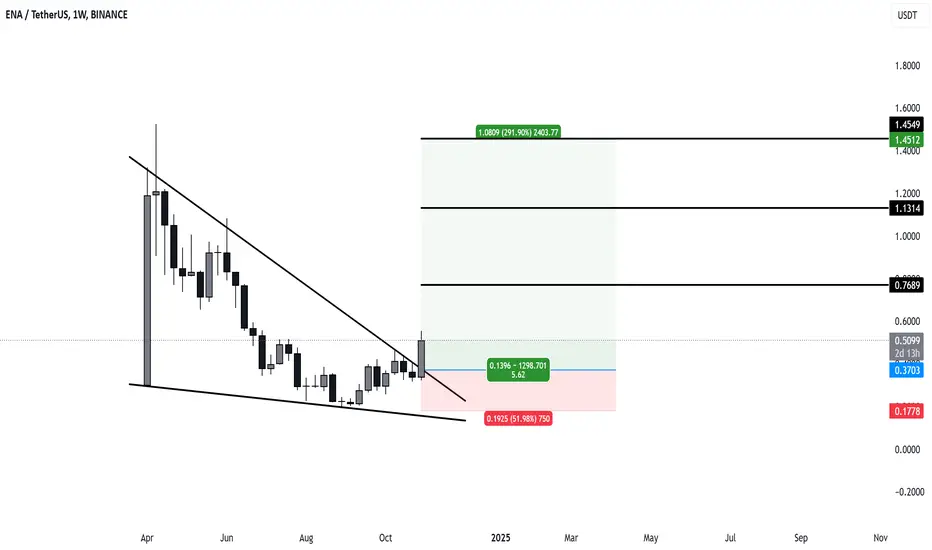
The $ENA/USDT pair shows the start of a bullish trend after breaking the downward resistance line. The level 0.5309$ represents a strong entry point in case of a support retest. The projected targets are:
Target 1 (T1): 0.8571$
Target 2 (T2): 1.0784$
Target 3 (T3): 1.5094$
If the support at 0.5309 is broken, the price may drop to lower levels. It's recommended to enter at 0.5309 with a stop-loss below this level and take profits gradually at the targets.
ENAUST trade ideas

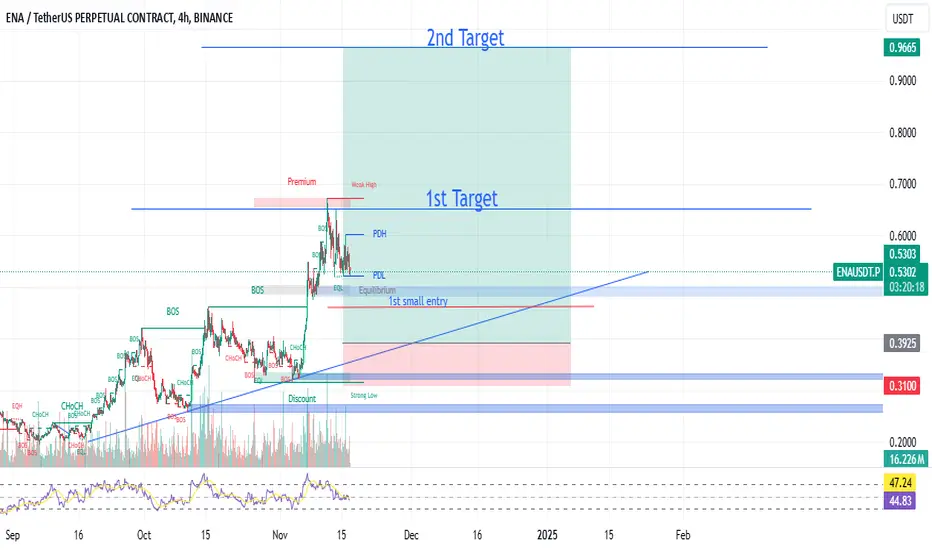
ENA to longENA can be longed from its retracement. its traveling in an upward channel.
1st small entry : 0.4625
2nd entry : 0.3925
1st tp: 0.65
2nd tp : 0.9665
Stop loss : 0.3100
ENA Long Sl -9.35%ENA Long Setup
Reason:
breakout from trendline
Fair Value gap Still not mitigated, waiting for liquidity to be grabbed.
Golden pocket will be the entry point.
Showing Bullish momentum in HTF
Waiting for LTF confirmation to enter.
Best Regards,
The Crypto Panda
BINANCE:ENAUSDT
BYBIT:ENAUSDT.P
MEXC:ENAUSDT
KUCOIN:ENAUSDT
URGENT: ENA Critical Support Zone Could Trigger Massive RallyConsidering that BTC might pull back slightly further to around $86k or $85k.
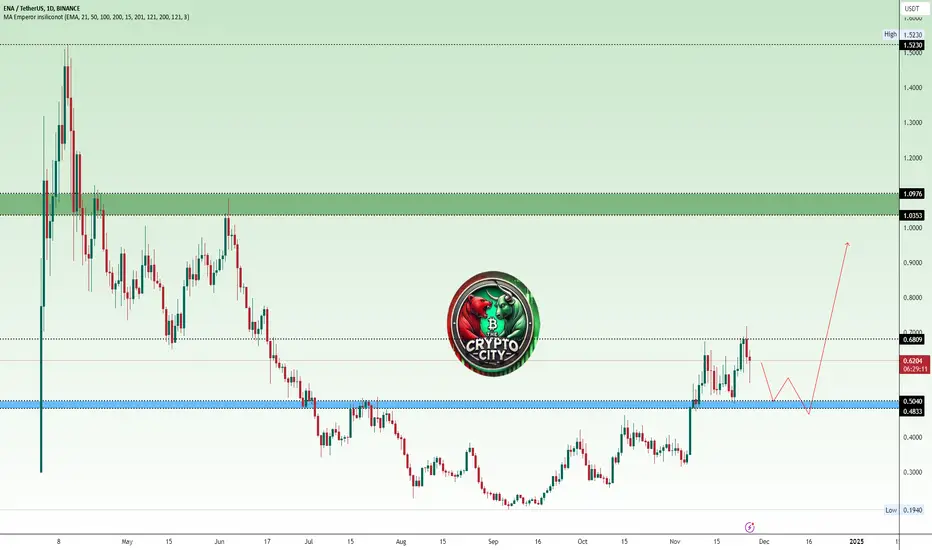
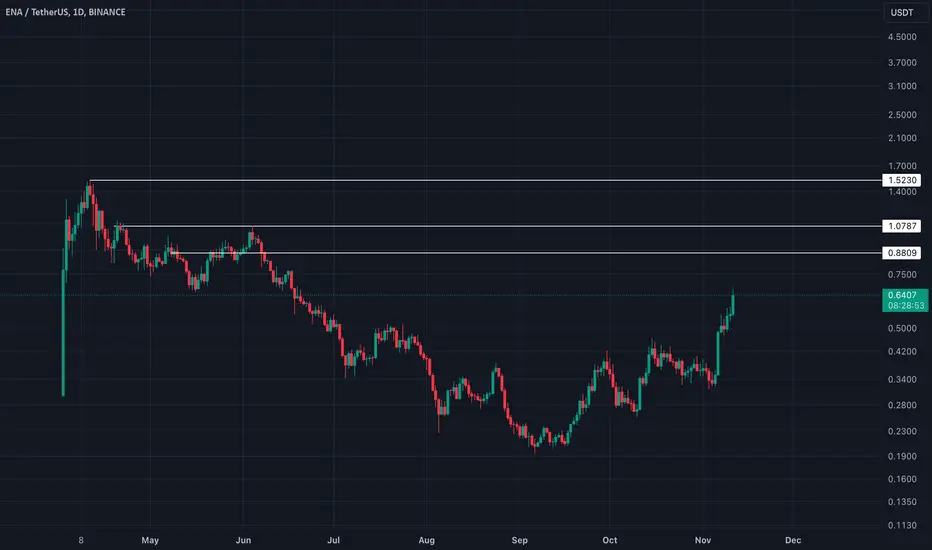
This chart showcases the price action of ENA against Tether (USDT) on a daily timeframe, highlighting crucial levels of support, resistance, and a speculative path for potential price movement. The blue zone, around $0.5040 to $0.4833, represents a significant support area where the price may find buyers if it retraces from its current level near $0.640. The chart also indicates a red projected path suggesting a pullback toward the blue zone before a potential bullish reversal and upward rally.
The upper resistance zones, at $0.6809 and $1.0353 to $1.0976, mark critical areas where sellers may attempt to stall the price momentum. A decisive break above these levels could open the doors for a rally toward the previous highs near $1.5230. The current setup suggests that traders are closely monitoring the blue support zone for signs of bullish strength, while the overall sentiment remains cautiously optimistic, contingent upon holding the key support and breaking the resistance zones.
Is #ENAUSDT Ready to Rally or Fall Further? Key Levels to Watch Yello, Paradisers! Is #ENAUSDT ready to make a massive bullish move and slide down further? Let's discuss #Ethena analysis and see what's happening:
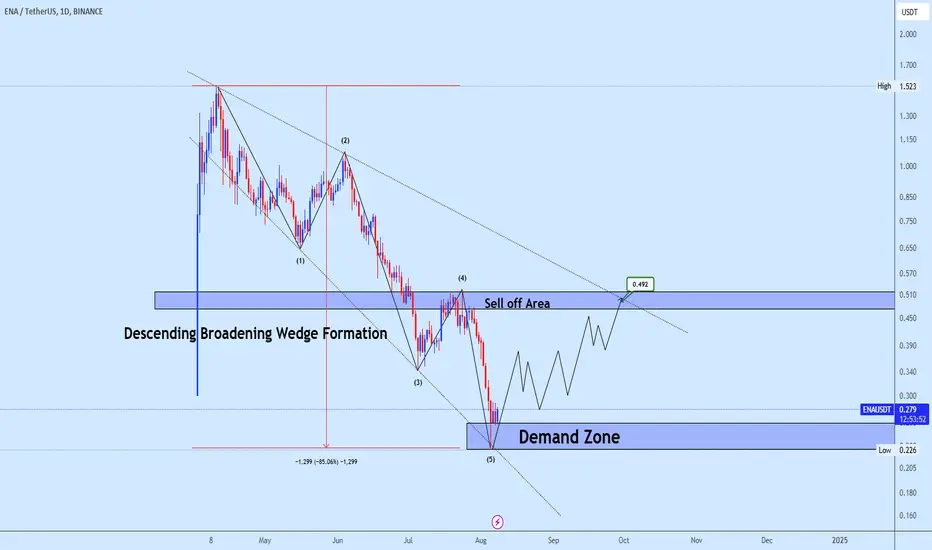
💎#ENA is showing promising signs of a bullish continuation and holding steady at the crucial support zone between $0.254 and $0.300. We've been closely watching its journey within a Descending Broadening Wedge pattern, and now, #Ethena looks poised to test the descending resistance line—a potential turning point.
💎Volume has remained robust, and with #ENA marking its all-time low just one month ago, we may be setting up for a strong rebound. As the saying goes, "Once we hit bottom, the only place to go is up," and this could be unfolding right now.
💎If #ENAUSDT can maintain strength at its current level, we could be on the verge of a significant rally. A breakout above the $0.470 minor resistance zone would open the path to higher targets and potentially even new highs.
💎However, if momentum weakens around this support zone, a pullback toward the lower demand area near $0.204 could be in store. A daily close below this demand zone would invalidate our bullish outlook and could signal more downside risk.
Stay vigilant, Paradisers, and closely monitor #ENA's price action.
MyCryptoParadise
iFeel the success🌴

$ENA - Local resistance that needs to flippedENA broke above the weekly consolidation, however, price has reached its higher timeframe supply zone.
The structure remains positive, suggesting potential for more upside as long as it holds .54 to .50 level
If .50 level holds, there's a chance we could quickly reach 0.80.
For now, 0.66 is the local resistance that needs to be flipped.

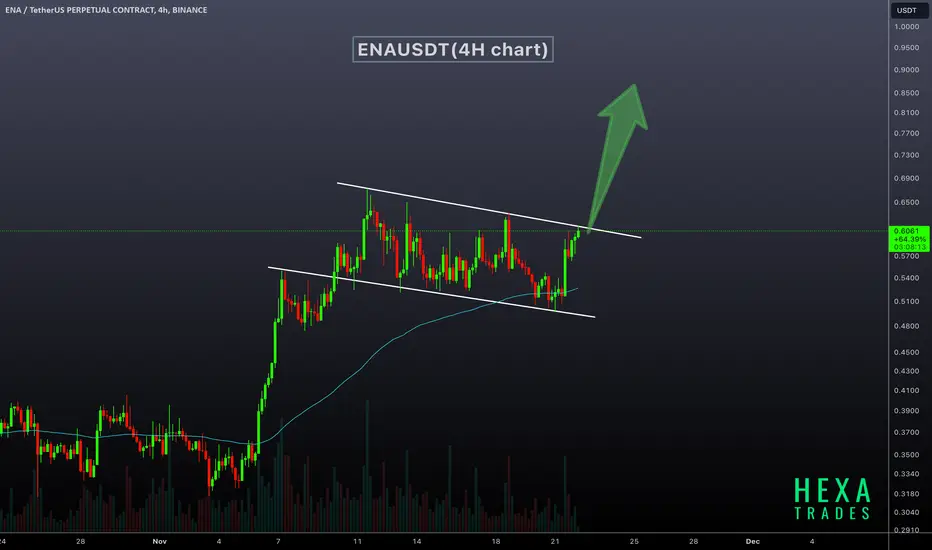
ENAUSDT Bullish Flag!ENAUSDT Technical analysis update
ENAUSDT is trading within a bullish flag pattern on the 4-hour chart, with the 100 EMA providing support at the flag's bottom. Once the price breaks above the flag's resistance, a bullish move of 50-100% can be anticipated in ENA.
Buy After breakout confirmed in 4H chart
Target: 50%-100%
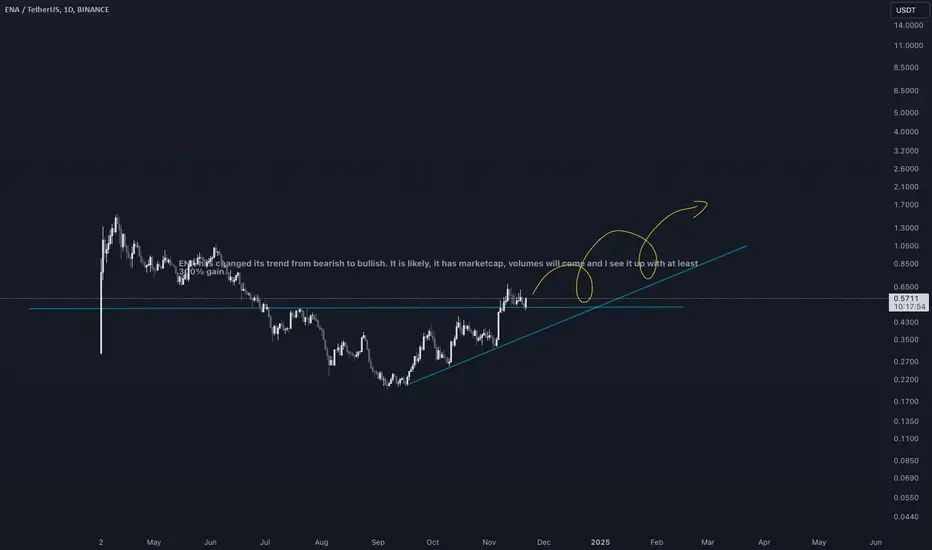
ENA - 300% UPENA has changed its trend from bearish to bullish. It is likely, it has marketcap, volumes will come and I see it up with at least 300% gain.
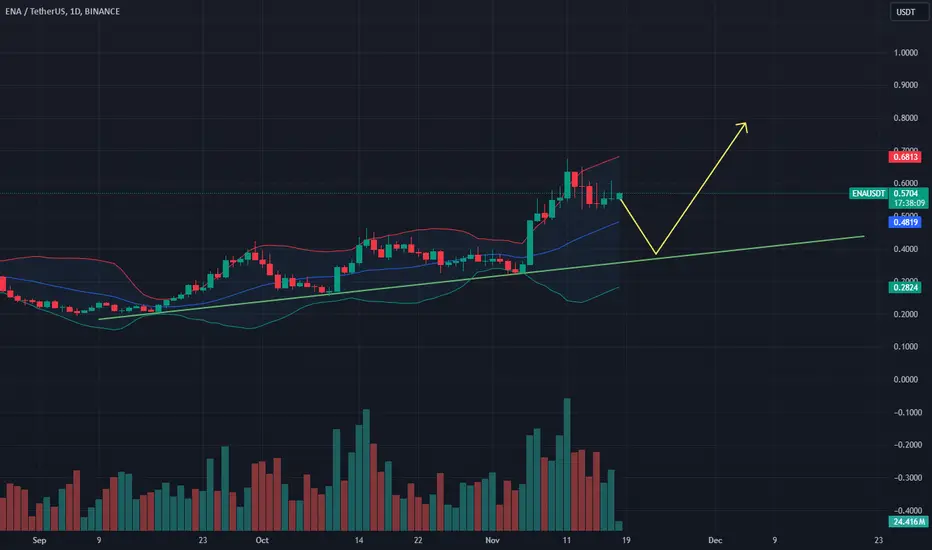
ENA/USDT Potential Pullback to Trendline Support Before ResumptiThe ENA/USDT daily chart shows a potential pullback scenario to a significant upward trendline support before continuing the bullish trend. The current structure suggests healthy consolidation after the recent rally.
Key Observations:
Trendline Support: The green upward trendline has consistently supported the price since the beginning of the uptrend, indicating its importance as a key level.
Bollinger Bands: Price is currently consolidating near the upper band, with a likelihood of retracing toward the middle band or trendline for mean reversion.
Support Zone: A potential pullback to the range of 0.53–0.54 aligns with the trendline and provides a solid re-entry point.
Trade Plan:
Entry Strategy:
Enter long positions within the 0.53–0.54 support range, awaiting confirmation with bullish candlestick patterns or increasing volume.
Stop Loss:
Place stop loss below 0.52 to protect against a breakdown of the trendline.
Take Profit Levels:
First Target: 0.58 (recent local high).
Second Target: 0.60–0.62 (next resistance zone and upper Bollinger Band area).
This analysis assumes the continuation of the bullish trend, supported by volume and overall market structure. Monitor for increased selling volume to adjust the plan if necessary.
$ENAUSDT going new ATHBINANCE:ENAUSDT
This coin will perform well in this cycle. A very strong team and a very good prospect to fly to the overhang.
Targets are on the chart. Adding to the portfolio.
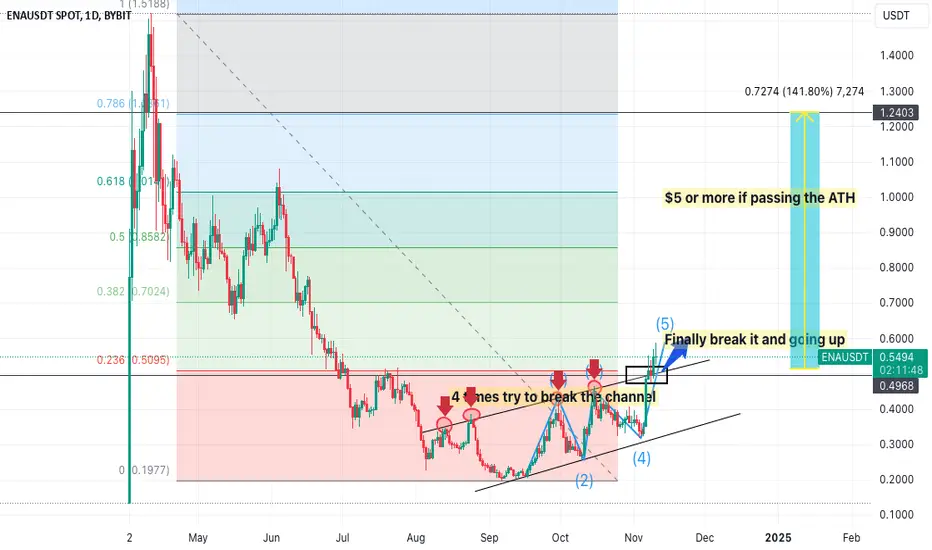
ENA (Ethena) The recent price movement of ENA (Ethena) has shown exciting technical shifts, particularly after attempting to break out of a long-standing price channel four times. This repeated testing of resistance typically indicates strong buying pressure and potential momentum toward higher price levels. With the price channel finally breaking, ENA has surged toward a target range of $2-$5 This upward movement suggests increased investor confidence and bullish sentiment, often seen when technical resistance is overcome after multiple attempts.
A price target of $5 is ambitious, yet plausible, given the increased interest and potential fundamental factors supporting ENA. However, as with all crypto investments, this analysis should be viewed as a technical observation and not financial advice, as the market remains highly volatile and subject to rapid changes based on external influences.
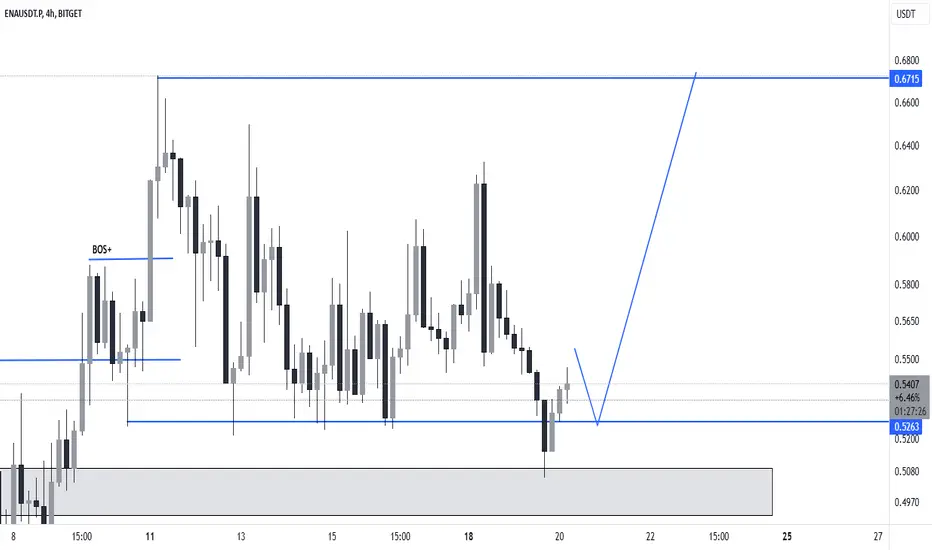
ENAUSDTHMT v1.0 spotted. Looking good with previous wave up with increasing volume and momentum.
- BOS (Breaks of Structure) at @ 0.5303-0.5389 level
- Trending slow and steady if able to hold above the BOS level
It is at extremely good reward to risk level.

ENA/USDT Short Opportunity - Channel Resistance Test!📉 ENA/USDT Short Opportunity - Channel Resistance Test!
Timeframe: 1H
Current Price: 0.4964 USDT
Trade Type: Short
Chart Analysis: ENA/USDT is trading within a clear upward channel, with the current price action testing the upper trendline. This level has shown resistance in the past, increasing the probability of a pullback within the channel.
Resistance Level: The upper channel boundary near 0.5000 is a strong resistance zone, as seen in previous attempts to break above it.
Support Level: The lower boundary of the channel, currently around 0.4250, could act as a support target if the price reverses.
Trade Setup:
Entry Point: Short entry around the current price, near 0.4950.
Stop Loss: Place just above the resistance line, around 0.5050, to allow some buffer.
Take Profit: Target the lower channel boundary around 0.4250, aligning with the channel's support trendline.
EMA Insight:
The price is above the 200 EMA (0.4165), indicating a bullish overall trend, but this trade capitalizes on a potential short-term retracement within the channel.
Conclusion: This short setup within the channel offers a favorable risk-to-reward ratio. However, watch for any significant breakouts above resistance, which could invalidate the setup.
Trade Safe!

ENAUSDT Buy opportunityENAUSDT experienced a significant decline after being rejected from the important supply zone mentioned in our previous analysis.
The drop has been substantial, leading us to believe that it has now reached a strong demand area. The provided demand zone presents a favorable opportunity for buying accumulation. We would appreciate hearing your perspective on this coin.
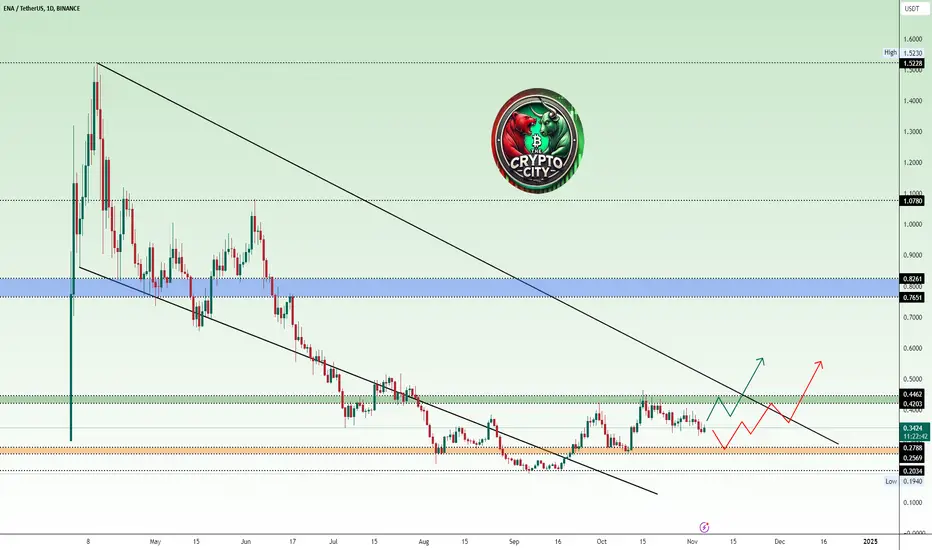
ENA USDTENA chart shows the price behavior within a descending channel. The price has been respecting the channel boundaries, with each peak and trough aligning with the upper and lower trendlines. The price of ENA has been rejected from the upper boundary of the descending channel and the resistance zone (Green) at $0.4203 - $0.4462 many times.
Everything is on the chart
Here's the latest update on #ENA:Here's the latest update on #ENA:
An Inverse Head & Shoulders accumulation pattern has been fully formed, and the price is currently testing the neckline, indicating potential bullish momentum. 👀
A breakout at this point would signal a significant upward move. ✈️
Note: GETTEX:ENA is part of the Ethereum ecosystem, adding to its potential appeal and strength. 🔥
Price Targets:
🎯 Short-term target: $0.7630
🎯 Mid-term target: $1.1265
🎯 Long-term target: $2.3380
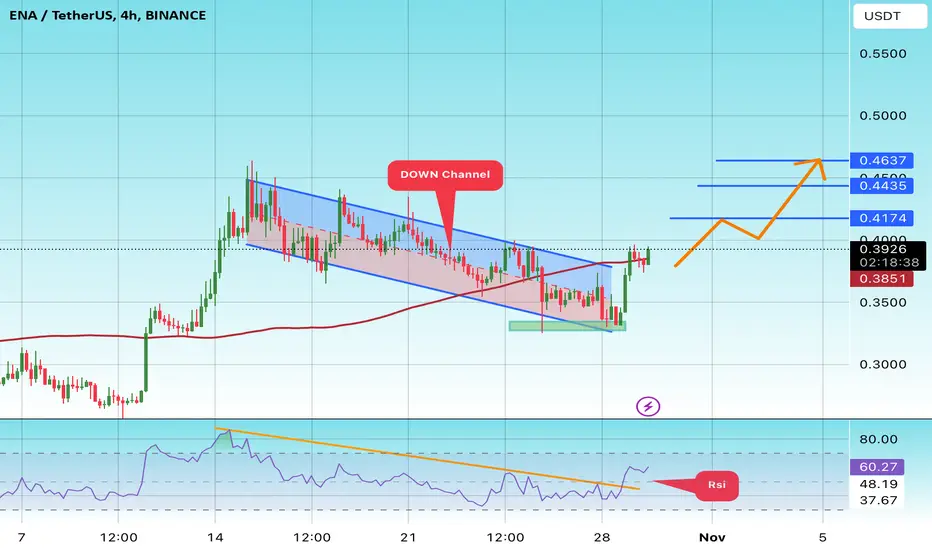
#ENA/USDT#ENA
The price is moving in a descending channel on the 4-hour frame upwards and is expected to continue.
We have a trend to stabilize above the moving average 100 again.
We have a downtrend on the RSI indicator that supports the rise by breaking it upwards.
We have a support area at the lower limit of the channel at a price of 0.33100.3800.
Entry price 0.2800.
First target 0.4174.
Second target 0.4435.
Third target 0.4637.
ENA (ENA/USDT) Technical Analysis – November 2024ENA (ENA/USDT) Technical Analysis – November 2024
The chart indicates that ENA has broken out from a descending wedge pattern, suggesting the potential for a strong bullish reversal.
Key Observations:
Current Price: $0.5279 (+50.27%)
Resistance Targets:
First Target: $0.8921
Second Target: $1.2159
Third Target: $1.5664
Technical Pattern: The breakout from the descending wedge, a pattern typically signaling a reversal from bearish to bullish, supports a potential upward trend if volume and momentum continue.
Next Steps:
Watch for price action around the $0.8921 level to confirm continued momentum. A retest and hold above this level could propel ENA to the next targets of $1.2159 and $1.5664.
#ENA #Crypto #TechnicalAnalysis #Breakout #PriceTargets

$ENA had the most promising setupI just have the chance to share this setup. Now it is perfectly align and will continue its long term target back to $1.

ENAUSDT (Ethena) Updated till 07-11-24ENAUSDT (Ethena) Daily timeframe range. PA got lots of space to move around here. if the candle above 0.4301 dont get invalid it can get to 0.5982 or above depends on volume. but for that it needs to hold 0.4301. recent support at 0.3212.

#ENAUSDT (11-2024) Ethena (ENA) Price Analysis
Price: $0.42
Support Level: $0.32
Resistance Level: $0.51
Technical Indicators: Ethena continues forming higher lows, indicating a bullish trend. RSI is above 60, suggesting positive momentum and potential for further gains if the market maintains strength.
Market Overview :
Ethena (ENA) is ranked among the prominent DeFi projects with over $1.5 billion in total value locked (TVL) just months after its February 2024 launch. The ENA token plays a role in governance and in managing risk within the Ethena ecosystem, which is centered around its synthetic stablecoin USDe. This DeFi protocol is designed to operate without dependence on traditional finance, using a delta-neutral strategy to back its stablecoin while maintaining stability during market volatility.
Potential Growth Catalysts A breakout above $0.51 could signal a new bullish wave, pushing prices higher, with mid-term targets of $0.60 to $0.70, if general market conditions are favorable.
With its innovative DeFi approach and strategic partnerships, ENA is positioned for growth in both usage and value as the ecosystem expands. However, a close below $0.32 could indicate potential downside risks, suggesting a re-evaluation of positions.
#ENA Since 19 Sep
When we recommend adding a coin to your watchlist, it's typically due to forming a pattern, nearing a historical bottom, or approaching a strong support level. It may also show increased trading volume, reversal candles, or be in an accumulation stage. While we haven't observed a bullish reaction yet, we advise monitoring it until an optimal entry point emerges.
PS:
We avoid trading coins associated with gambling, prostitution, human trafficking, etc.
Note:
This is not financial advice but an analysis of coin movements. Conduct your own research and practice risk management before making any investment decisions. Remember, the cryptocurrency market carries significant volatility and risks.
Best wishes to all,
we ask Allah reconcile and repay. 🙏

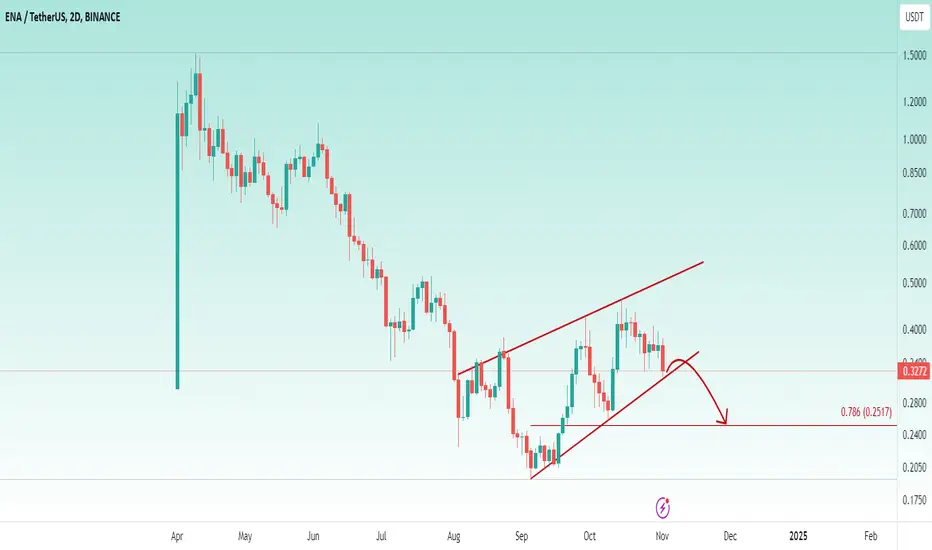
Clear Bearish Setup 👉 The Main Pattern Formed At The Chart Is a Rising Wedge And The Price Rejected From 0.46$ Resistance And Currently Playing Above The Support Line, Expect a Breakdown The Trend Line To The 0.25$ As a Next Target