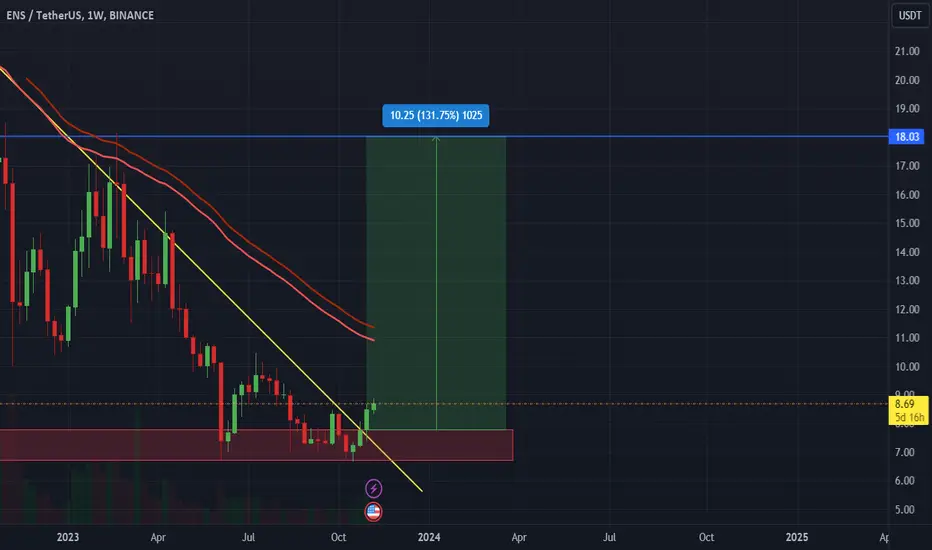
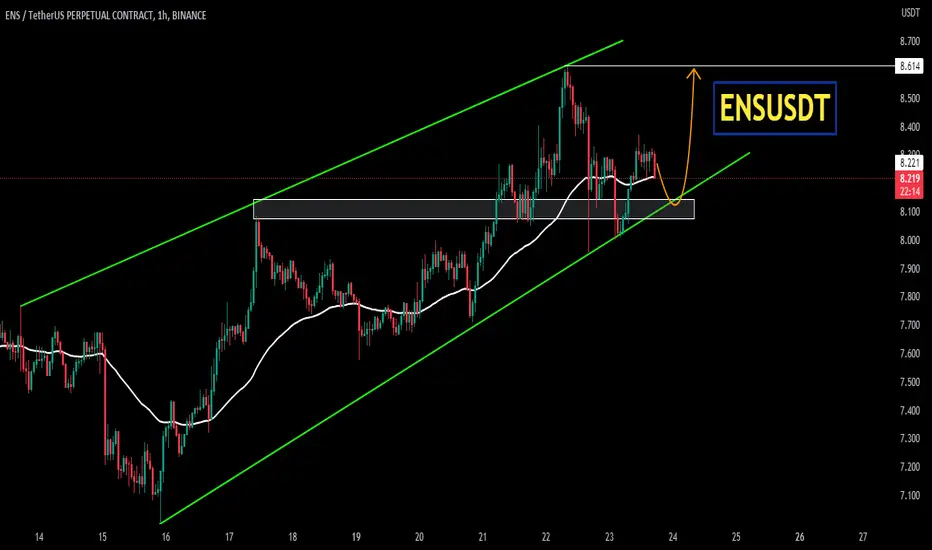
ENS LONG LONG LONGThe coin rebounded from the demand zone and broke through the trend line. Expecting to rise to the next level 👀⚡️
Монета отскочитла от зоны спроса, пробила линию тренда. Ожидаю подняться до следующего уровня 👀⚡️
ENSUSDT trade ideas
ENSUSD - AddingENS has great potential.
This theory is supported by a great RSI position and my current assessment of the market.
I would like to see the up movement to make kind of a cup structure within the entire price range. I have tried to show this with the bars pattern tool.

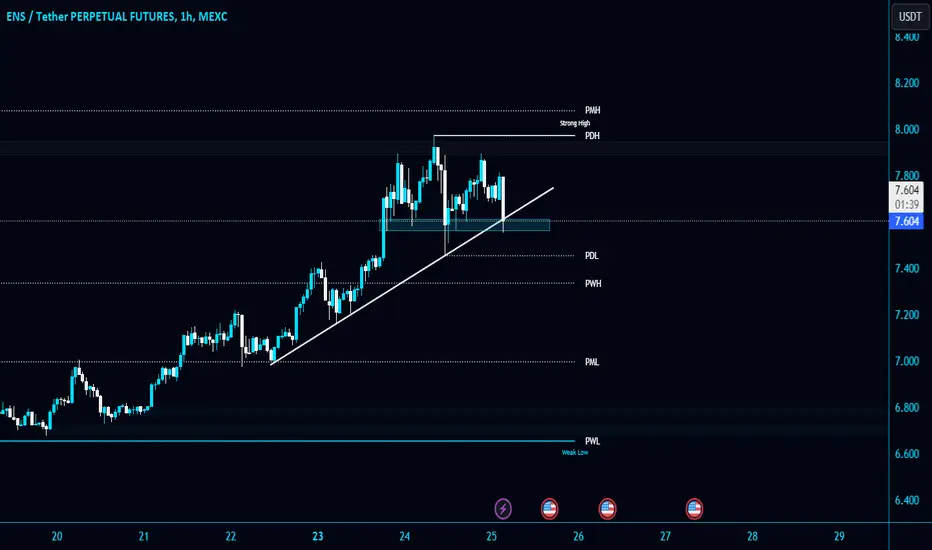
#ENS/USDT is testing the Diagonal Trendline and support level in#ENS/USDT is testing the Diagonal Trendline and support level in 1-Hour TF!
NYSE:ENS needs to clear PDH and PMH $8.07 resistance levels to gain the bullish momentum, and we can long it.
Looking for Shot if #ENSUSDT breaks the Diagonal Trendline.
ENSUSDTBINANCE:ENSUSDT Short idea
⛔"Daily crypto market analyses I provide are personal opinions & not financial advice. Trading carries risks, so do your own research & seek advisor's help.#DYOR"
Don't forget to like and comment
Check out the market spot Hello, many of my friends have asked messages and Sol regarding the last caption of the previous analysis. I answered the dear ones as much as I could. But because there were many questions, it needed an explanation. In this regard, I told the head of the mafia to leave a room and let's talk, dear ones. It seems that it is better for you to remain in the sleep of neglect. And there is a proverb that says that until there is no donkey, there will be no donkey ride. I take God as my witness that during the past 3 years, I honestly tried to do the talking, but they didn't let me (the same people who said until yesterday, come and talk, now they say you don't know. It's interesting, it's very interesting. I said it once, I'll say it a second time.RTM in Iran is managed as an archipelago. There is nothing wrong with being managed, but my island will definitely be separate in the future. To the loved ones who learned from me but dissed me. If your self-confidence was a frog, it would become a crocodile(1889 xausd??it was good? How was three years of step-by-step net-to-net market not enough? Creators, whatever they deserve. Darabi and Zarbi and... are the leaders of the mafia, take care of yourself and know that the tribune is in the hands of the illiterate) Goodbye
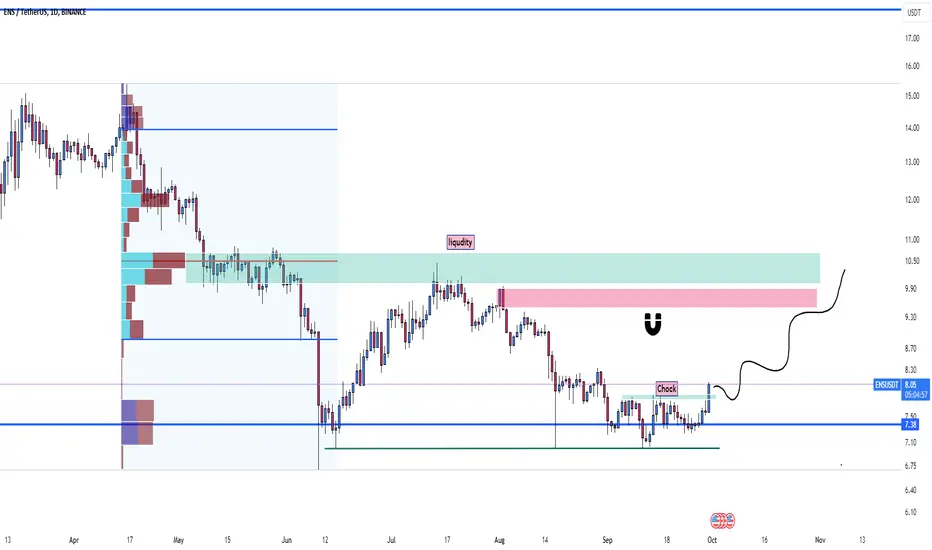
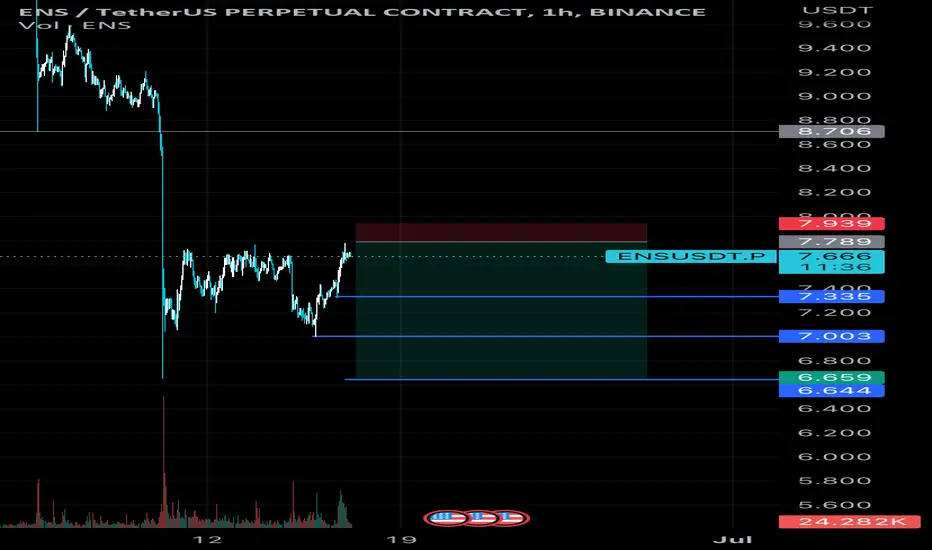
ENSUSDTENS getting strength and We have liqudity sweep happened .. thats shows that this coin is about to go higher and major liqudity pool and to visit upper OB.
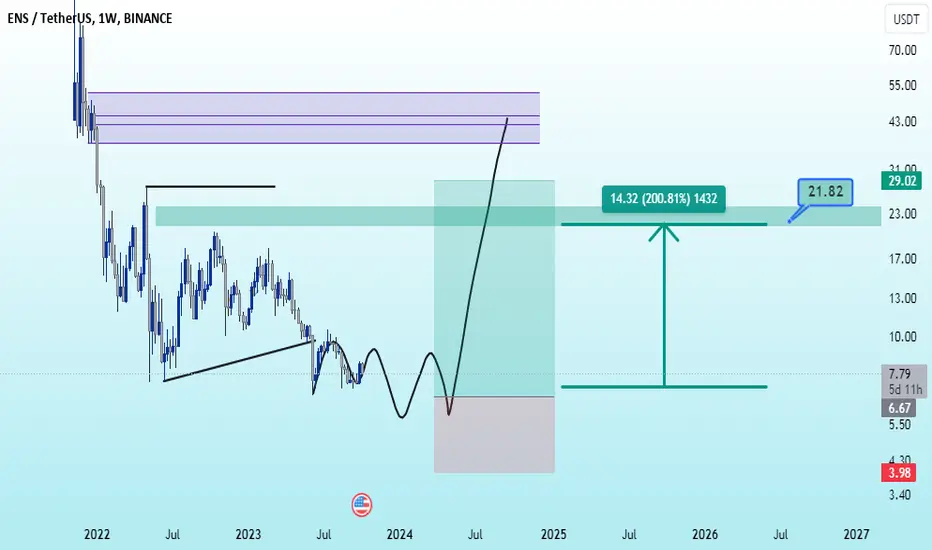
I think we will see 10 usd soon.
Be safe ..
Mafioz
ENS USDT PERPHello Trader
although now the bearish phase is over in the short term (scalping) we can be sure that this pair is bullish for the near future.
Please add a comment and Positive feedback and
constructive criticism are important to authors and the
community.
Disclamer: Not Financial Advice
sell ens sell ens usdt at 7.80 - 7.98
sl: 8.08
target: 7.70 - 7.61 - 7.51 - 7.22
strong supply at 7.98
r/r 15
strategy supply & demand
usdt.d break 8.08 % go to 8.28%
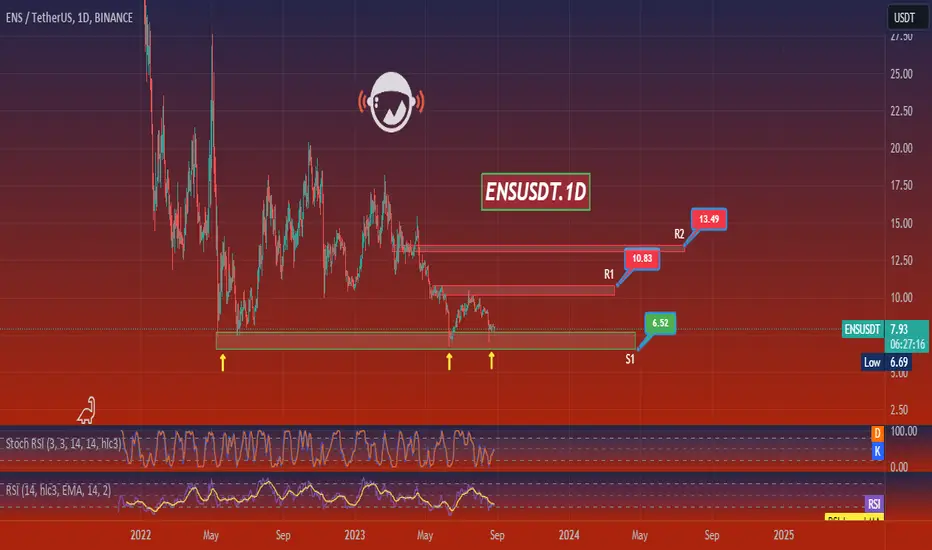
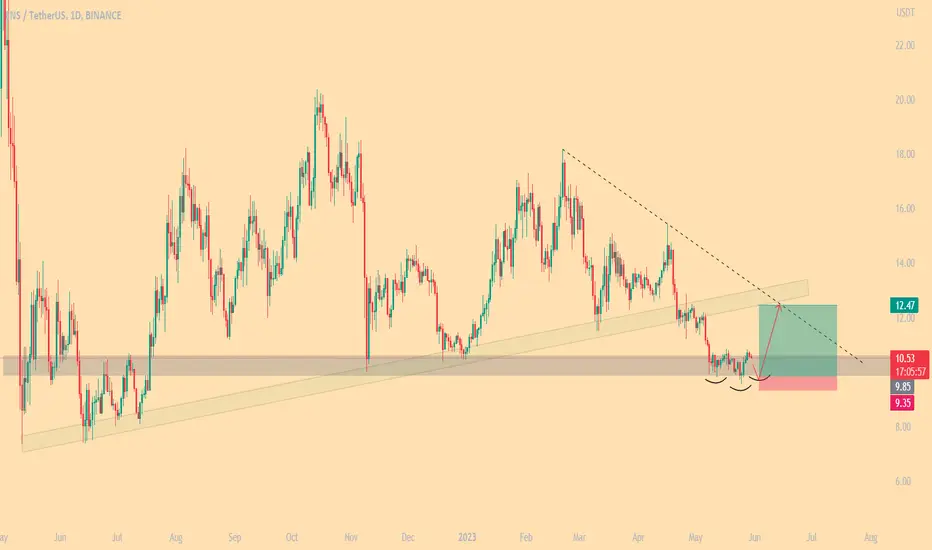
ENSUSDTThis is a 1D frame analysis for ENSUSDT As you can see, the price is holding onto its weekly support and we can assume that the price can see higher numbers if it can establish itself above the support line. With the consolidations, we can say that the price is in a range and if it can break out from either side, we can move in that direction. Suggestion: Given that the price has not established itself firmly yet, it is better to wait for the price to break out completely from one side before we start trading.
ENS Preparing for a Bull Run? | ENS/USDT Analysis💎Yello Paradisers, let's unpack ENS/USDT for a moment. Right now, it's navigating a downward channel, but we're keeping our eyes peeled for an imminent breakout.
💎If this breakout materializes, we can expect a dynamic price surge, just as we've projected.
💎Worth noting are the dual confirmed Order Blocks on the shorter timeframe. Given the liquidity in these zones, the price is likely to gravitate towards them.
💎Remember that a previous demand zone flipped into a supply area, leading to a notable price decline and aiming for the earlier Order Block. However, market uncertainty is a huge factor in this projection.
💎More updates are on the way, so stay tuned and make the most of your trading journey!

ENS - Still Looking for Shorts
Even though the green descending trendline was broken, I don't consider this a bullish signal.
The more important gray trendline is still holding, and we are below major $10 resistance.
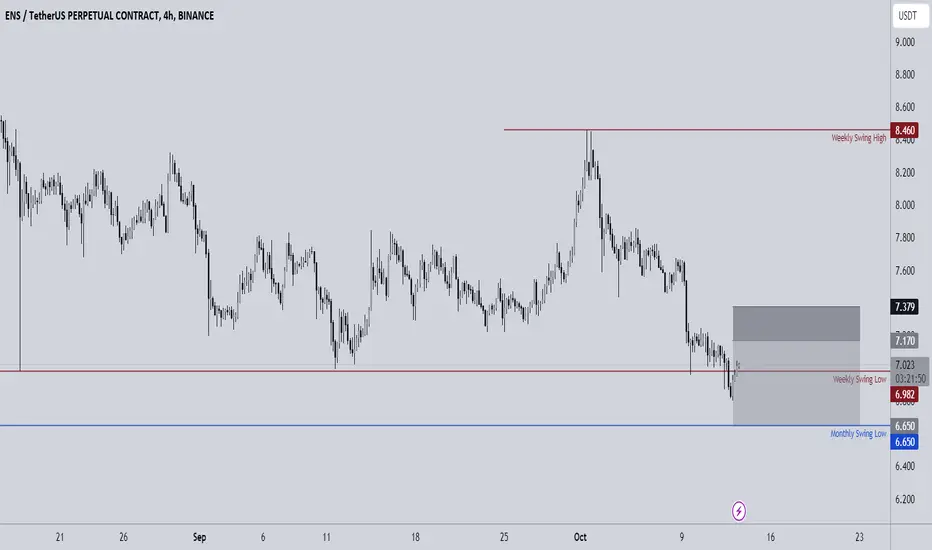
I expect a new lower low under $6.69.
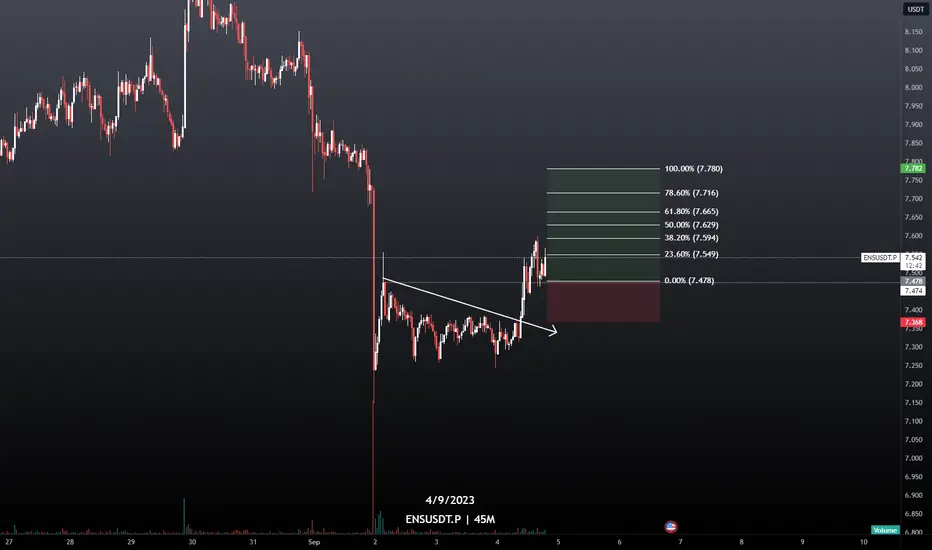
ENSUSDT a new bearish impulse?According to Plancton's strategy, if ENSUSDT experiences a pullback around the $9.5 price level and shows signs of potential bearish momentum, a suitable trading order can be set to take advantage of the anticipated bearish impulse.
Setting a short order could be a viable approach in this scenario. A short order involves selling the asset with the expectation that its price will decline. By initiating a short position, traders seek to profit from the downward movement in the price of ENSUSDT.
–––––
Follow the Shrimp 🦐
Keep in mind.
🟣 Purple structure -> Monthly structure.
🔴 Red structure -> Weekly structure.
🔵 Blue structure -> Daily structure.
🟡 Yellow structure -> 4h structure.
⚫️ Black structure -> <= 1h structure.
Follow the Shrimp 🦐
ENS/USDT Bullish move ahead ?👀 🚀ENS Today Analysis💎 ENS is primed for a bullish surge as it adheres closely to the trendline and maintains a strong support zone.
💎 The existence of a bearish OB, FVG, and liquidity are likely to bolster its upward trajectory. The price is expected to ascend to mitigate the bearish OB, fill the imbalance, and seize liquidity.
💎 Additionally, the volume is demonstrating robust momentum, indicating potential upward volatility.
💎In the dynamic world of crypto, staying informed and adaptable is key. Stay tuned for more updates and enjoy your trading journey

$ENS Short OpportunityAfter an incredible pump, NYSE:ENS is trading in the premium zone, anticipating a retracement.
Is a strong crypto right now you have to manage the risk very well.

Possible double top in $ENSShort entry in 1H TF, with a possible double top and search for the equilibrium zone.

$ENS got stopped overnight with my SUI play . kept stop too tight
wanted to hop back on but bitter so not gonna
this bubba closed above daily on 13ema so lets keep the range low as our invalidation
and wait for a flip of the yellow line on the 1hr
Bitcoin still undecided but surely wee pump to mark the weekend
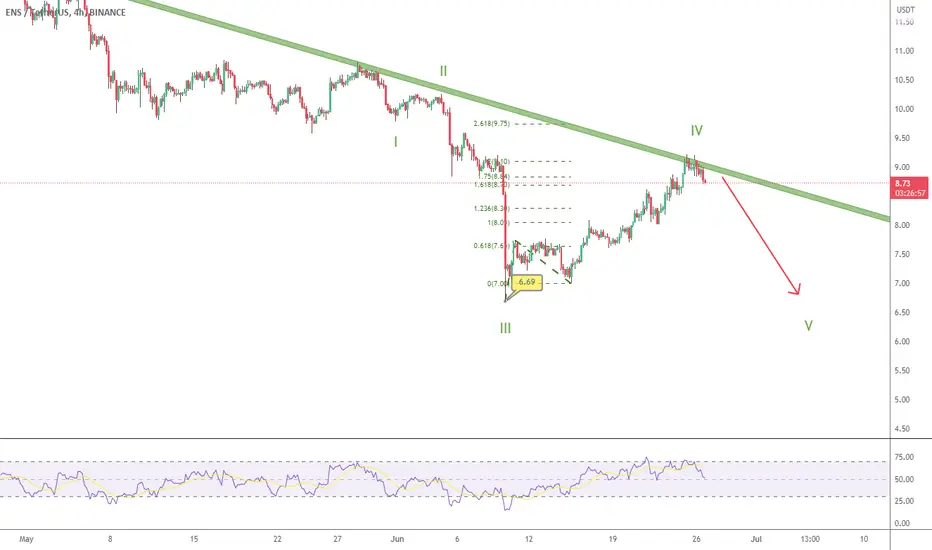
ENS - We could have one more leg down
Price has been reacting since early june, but My primary count still considers that we need another leg down below 6.69.
To be honest, I´m not really comfortable with the timing of wave 4... but I´m keeping the bearish bias for now and will look for short trades.
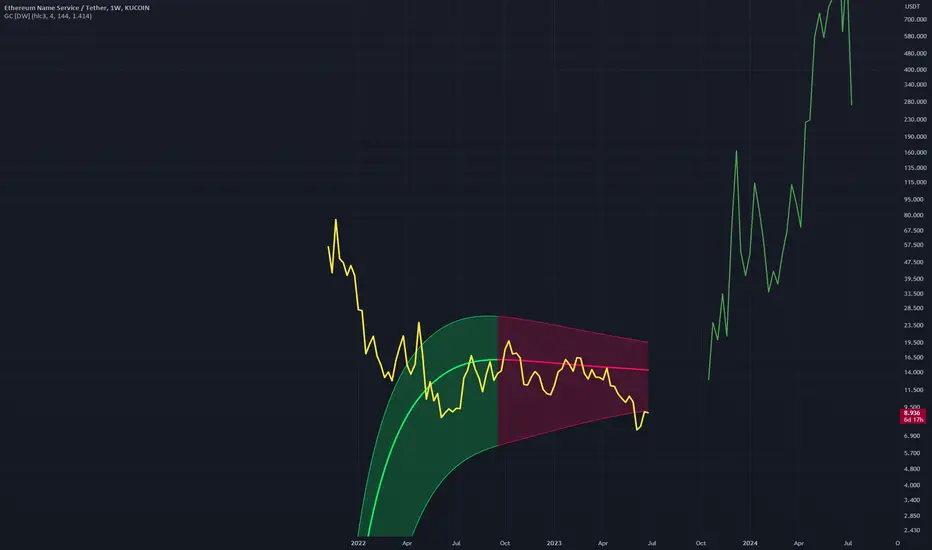
ENSUSD - Strong Gaussian ChannelA display of a Gaussian Channel on Weekly that is in a period of indecision
This is a strong bull argument with price just dipping before a large rise both on the Gaussian Channel indicator and with price.
Im really bullish on ENS Weekly.
ENSUSDTOCEANUSDT is trading in bullish momentum ,currently the is hovering around support zone in 8.10 region. If the instrument hold this support region, it will be nice buying option.
ENSUSDTENS, after breaking the bullish trendline, has now found support on another historical support zone that could potentially push the price back up. The target of this upward movement could be a retracement to the previous trendline or a break of the downtrend line. The entry zone below $10 can be attractive.
⚠️"Daily crypto market analyses I provide are personal opinions & not financial advice. Trading carries risks, so do your own research & seek advisor's help."
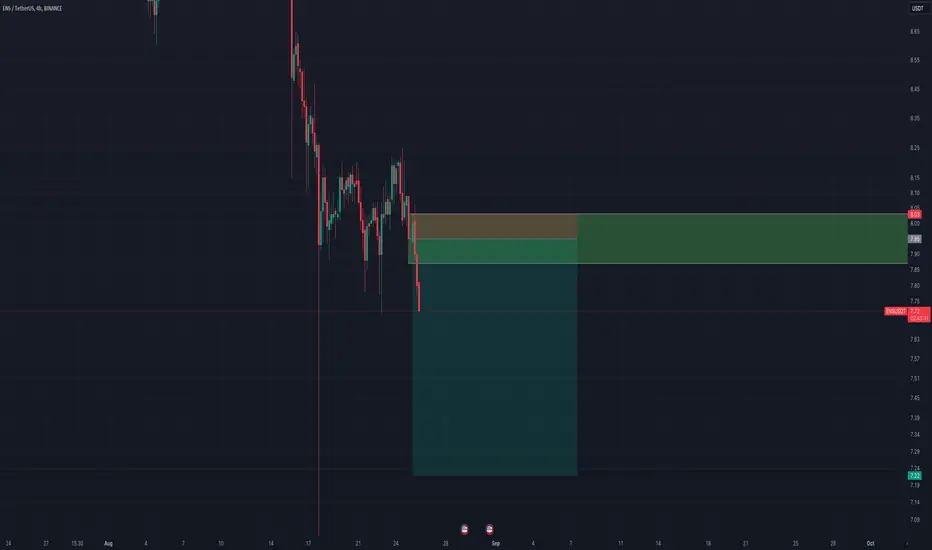
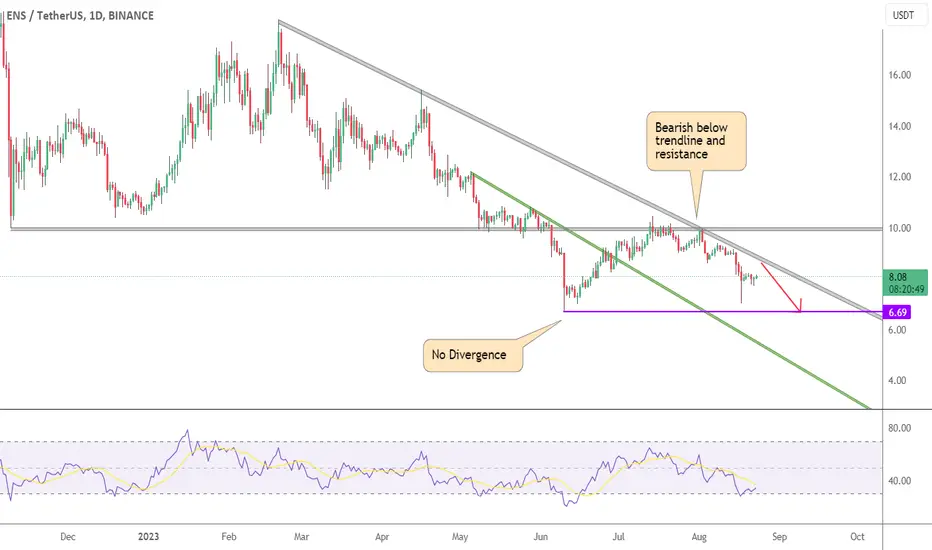
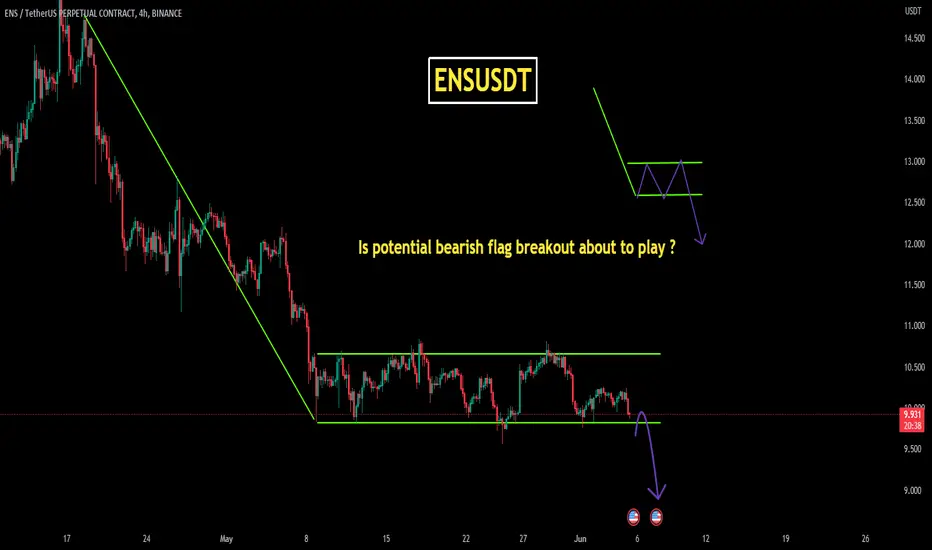
ENSUDTENSUSDT currently trading in bearish flag pattern, as there is no significant bullish divergence on the pair, will the ENSUDT break flag to downside to continue its bearish trajectory ?
Analysis of the super future token ENSAnalysis of the super future token ENS
This currency has been correcting during the last one hundred days (red downward trend lines) and has reached its price floor in the last 316 days!
Due to being in a good block order area, we can hope for price growth.
The range of $9.93 can be suitable for buying, and if the downward trend line is broken, we can hope for the price to grow to the specified levels.
Don't forget capital management and compliance with risk to reward
