ENSUSDT trade ideas
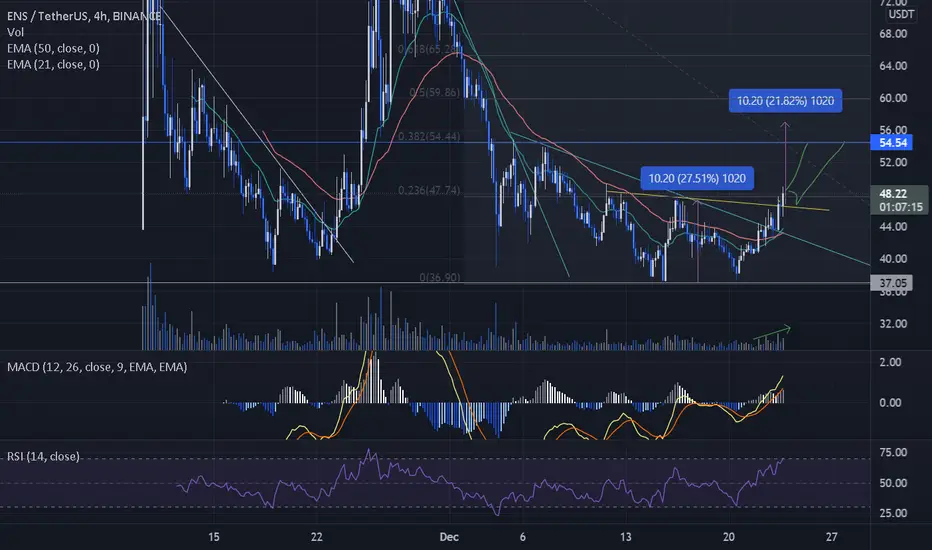
ENS is moving towards 54.5- Ens broke out the double bottom pattern following the bitcoin move.
- Volume looks good making the move
- MacD just crossed at the 1D and has still a lot to go on the 4H
- The technical target of the outbreak of this pattern would be 57
- HOWEVER : the next resistance rests on 54.5 laying up exactly at the 0.382 fib. level.
ENSUSDT, Its time to buyHello everybody
According to the previous analysis, we shown on chart that the price after break the resistance zone area its need to have recovery then it can be ready to continue move upwards.
And now at this time this event happend and we complete the correction and we are ready to move upwards and take profit. :)
Everything was shown on chart, and please trail your position and manage it
Previous analysis :
Good Luck
Abtin
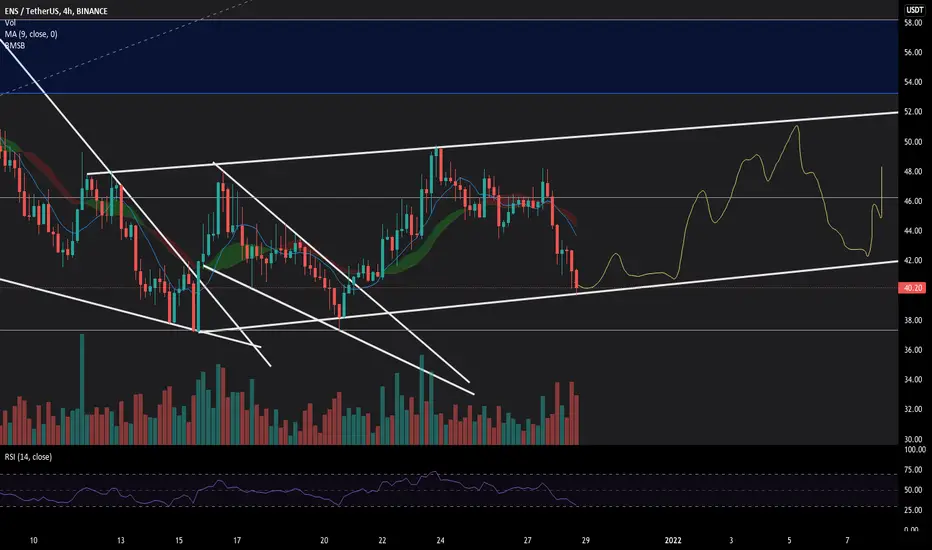
Are we in a range??It appears we may be in a slight ascending range.
New to trading, so take what I have to say with a grain of salt. 4 hourly RSI looks like it bottomed out. Worst case we go back to 38 dollars if not.
I have 100% faith in the technicalities of this coin, nothing else on the market like it. A very simple concept that I cannot believe hasn't been implemented beforehand.
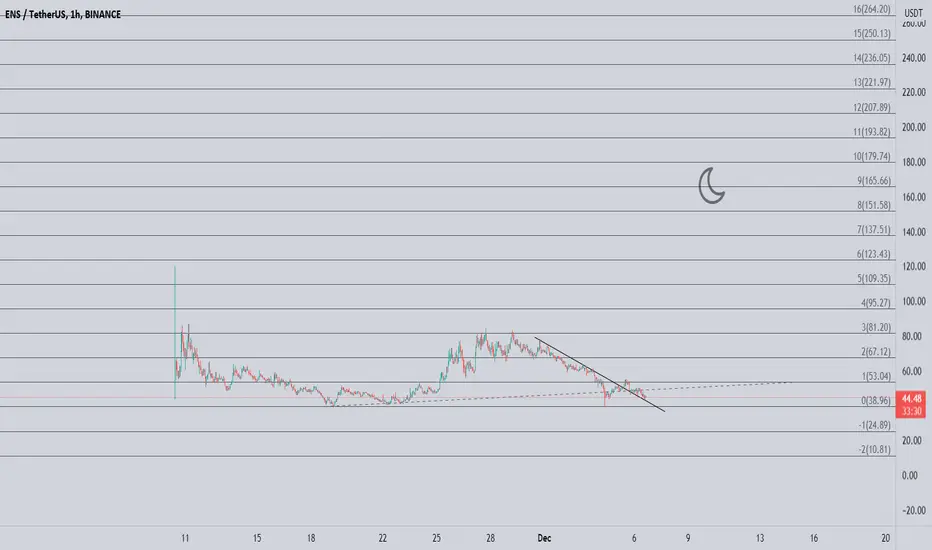
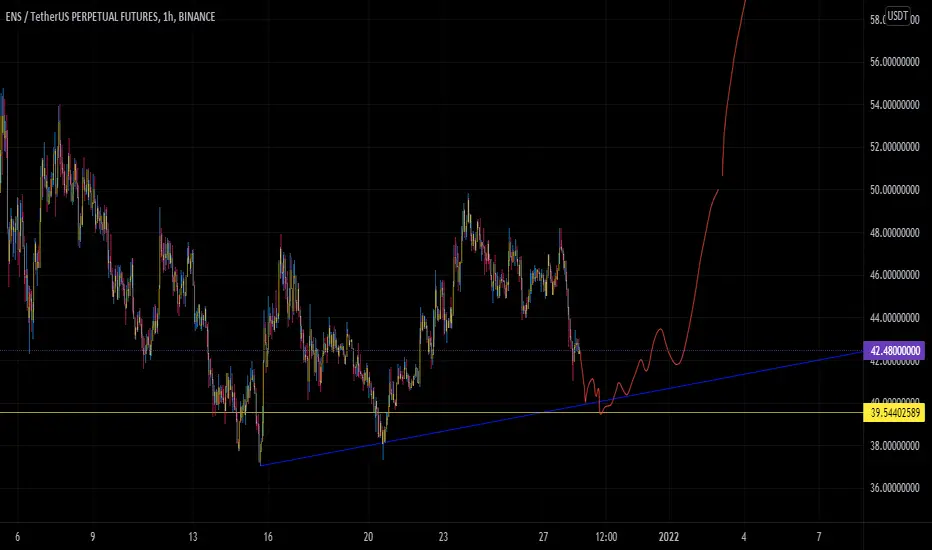
ENS most obvious trend to takeYellow line is buy price, of course whole market depends on btc move now but this is the buy price, we gotta buy and see what happens...
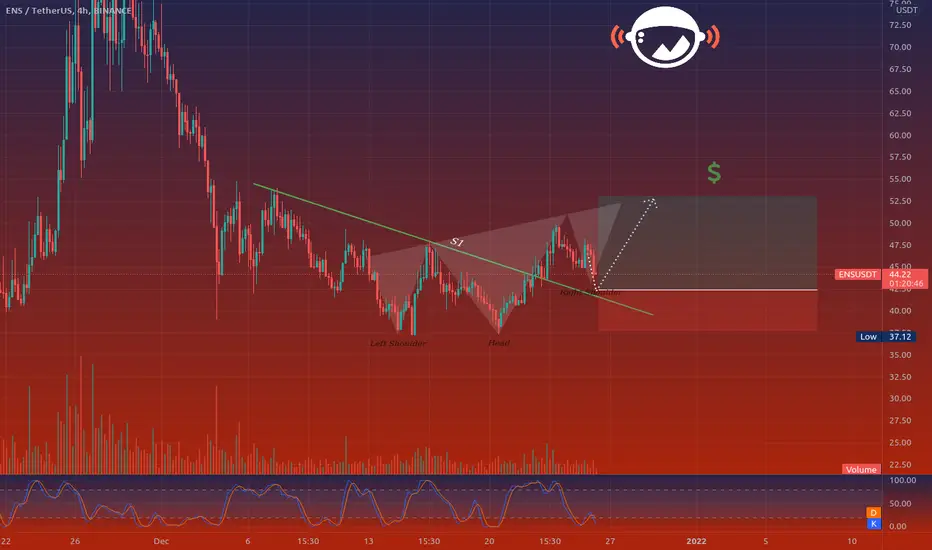
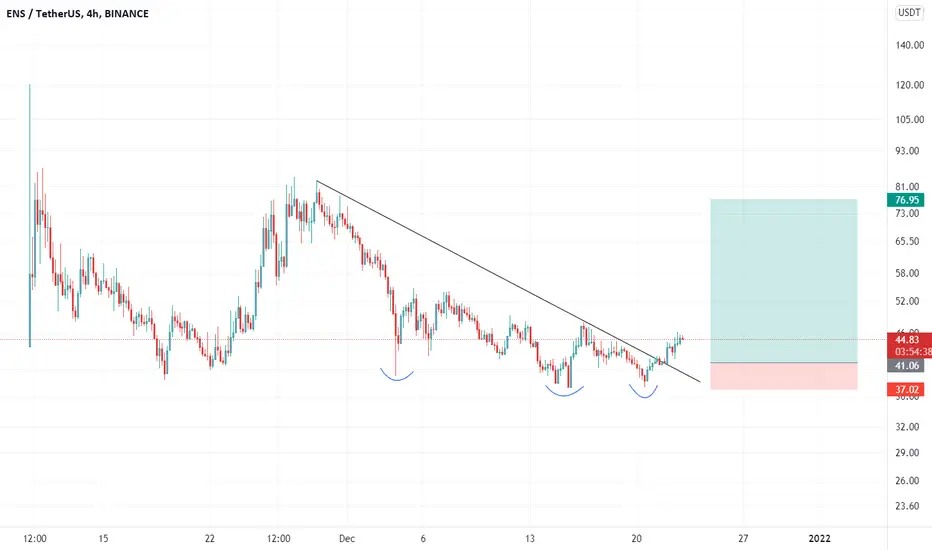
ENSUSDT created a falling wedge ENSUSDT created a falling wedge and now the price is going to test the daily resistance.
IF the price is going to have a breakout According to Plancton's strategy (check our Academy ), we can set a nice order
–––––
Follow the Shrimp 🦐
Keep in mind.
🟣 Purple structure -> Monthly structure.
🔴 Red structure -> Weekly structure.
🔵 Blue structure -> Daily structure.
🟡 Yellow structure -> 4h structure.
⚫️ Black structure -> <4h structure.

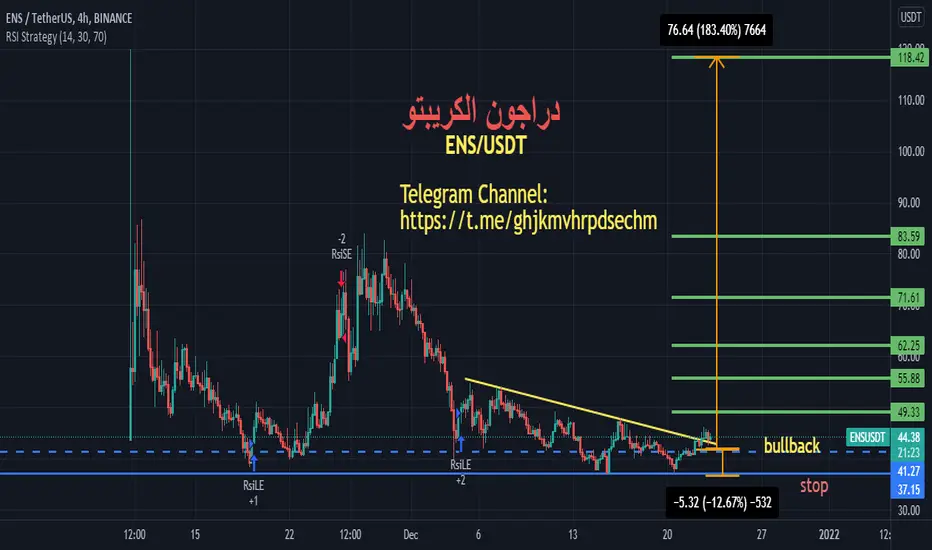
ENSUSDTHello Crypto Lovers,
Mars Signals team wishes you high profits.
In the 4-hour time frame you can see that the price has been able to break its resistance line to the upside which has now turned into the support line. This is the pullback and we expect it to move toward the next resistance which is around $52. If the price goes below the line, we can say that we are in the bearish scenario. You can also see a head-and-shoulder pattern there and if the pattern works out, then the price will come down to $42 for the pattern to be completed and then the price will go back up.
Warning: This is just a suggestion and we do not guarantee profits. We advise you to analyze the chart before opening any positions.
Wish you luck
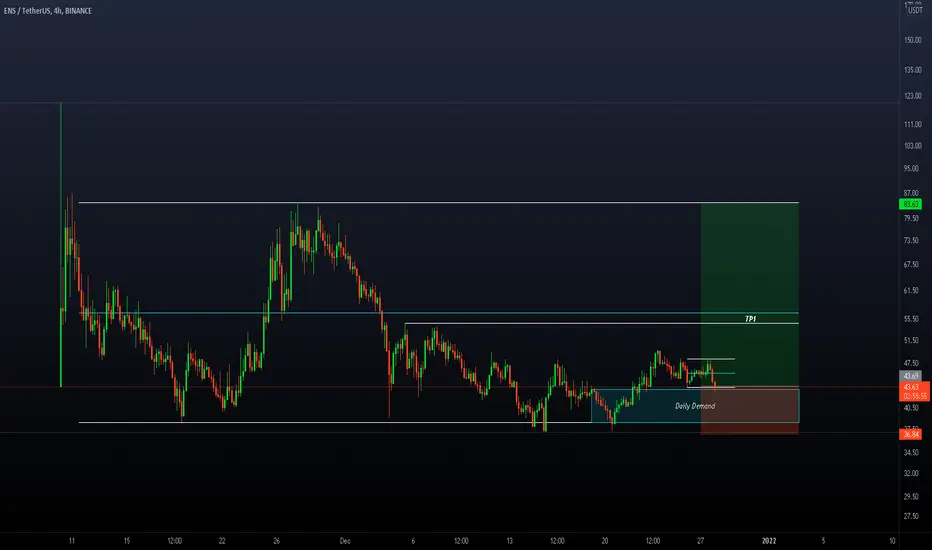
ENSUSDT 4HBINANCE:ENSUSDT
The Ethereum Name Service project is a system based on the Atrium blockchain platform that has ability to create web addresses on this platform.
Buy area 41
Sl 36
Target 54-62-76
ENSUSDT, It can move like this movement ...Hello everybody
Do you know something about ENS ??
If you wanna know about that and wanna we publish fundamental of the coin/token, CM it for us
According to the chart you can see the price changed the trend from donward to upward and its coming to reach to the resistance zone level
If the price can break this resistance zone the movement that we shown on chart its in our mind and it can go up reach to new target
We will update this chart in future and if it can break the resistance zone we try to update new target and publish it
If you have any question send us message in private
Good Luck
Abtin

ENSUSDT SetupThere is a high possibility of having an upward trend, based on Ichimoku Clouds and Price Action. If you see, you will realize that ENS has touched the current level three times, which is a sign for a long setup. Remember, everything depends on BTC, but for now we have a bullish trend. If anything happens, I will let you know. lastly, whenever you are in profit, you can take it. ENJOY!

ENS WEB.3 is ready to RISE AND SHINEWe made 2x at previous pump and now i see exacly same moving. Remember DYOR and dont listen anyone. Im just sharing my opinion.

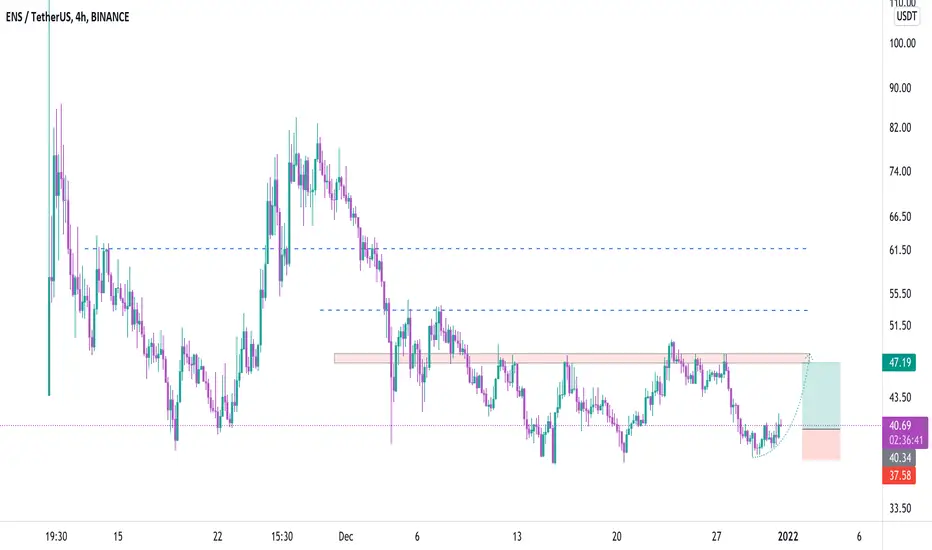
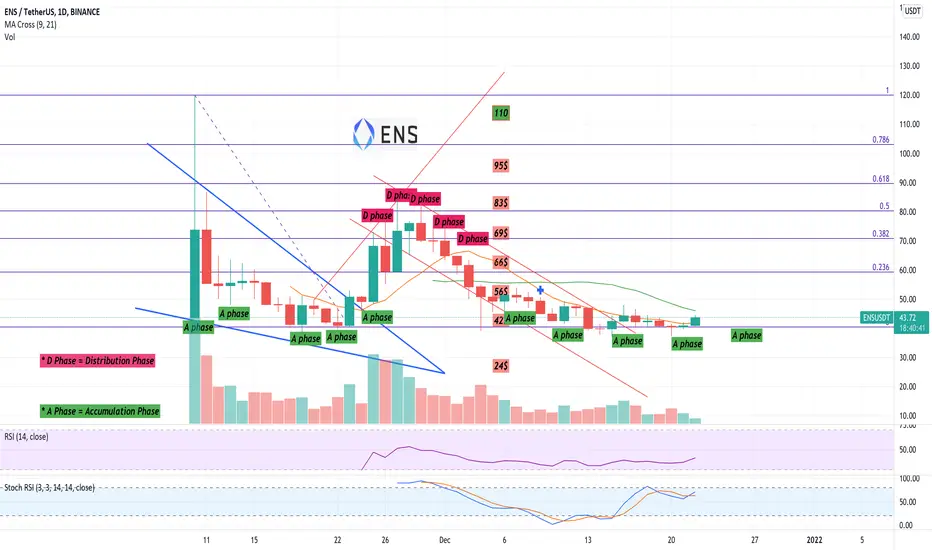
ENS above $47 will become Super Bullish!#ENS above $47 will become super bullish.
>ENS About to complete the A phase which is the accumulation phase
>ENS prepping for new ATHs
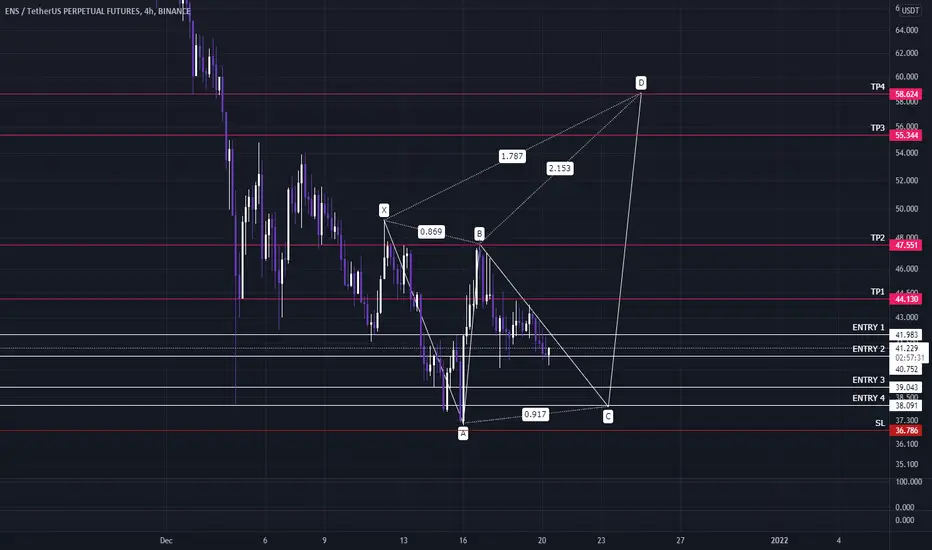
Long on $ENSPerfect setup for a long on $ENS.
Double retest confirmation. Spring, backtest spring.
Plotted Fibonacci extension. Targets painted on chart.
As long as Bitcoin doesn't get rekt, ENS will be fine!
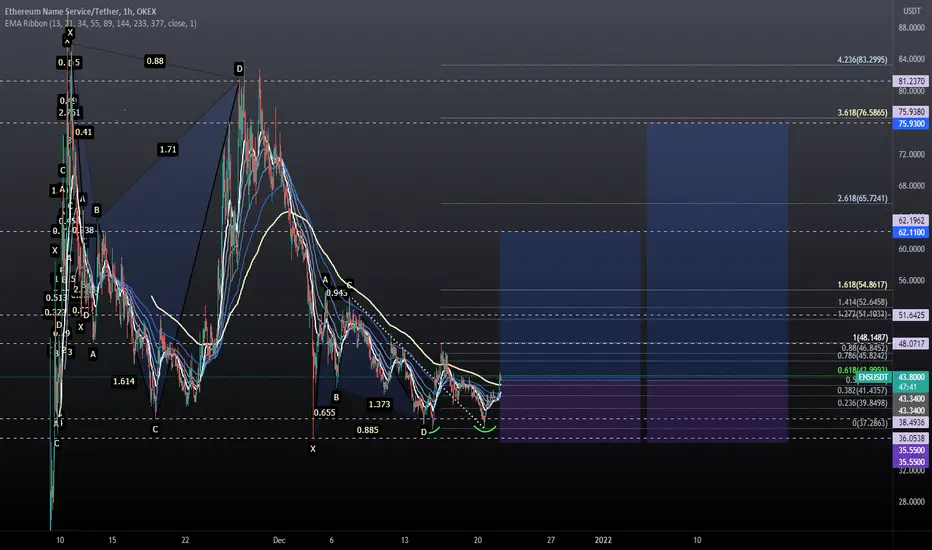
ENS - VRGL.PANICIts quiet obvious for new coins to perform like this based on harmonics. ENS is still quiet new.
This is my take on where ENS will go, using harmonics and fibs as technical analysis.
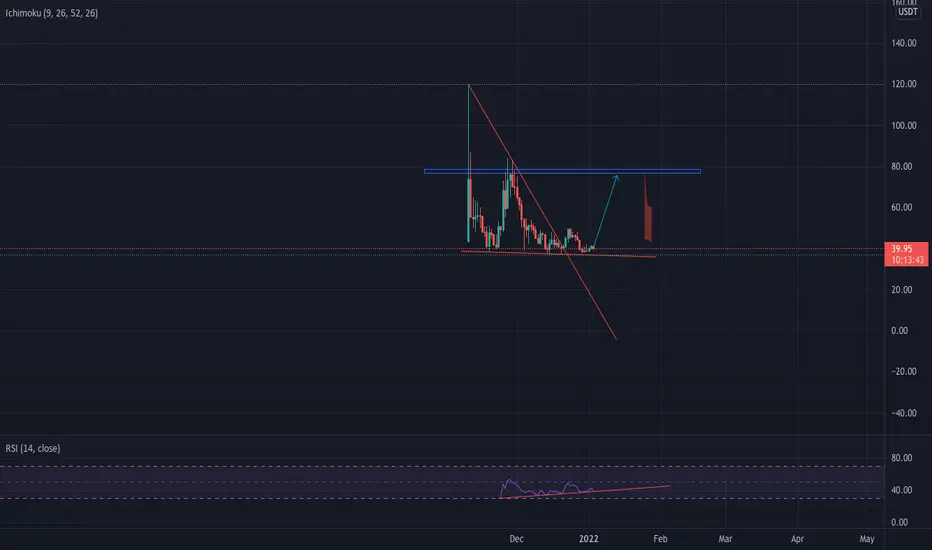
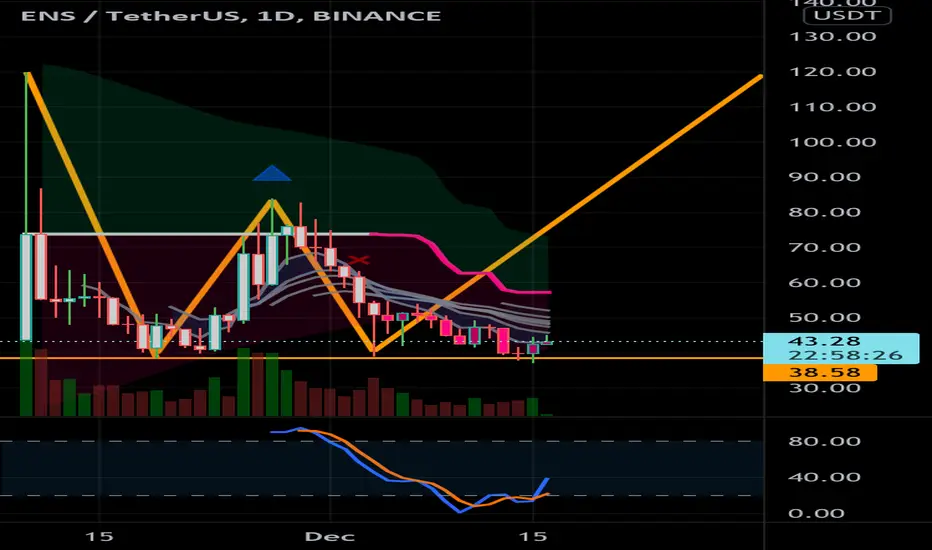
ENS Potential DecouplingWell hello there,
It has been years since I have posted here, its been years since I have properly interacted with the Crypto space, now returning in a much healthier way all things considered personally.
The idea i have here for $ENS is that it currently sits on the 200MA forming what looks like a pennant. I have copied the last time it did that recently to the chart where ENS has only recently been released and the 200MA only had just appeared before the last considerable move up. I think that moving into the new year that assets like ENS have the potential to decouple from $BTC and forming unique price structures.
Looking left TP's would be the previous ATH of 80 ish and long term 120 - 249 USD in perhaps 6 months or so. I am not interested in making exact calls, i obtained these figures through basic fib analysis.
We can see a very recent sign of decoupling where ENS followed btc up from the last major dip and proceeded to form a pennant instead of following BTC back down ( Which for now BTC seems to be forming a shoddy looking megaphone pattern).
I am still on the fence as to how much i want to be contributing to this space as I have plenty of other creative endeavors / business to attend to, as someone who has been in the space for over 7 years if crypto is all consuming for you I would suggest taking a break for a while and putting some love into other areas of your life, you wont regret it!
Big love.
Rick

ENS - 4HR TF BIASRanging on the Structure lower high and lower low. (consolidation)
two scenarios on this chart.
1. create a head and shoulder pattern
2. trend breakout, retest, and a breakout to another lower high than entry for the retest.
Set your stop loss on the below structure of the support level.
Set some low expectation profits. Don't be greedy. lol
sorry for the sleepy voice.
TAYOR

ENSUSDTPossible scenario of ENS.
Keep an eye on it.
No financial advice.
Have a nice day!
🔴 Monthly
🟠 Weekly
🟡 Daily
🟢 4h
🟣 30m

ENS WEB 3.0Web 3.0 is the next best thing and ENS will have enough hype to easily hit $120. ENS looks like it finally bottomed so let’s get this money!
Double bottom patternEns trying to create double bottem pattern this is 1 day time frame and ens take a support and going to trying moon and if hi is create a big green candle this is good sign to buy

ENS - USDT 4hWeb3 projects will be pumped soon
I love the $ ENS project
I think ens marketcap could go up to $ 4 billion and the price to $ 140 or more