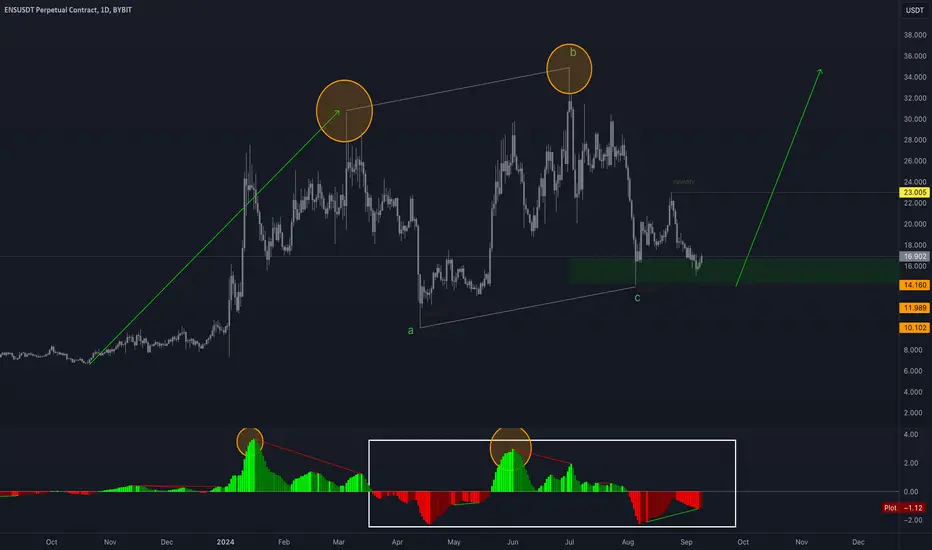
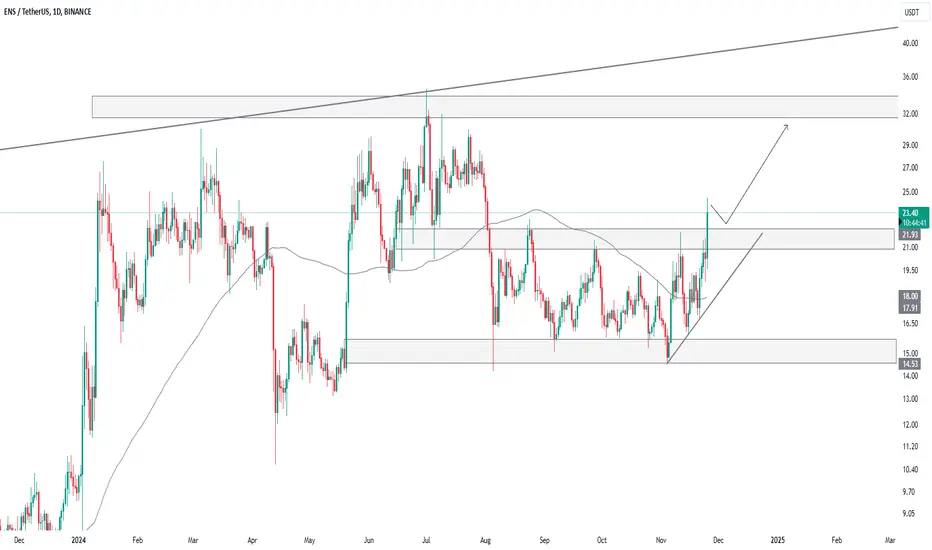
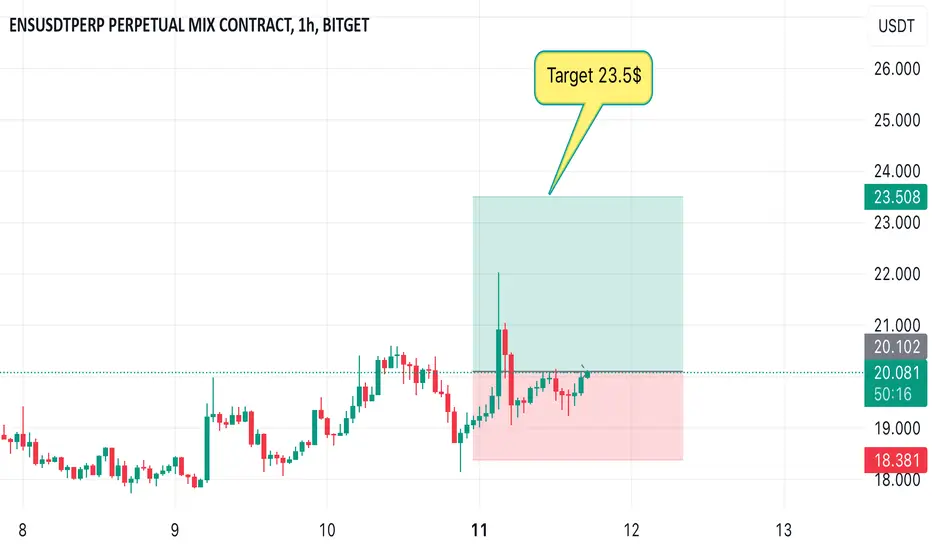
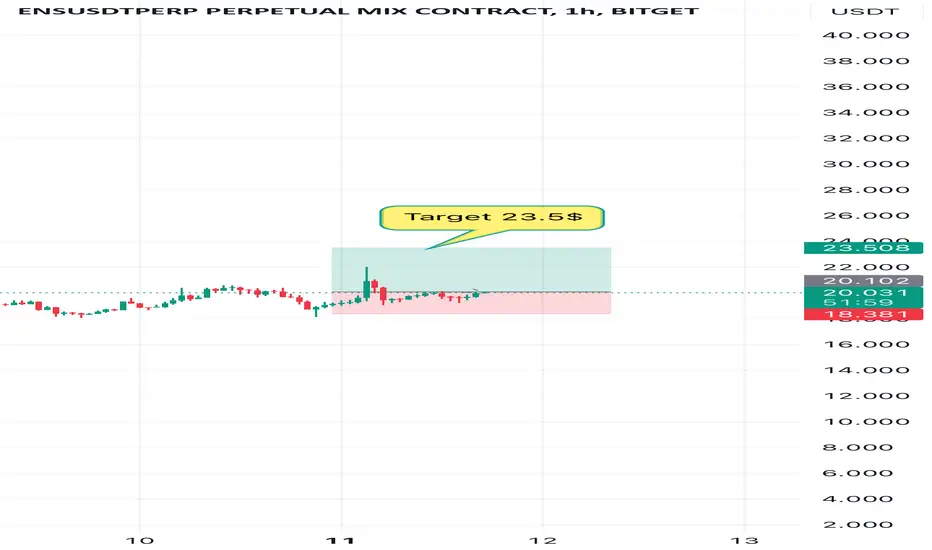
ENS showing a stunning Regular-Flat🚀 #ENS @ensdomainsis showing a stunning Regular-Flat (a,b,c) structure 😍
There’s a slight bullish divergence on the MACD between the two tops (🟠).
But on the MACD (⬜️) we can see that the correction is done.
Looking for to reach at least $23, then aiming for the top! 💸
ENSUSDT trade ideas
Here I buy Ethereum Name Service at $40Here I buy Ethereum Name Service at $40
Buy orders starting at $40 on the spot market.
And Ethereum Name Service supply shock is being triggered by me as usual.
Look at the sea horizon
He's coming to make more dollar
It's clear as water
Look at the sea horizon
The bull shark is getting closer
let the rhythm take you over

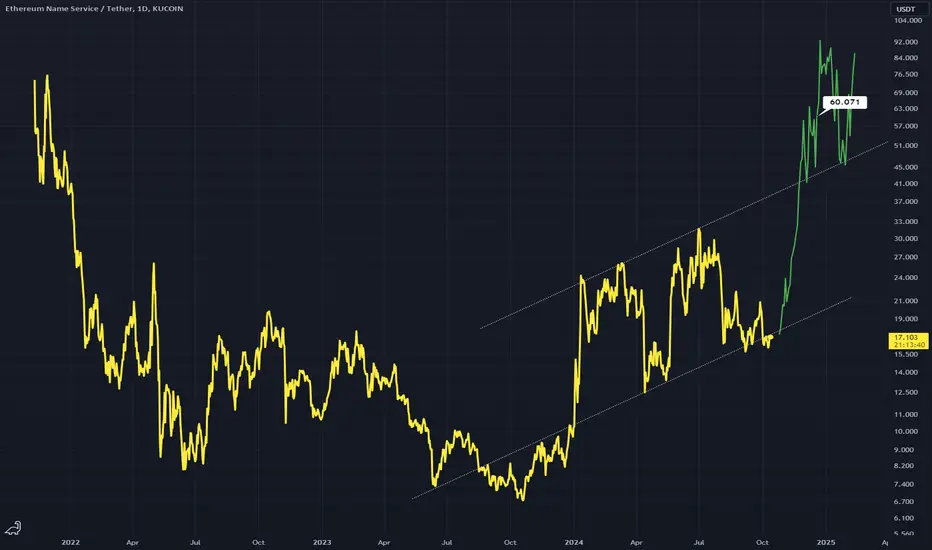
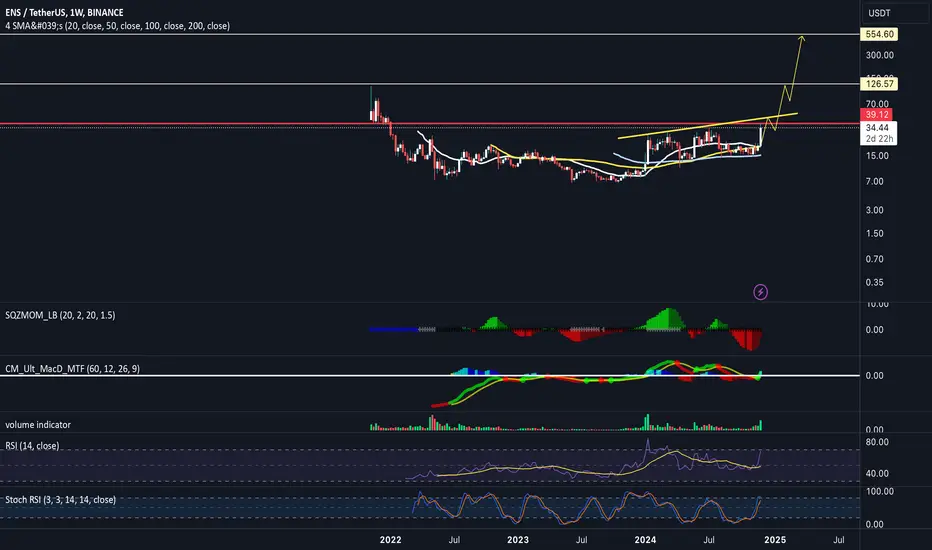
ENS/USDT- 5x -10x opportunity minimumLook at its weekly chart. A perfect opportunity for anyone to earn 500% to 1000% returns.
Ethereum Name Service ENS price needs to take a break from growtThe price of CRYPTOCAP:ETH has finally started to rise 👇
follow they're accelerating growth of the #ENS price (which has the word #Ethereum in its name)
#ENS is an Ethereum Name Service control token used to control the protocol and influence the pricing decisions of its .eth address and price oracle.
In our opinion, now it is not so much important for #ENSUSDT buyers to continue their rapid growth as it is to finally hold the price above $23.60 , which they have not been able to do by all 2024.
Only then will it be possible to continue the steady wave of growth to $80+.
_____________________
Did you like our analysis? Leave a comment, like, and follow to get more

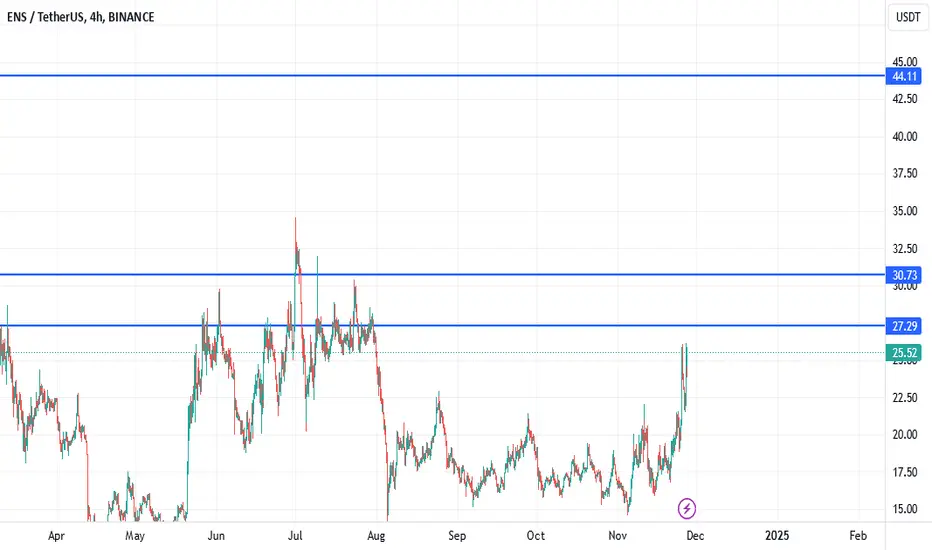
ENS will Break $30.70 as soon as possibleHello,
I thin ENS will Break $30.70 as soon as possible.
The first target will be 27.29 and the next targets will be 30.73 and 44.11.
What do you think?
Thank you
Will #ENSUSDT Explode or Collapse Soon? Key Levels to WatchYello, Paradisers! Are you prepared for what could be a massive move on #ENSUSDT? Let's discuss the latest analysis of #EthereumNameService:
💎Currently, #ENS is gaining momentum at the ascending support line, hinting at a bullish push. If the momentum holds, we might see a strong breakout above the triangle, setting the stage for a significant rally. But here's the kicker: we’re not quite there yet.
💎To confirm a genuine bullish move, we need a clear break above the triangle and the internal supply zone at $22.99. This breakout must be accompanied by solid buying pressure—think strong engulfing candles and consistent momentum. Without these signs, jumping in early could be costly. Patience is the name of the game here.
💎But what if the bullish momentum fades? If #EthereumNameService struggles to breach the triangle and the $22.99 level, it might signal waning buyer strength, inviting sellers to take control. The critical area to watch is the lower demand zone at $13.22.
💎This historically strong support level could be our last line of defense for bulls. If the price bounces from $13.22, the bullish outlook could stay intact. But—brace yourself—a break below $13.22 would invalidate the bullish setup and could trigger a sharp decline.
Stay patient and only act on the best and high probability setups.
MyCryptoParadise
iFeel the success🌴

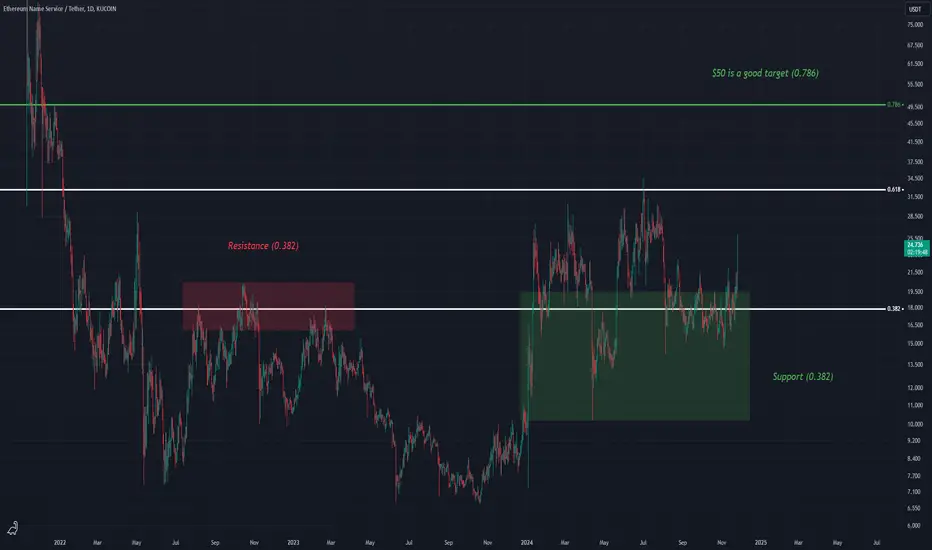
ENSUSD - Fib Resistance Turned SupportFibonacci (0.382) resistance flipped to support is allowing the upward movement on ENSUSD
Using other fibs we can use (0.786) as a target which allows it to hit $50 (in green)
ENS.USDT - 1DAfter consolidating in the 1-day timeframe
above the 22 range, it has the potential to grow to 32-33
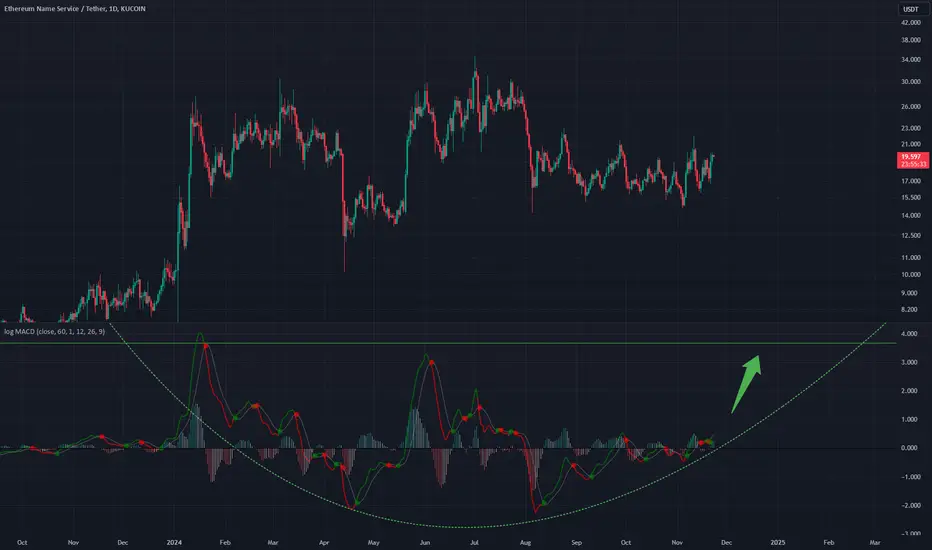
MACD W Pattern - ENSUSD A big bowl structure has formed on the daily MACD or a W pattern
The right hand side (the bull side) of the pattern is yet to be seen
Bullish on this daily timeframe
MACD analysis
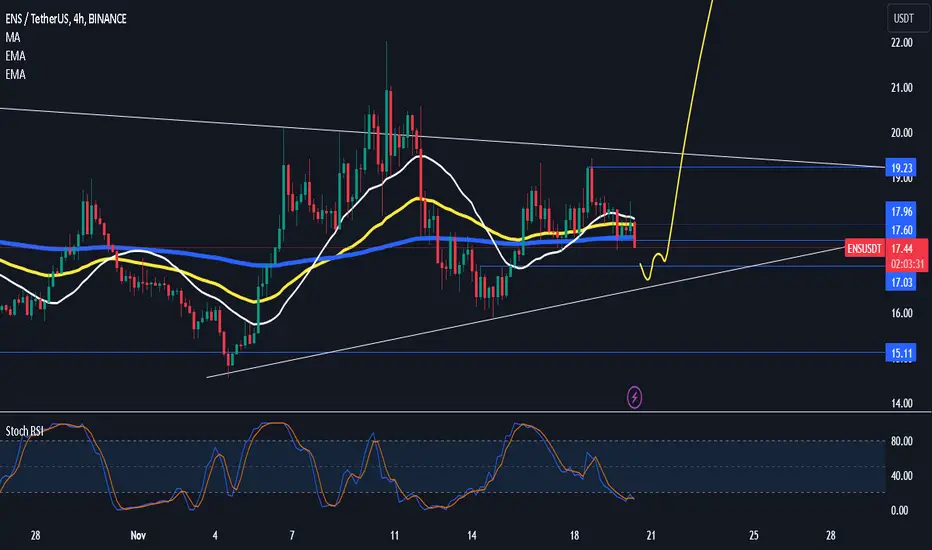
$ENSreclaim 17.60 or deviate below previous range high and pop from there
rsi seems to be bottomed out so let see what we get in another 2hrs or the 4hrs close
plan is to hold this for a while since dominance is in a reversal zone ( almost ) $42-$47 first tp
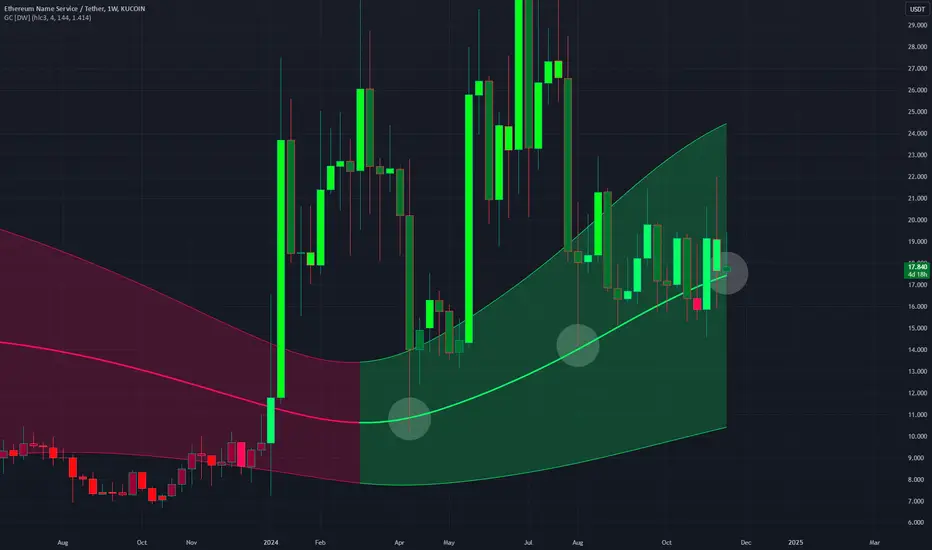
ENSUSD - Waiting for Bullish RejectionThis line on the Gaussian Channel on the Weekly timeframe shows consistent bull moves off it.
Right now it is being tested again.
I think this is going to result in a large bull move, a moonshot
Very bullish on ENS
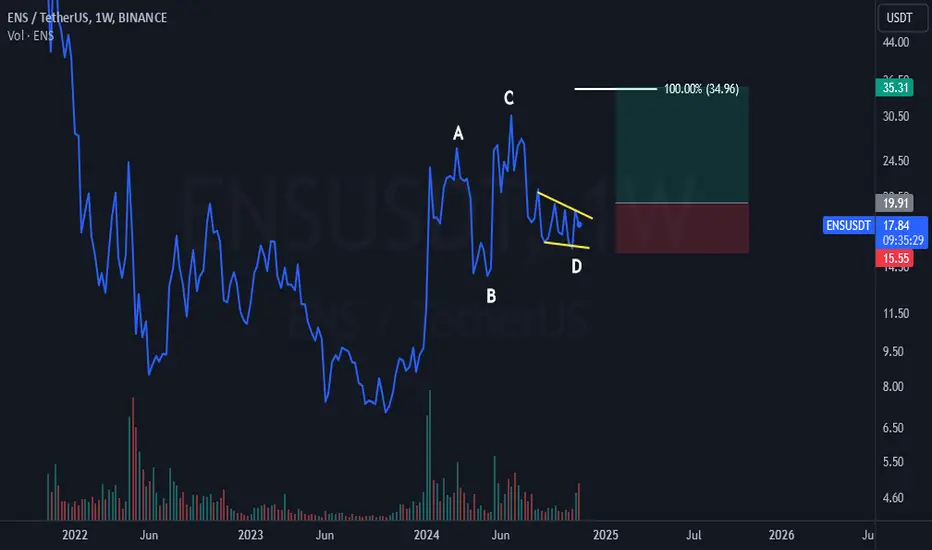
ENS USDT 1WBullish AB=CD
Ending Diagonal
We should always monitor BTC.D and USDT.D before any position
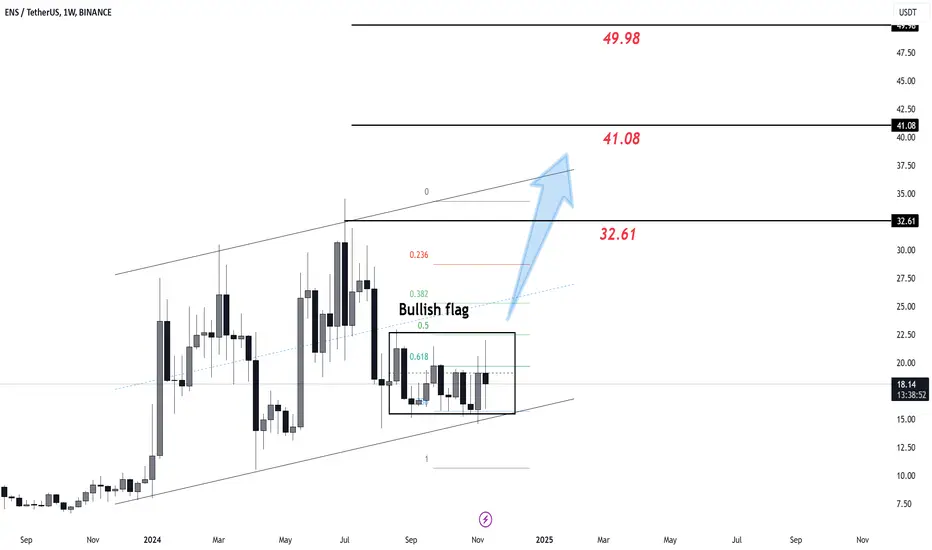
ENS Bullish flag is completed💰 #ENS
#ENS Bullish flag is completed👌
Structure is just🔥
Breakout is imminent🚀
🎯1 Target - 32$
🎯2 Target - 43$
🎯3 Target - 50$
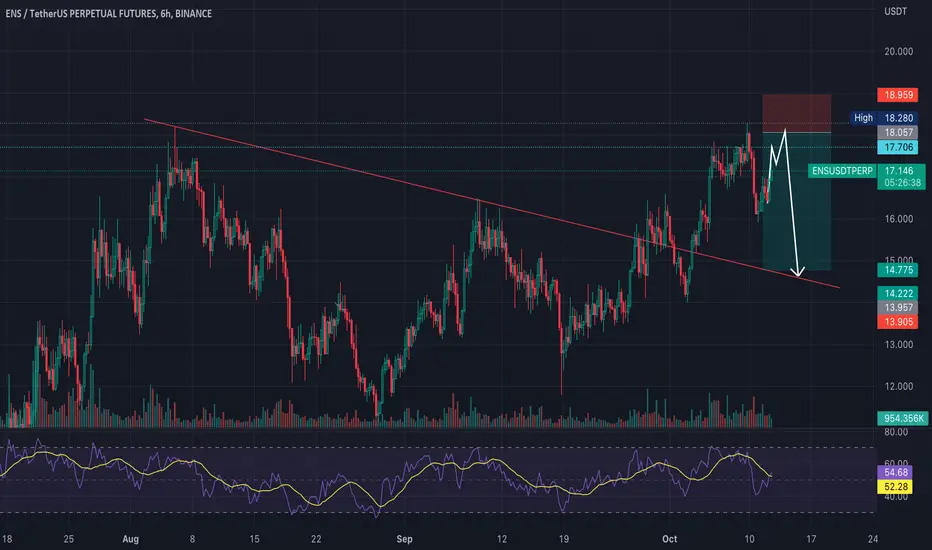
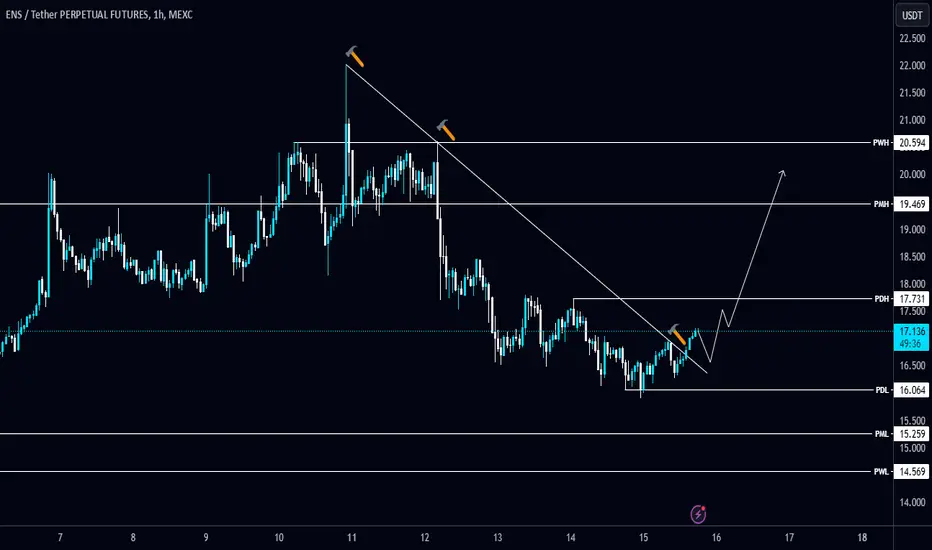
#ENS/USDT breaks the Diagonal Trendline in 1-hour TF!#ENS/USDT breaks the Diagonal Trendline in 1-hour TF!
Wait for a retest to open a Long position. NYSE:ENS 's resistance level is PMH $19.47 and the support level is PML $15.26.
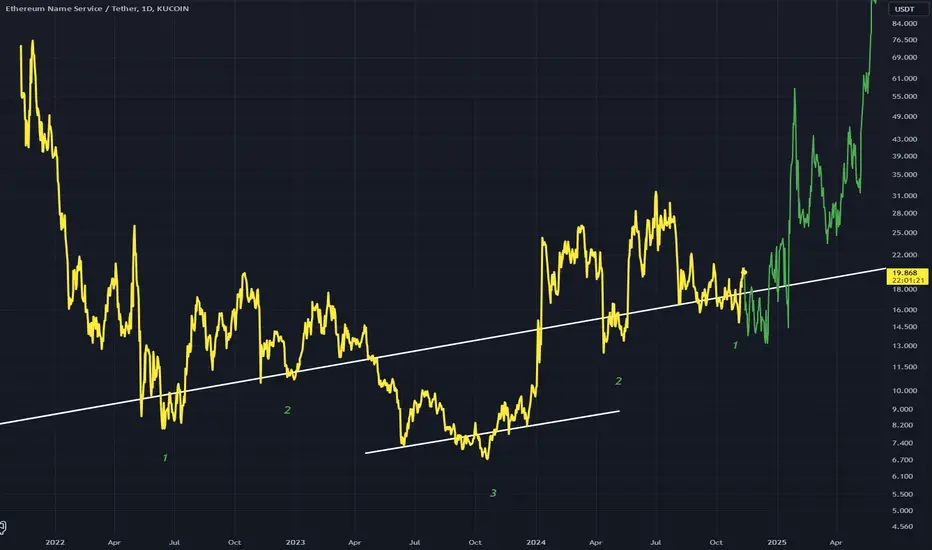
Very bullish on ENSUSDWhite trend line represent two shoulder touches (1,2) and a head breakdown at (3)
This is acting as a large inverted H&S where we are yet to experience the move up at (1) which is opposite move of the first (1) which was a downward move
Very bullish
Hopefully my reasoning can be observed
ENS/USDT trade:ENS/USDT trade:
*Market Overview*
1. *Pair*: ENS/USDT (Ethereum Name Service/USDT)
2. *Exchange*:
3. *Entry Price*: Market Price ($ )
4. *Trade Type*: Long (Buy)
5. *Timeframe*:
*Technical Analysis*
1. *Trend*: Uptrend/Neutral/Downtrend ( )
2. *Support Levels*: $ , $
3. *Resistance Levels*: $ , $
4. *Indicators*:
- RSI (14):
- MACD (12, 26):
- Moving Averages (50, 200):
1. *Candlestick Patterns*:
*Fundamental Analysis*
1. *ENS Token*: Ethereum Name Service, a decentralized domain name system
2. *Market Capitalization*: $
3. *24-Hour Trading Volume*: $
4. *Circulating Supply*:
5. *Recent Developments*:
6. *Competitor Analysis*:
*Targets and Risk Management*
1. *Target 1*: $21 ( potential gain: )
2. *Target 2*: $22 (moderate gain: )
3. *Target 3*: $23.22 (aggressive gain: )
4. *Stop Loss*: Hold (consider setting a stop loss, e.g., 5-10% below entry)
5. *Risk-Reward Ratio*:
6. *Position Sizing*:
*Market Sentiment*
1. *Fear & Greed Index*:
2. *Social Media Sentiment*:
3. *Community Support*:
4. *Influencer Opinions*:
*Recommendations*
1. Set a stop loss to limit potential losses.
2. Monitor market volatility and adjust targets.
3. Consider scaling investments.
4. Continuously evaluate market trends.
5. Reassess trade strategy based on market developments.
*Additional Resources*
1. ENS website:
2. CoinMarketCap:
3. TradingView:
4. Crypto news platforms:
To refine this analysis, please provide:
1. Timeframe
2. Exchange
3. Entry price
4. Stop loss considerations
5. Risk tolerance
Would you like me to analyze specific indicators or market sentiment?
ENS/USDT trade:ENS/USDT trade:
*Market Overview*
1. *Pair*: ENS/USDT (Ethereum Name Service/USDT)
2. *Exchange*:
3. *Entry Price*: Market Price ($ )
4. *Trade Type*: Long (Buy)
5. *Timeframe*:
*Technical Analysis*
1. *Trend*: Uptrend/Neutral/Downtrend ( )
2. *Support Levels*: $ , $
3. *Resistance Levels*: $ , $
4. *Indicators*:
- RSI (14):
- MACD (12, 26):
- Moving Averages (50, 200):
1. *Candlestick Patterns*:
*Fundamental Analysis*
1. *ENS Token*: Ethereum Name Service, a decentralized domain name system
2. *Market Capitalization*: $
3. *24-Hour Trading Volume*: $
4. *Circulating Supply*:
5. *Recent Developments*:
6. *Competitor Analysis*:
*Targets and Risk Management*
1. *Target 1*: $21 ( potential gain: )
2. *Target 2*: $22 (moderate gain: )
3. *Target 3*: $23.22 (aggressive gain: )
4. *Stop Loss*: Hold (consider setting a stop loss, e.g., 5-10% below entry)
5. *Risk-Reward Ratio*:
6. *Position Sizing*:
*Market Sentiment*
1. *Fear & Greed Index*:
2. *Social Media Sentiment*:
3. *Community Support*:
4. *Influencer Opinions*:
*Recommendations*
1. Set a stop loss to limit potential losses.
2. Monitor market volatility and adjust targets.
3. Consider scaling investments.
4. Continuously evaluate market trends.
5. Reassess trade strategy based on market developments.
*Additional Resources*
1. ENS website:
2. CoinMarketCap:
3. TradingView:
4. Crypto news platforms:
To refine this analysis, please provide:
1. Timeframe
2. Exchange
3. Entry price
4. Stop loss considerations
5. Risk tolerance
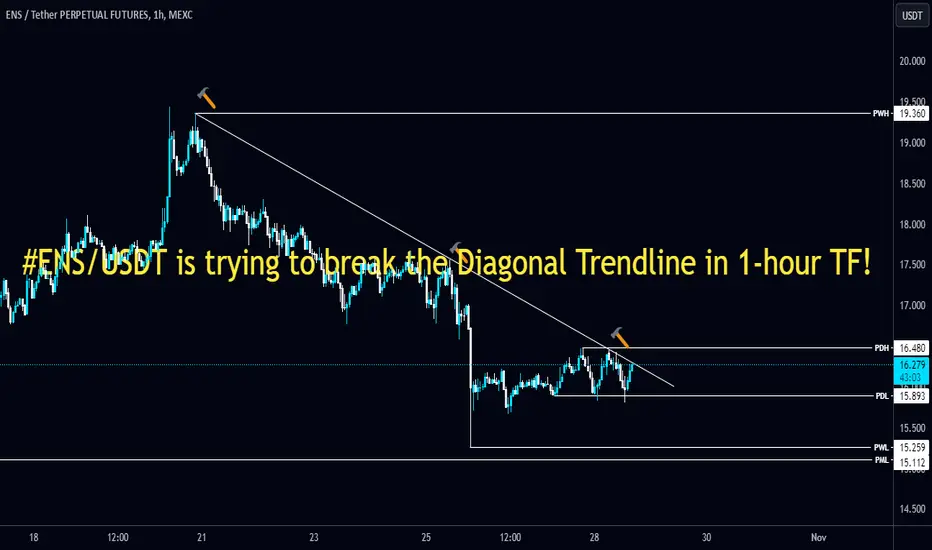
#ENS/USDT is trying to break the Diagonal Trendline in 1-hour TF#ENS/USDT is trying to break the Diagonal Trendline in 1-hour TF!
Wait for BO/retest of the Diagonal Trendline to open a Long position. NYSE:ENS 's resistance level is PWH $19.36 and the support level is PML $15.112.
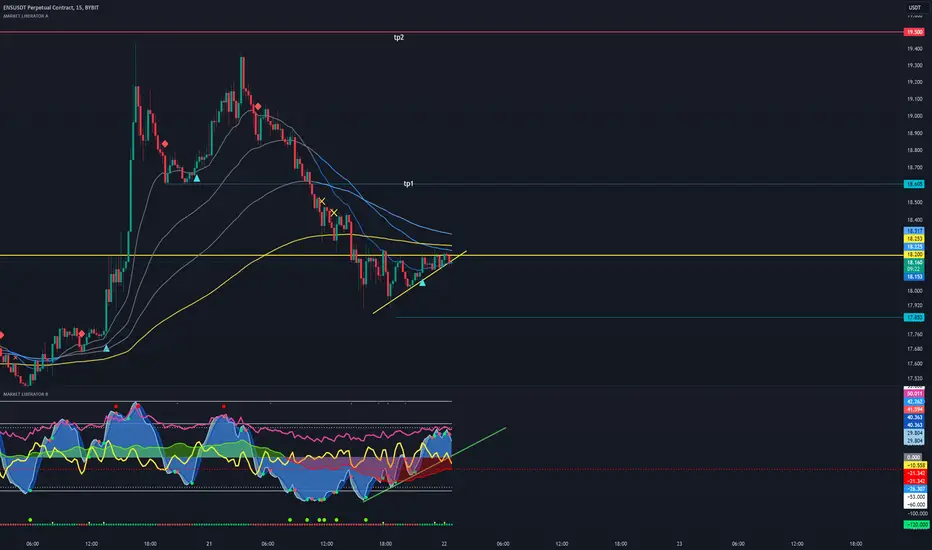
scalp idea for ENS!was looking at ens, then spotted this using marketliberator, saw the blue waves reducing in size creating trigger waves, moneyflow was coming up. upon breaking the compression between the resistance i will make a decision
Alikze »» ENS | Corner pattern formation - 4H🔍 Technical analysis: Corner pattern formation - 4H
- It is moving in a corner pattern in the 4-hour time frame.
- Due to the formation of the Double Bottom pattern, higher floors and higher ceilings have been formed in the range of 15.80.
- Therefore, it can continue its growth with pullback to the range of 17.50 to the dynamic trigger and form a newer ceiling.
- In addition, with the failure of the dynamic trigger, it can continue to grow until the supply area.
💎 Alternative scenario:
If the green box is broken sharply, it can continue its dynamic correction (origin of movement) until the bottom of the trigger.
»»»«««»»»«««»»»«««
Please support this idea with a LIKE and COMMENT if you find it useful and Click "Follow" on our profile if you'd like these trade ideas delivered straight to your email in the future.
Thanks for your continued support.
Best Regards,❤️
Alikze.
»»»«««»»»«««»»»«««
BINANCE:ENSUSDT

Long ENSUSDT to $20.86ENSUSDT has formed a falling wedge.
Potentially price could reach the target of $20.86
Pending pullback before entry as indicated.
Something like this ENSUSDTI'm still bullish on ENS and have plotted this bars pattern showing some moon thoughts
Its just a matter of when the bull move happens
Daily Chart