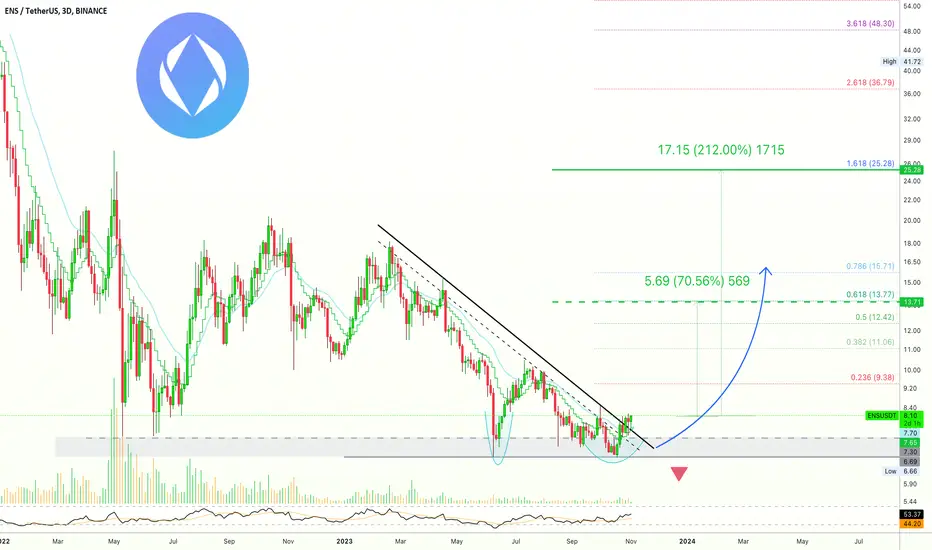
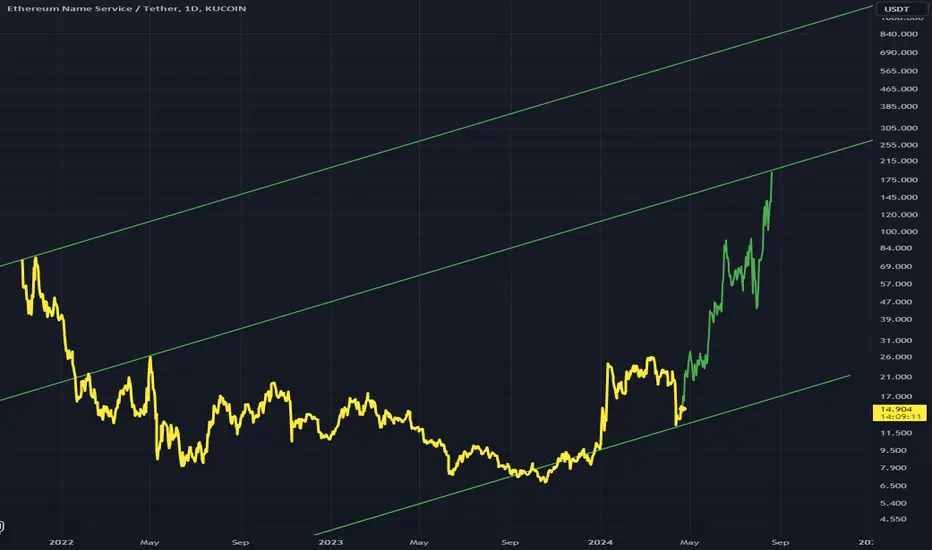
✴️ Ethereum Name Service Trade Numbers (212% Potential Profits) ➖ We have a bottom formation, Adam & Eve, developing and prices trading above the May 2022 low (grey on the chart).
➖ We have a strong RSI as prices moved recently above EMA10 and EMA21.
➖ We have a broken downtrend.
Simple signals yet very strong.
Once we hit bottom, the only place left to go is up!
------
ENTRY: $7.65 - $8.50
NEXT SUPPORT: $7.00
TP1: $11.1
TP2: $13.5
TP3: $15.7
TP4: $18.2
TP5: $21.1
TP6: $25.2
STOP: Close weekly below $6.65
-------
The numbers are shared for reference only.
Make sure to do your own research before trading.
This is not financial advice.
All the information shared here is for educational purposes only.
Thanks a lot for your continued support.
Feel free to follow if you enjoy the charts.
Namaste.
ENSUSDT trade ideas
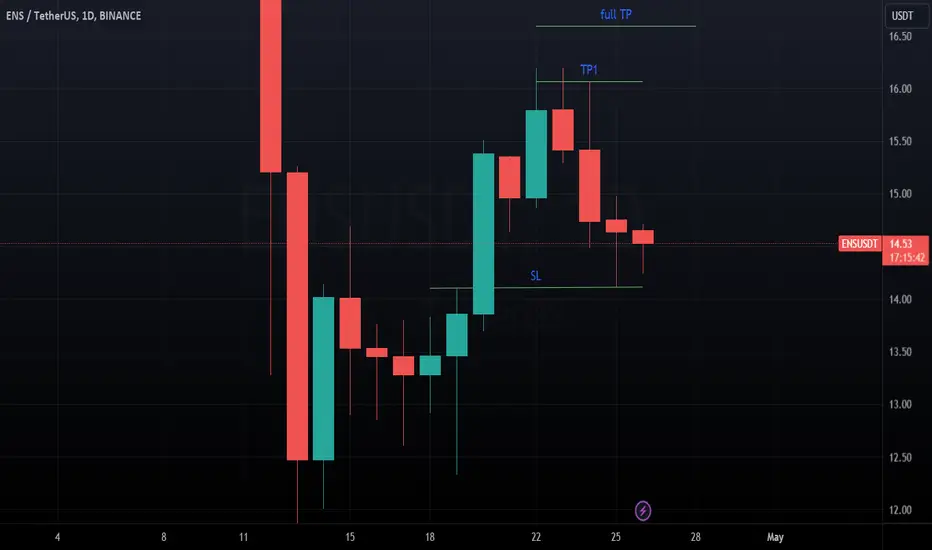
ENS LONG the whole gimmic of Fair value gap in the market cannot be understated, ENS is currently on its daily FVG zone which is the first signal for a reversal. Taking a trade here, my stops at the previous day low price and my first take profit at last 3 days candlestick high at $16 and full take profit at $16.6.
*not a financial advice
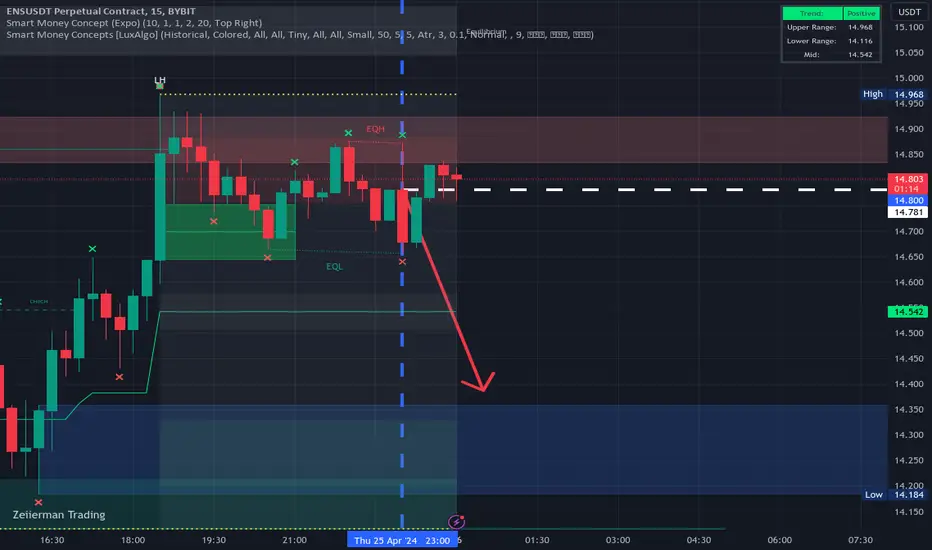
Premium Crypto idea $$$$ #ENSUSDTENSUSDT is facing resistance, indicating a potential selling opportunity for day traders. The price has failed to break above this level, suggesting a reversal may be imminent. The overbought conditions on the RSI further support the idea of a short-term price decline. Day traders may consider selling ENSUSDT to profit from this potential downside movement. It is important to set appropriate stop-loss levels to manage risk effectively.
Entry: 14.786
SL: 14.885
Target 1: 14.426
Like share and comment for more
Click the follow button
#crypto #daytrading #signal #analysis #moneymanagement
Trade God out
ENSUSDT - Bull Idea Following PullbackENSUSDT is very useful and a great coin
I am long and bullish following this pullback
The structure is kind of acting as a rounded top for a larger breakout?
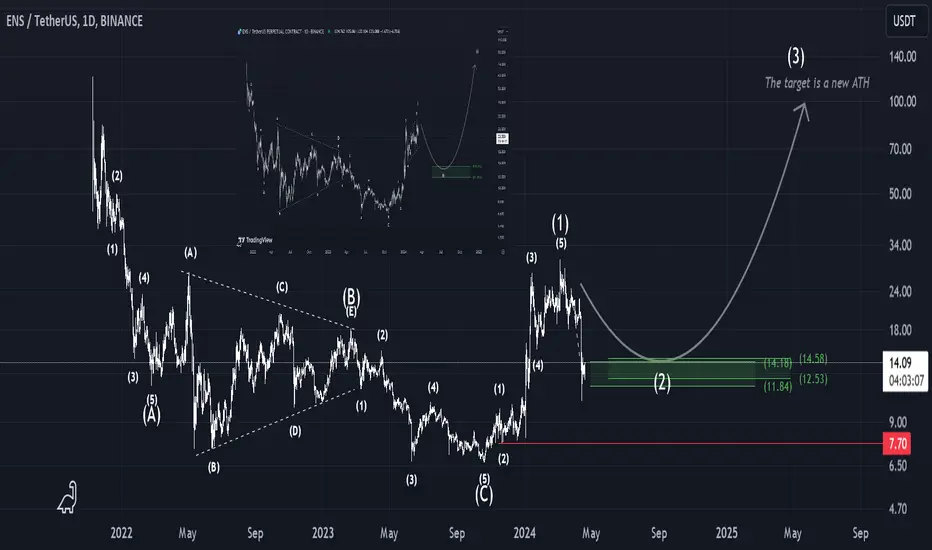
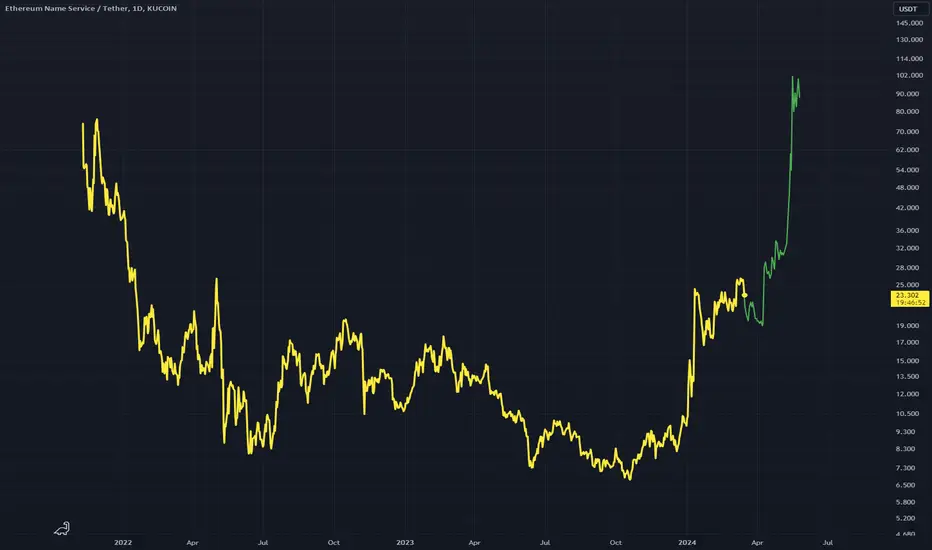
ENS Targets a New All Time HighEthereum Name Service (ENS) is a decentralized naming system on the Ethereum blockchain, converting human-readable names like john.eth into machine-readable Ethereum addresses. It also allows the reverse, associating metadata and machine-readable addresses with human-readable Ethereum names.
I believe that the macro price action on ENS targets a new all time high up to 700$
The clear stoploss that cancels the whole idea is any drop below 7.70$
#ENS
ENS Ignited: Don't Miss Out on This Buy Trade**Technical Analysis Chart Description:**
Welcome to my Technical Analysis charts on TradingView! Before we dive into the analysis, it's essential to understand some important warnings:
1. **Subjectivity Alert:** Technical analysis involves interpreting market data and chart patterns, which can be subjective. Different analysts may interpret the same data differently, leading to varied conclusions.
2. **Historical Performance Doesn't Guarantee Future Results:** Past price movements do not guarantee future price movements. While historical data can provide insights, it's crucial to consider other factors that could influence price action.
3. **Risk of False Signals:** Technical indicators and chart patterns can produce false signals, leading to potential losses if relied upon blindly. Always cross-verify signals with other indicators or fundamental analysis.
4. **Market Volatility:** Crypto markets are highly volatile and can experience rapid price fluctuations. Be prepared for sudden and unexpected price movements, which may invalidate previously identified patterns.
5. **Risk Management:** Proper risk management is essential. Never invest more than you can afford to lose, and consider using stop-loss orders to mitigate potential losses.
6. **Emotional Bias:** Avoid emotional decision-making based on short-term price movements. Stick to your trading plan and strategy, and don't let fear or greed influence your decisions.
**Disclaimer for Crypto Trading:**
Trading cryptocurrencies carries inherent risks, and it's important to understand the following:
Cryptocurrency markets are highly speculative and can be subject to extreme volatility. Prices can fluctuate significantly within short periods, leading to substantial gains or losses.
Investing in cryptocurrencies involves the risk of total loss of capital. Unlike traditional assets, cryptocurrencies are not backed by any tangible assets or central authority, making them inherently risky.
Regulatory uncertainty and market manipulation are additional risks associated with cryptocurrency trading. Regulatory changes or negative news can have a significant impact on prices.
This analysis is for informational purposes only and should not be construed as financial advice. It's crucial to conduct thorough research and consult with a qualified financial advisor before making any investment decisions in the cryptocurrency markets.
By using this analysis, you acknowledge and accept the risks associated with cryptocurrency trading and agree to trade at your own discretion. The author of this analysis shall not be held responsible for any losses incurred as a result of using the information provided.
Premium Crypto idea ENSUSDT Let me give you another great idea
entry: 12.454
SL: 11.840
Target: 13.959
Target 2: 15.023
Thanks like, share, comment
#crypto #ENSUSDT #daytrade
#weekendtrade #signal
TradeGod out

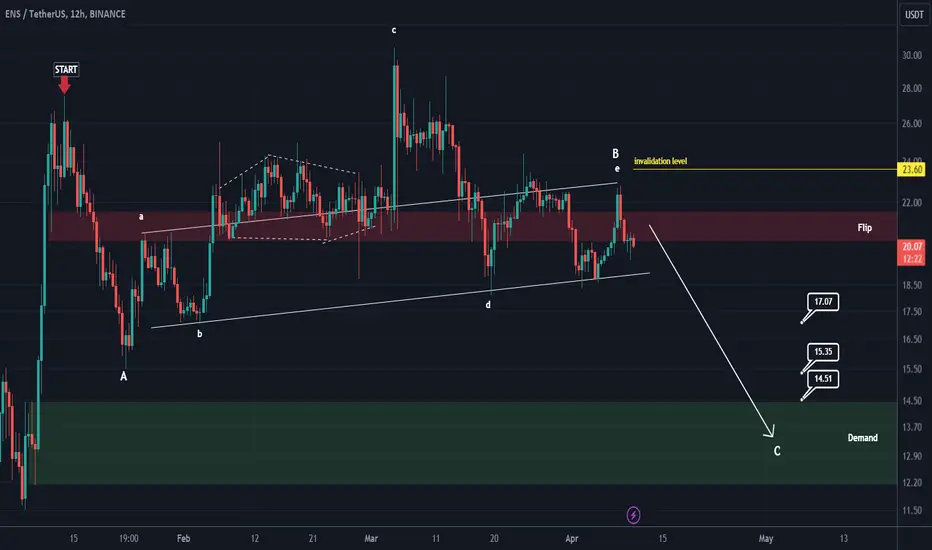
ENS looks bearish !The correction has started from where we entered "START" on the chart.
It seems that we are in an ABC or a more complicated pattern.
Now it looks like wave B, which was a triangle, is over. And we have entered bear C wave.
The targets are marked on the chart. When we reach the first target, save some profit and then change the stop to entry
Closing a daily candle below the invalidation level will violate the analysis
For risk management, please don't forget stop loss and capital management
Comment if you have any questions
Thank You
#ENS/USDT#ENS
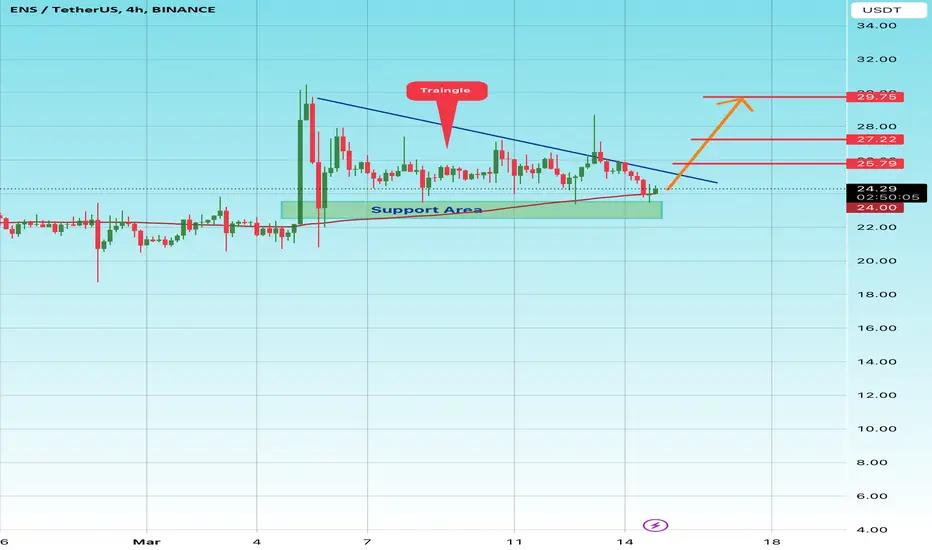
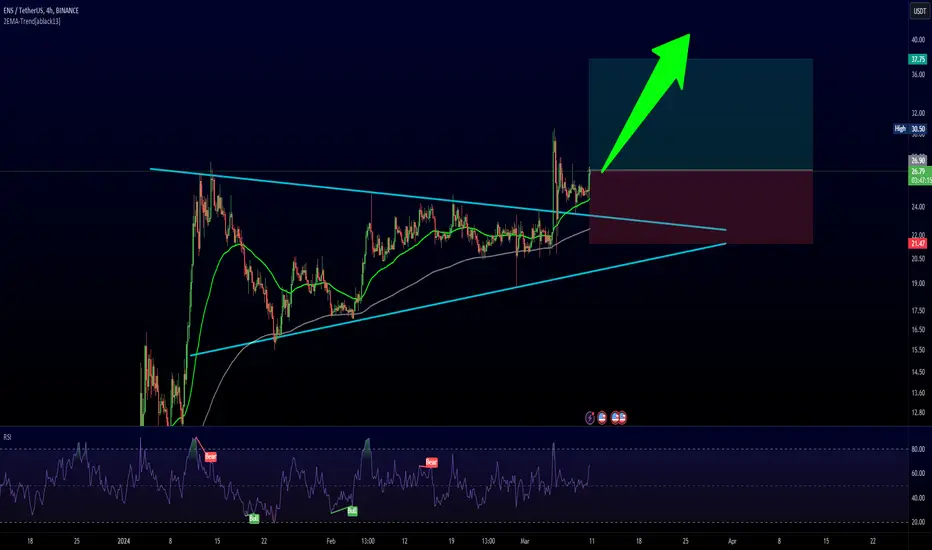
The price is moving in a triangle on a 4-hour frame and we have a green support area at level 24
We have a higher stability of 100% moving forward
Now we have a nice breakout coming up
Our RSI indicator has a trend that is about to break to the upside
Entry price is 24.41
The first goal is 25.80
The second goal 27.22
The third goal is 29.75,
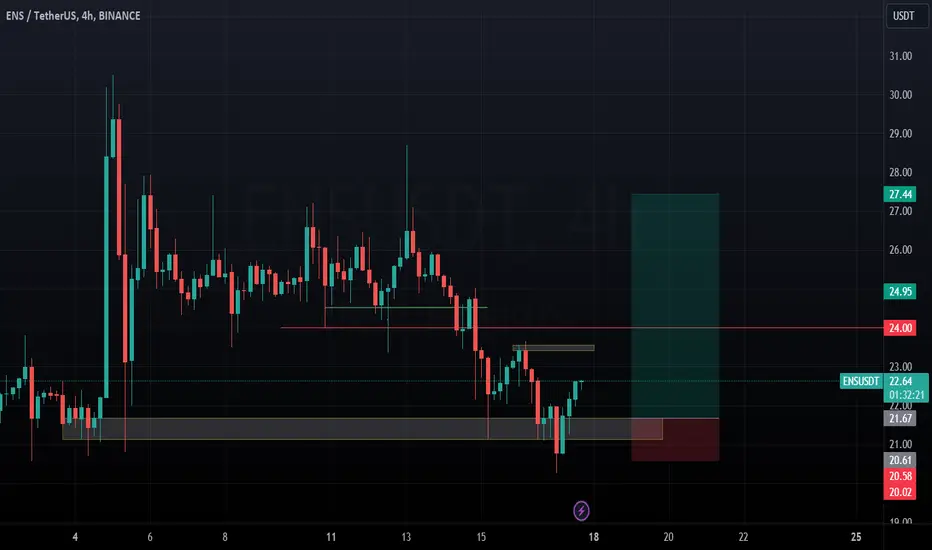
ENS/USDT Break down the support, Potential visit on Bullish OB!💎 Paradisers, #ENS has recently undergone notable market dynamics. After breaking down the support level, it has transformed into a resistance zone.
💎 If #ENS fails to reclaim the price above this resistance, there's potential for further downward movement, with the next likely target being the Bullish OB area.
💎 However, if #ENS successfully reclaims and breaks out above the resistance level once more, there's potential for the price to revisit the key resistance area. A subsequent breakout above this level could pave the way for a move toward our target at the Bearish OB and supply zones.

ENS Sailing the Crypto Seas: A Strong Buy Signal Beckons!Ethereum Name Service (ENS) Coin: The Basics
What is it?
ENS is the governance token of the Ethereum Name Service, a system that translates long, complex Ethereum addresses into human-readable domain names (like "yourname.eth"). This makes interacting with the Ethereum blockchain easier and more user-friendly.
Token Utility:
Governance: ENS token holders can vote on proposals that affect the ENS protocol, such as setting fees for registering .eth domains.
Staking: While not currently implemented, staking ENS tokens may grant holders additional benefits in the future.
Recent News:
There haven't been any major news headlines about ENS specifically, but the broader cryptocurrency market has seen some volatility recently.
Disclaimer:
I am not a financial advisor and this is not financial advice. Investing in cryptocurrency involves a high degree of risk. Do your own research before making any investment decisions.
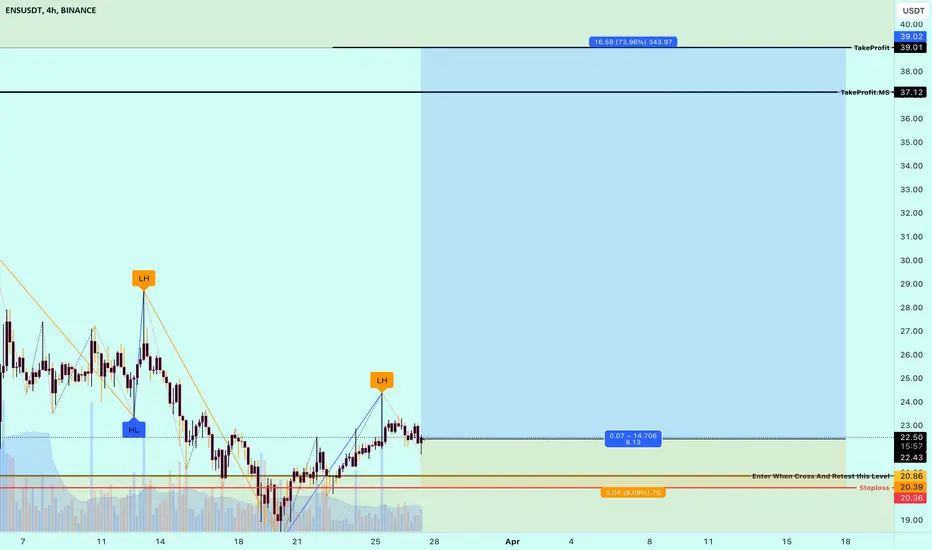
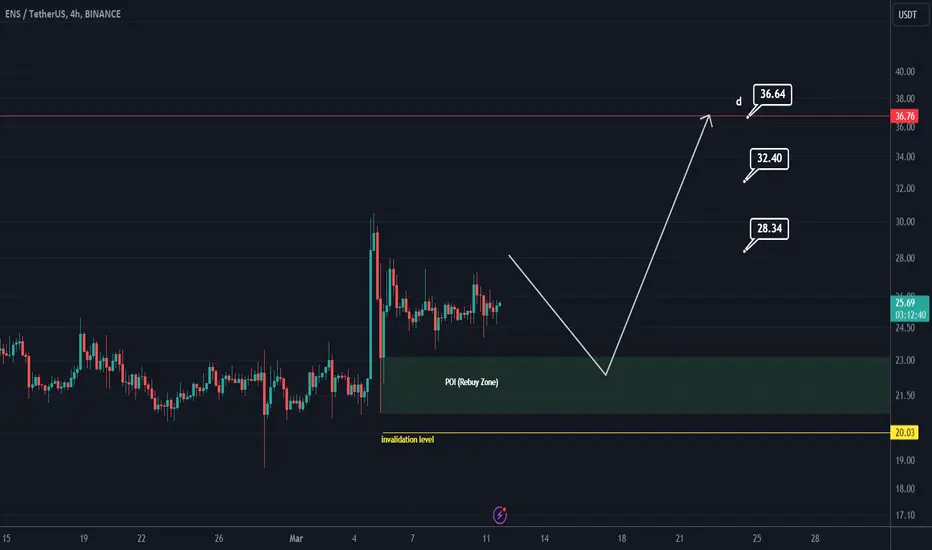
ENS LONG The previous accumulation ranged between $20.3 (low) - $24 (high), 8th Feb - 16th. we had a breakout to the up side to $30 price mark that gives signal of more upward price movements. Today, we have a chance to buy at a cheap price at $22.6. My stops will be at the previous range low at $20.3, First take profit at $24, Second take profit at $30. Futures traders should be more frugal with their stops and not over leverage.
PS: not a Financial advice
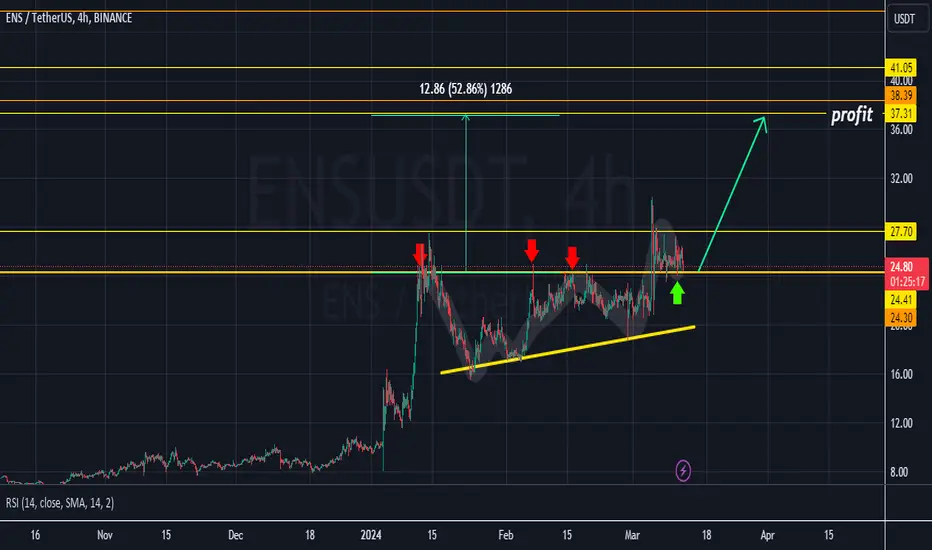
Get support ENS ENS It got support from 24.41-24.30 level
After attempts that started from January 11, 2024, the price stabilized above it
the goal
Level 37.31
ENS/USDT Primed for a Bullish Journey? 👀🚀ENS Analysis💎 Paradisers, let's focus on #ENSUSDT, as it's currently showcasing a pattern that hints at a potent bullish swing from its demand zone.
💎 Observing #EthereumNameService recent market behavior, we noted a significant 46% drop following a rejection at a major supply level. Despite this, it's shown resilience at the $14.90 demand level, hinting at an upward trajectory.
💎 However, with the price struggling to set new highs or break past previous ones, short-term market sentiment leans towards selling. Yet, the $14.90 mark stands out as a crucial juncture, likely to trigger another strong bullish response upon retesting.
💎 As seasoned traders, we're always thinking one step ahead. If NYSE:ENS doesn't kick off the expected climb from the $14.90 demand level and instead breaks below, we're ready to pivot our strategy. We'd then anticipate a bullish bounce from a lower demand level at $11.72, keeping in mind that falling below this level could lead to further declines.

ENS Breakout: A Symmetrical Signal for Bullish EntryBINANCE:ENSUSDT presents a classic bullish technical setup, captured here in a symmetrical triangle pattern nearing completion. This pattern is noteworthy as it often forecasts a continuation of the prevailing trend, which, given the prior uptrend, suggests a strong potential for upward momentum. Such formations are watched closely by traders for a confirmed breakout, signaling a robust entry point for a long position. The Setup highlights the confluence of technical indicators pointing towards a high-probability trading opportunity for a LONG entry.
Bullish Setup:
Symmetrical Triangle: Price is consolidating within a symmetrical triangle, suggesting indecision but often leads to a continuation of the prior trend, which is bullish in this case.
Breakout: A recent breakout above the upper trendline of the triangle may indicate the continuation of the bullish trend. Perfect retest happened and Bullish uptrend is continuing.
RSI: The Relative Strength Index is neutral, suggesting there is room for upward price movement without being overextended.
Reasons to Consider a Long Position:
Pattern Recognition: Symmetrical triangle near completion, with a breakout and a retest to the upside.
Trend Continuation: Prior uptrend preceding the triangle and the retest suggests a higher probability of upward Trend.
Price Target: The height of the triangle’s base added to the breakout point provides a potential price target.
Trade Execution:
Entry Point: Upon a confirmed breakout with high volume.
Stop Loss: Just below the lower trendline of the triangle to minimize potential loss.
Profit Target: Based on the height of the triangle extrapolated from the breakout point.
This trade setup offers a strategic entry with the breakout from the symmetrical triangle, indicating bullish sentiment. It presents a favorable risk-to-reward ratio with well-defined entry and exit points. As with any trade, it’s crucial to consider broader market sentiment and confirm the pattern with volume, and it's advisable to manage risk through stop-loss orders and to secure profits methodically.
Good Luck
ENSUSDT - Another Move UpI expect ENSUSD to keep acting bullishly with another major move up to complete this up movement.
I have used price action from another coin BTTCUSD which show structural similarities but with BTTCUSD leading, also using the Gaussian Channel indicator which is a great one.
I'm really bullish on ENS. Great use case.
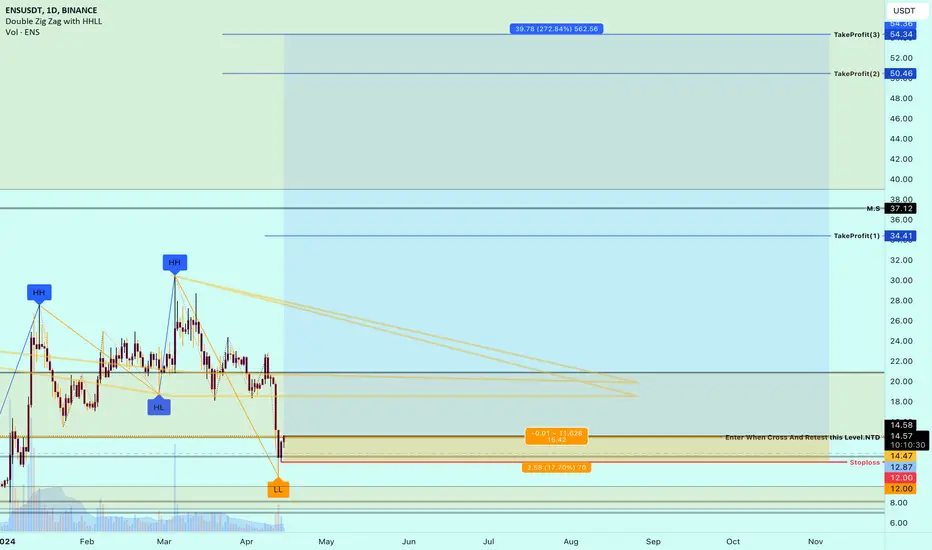
ENSUSDT Triangle Breakout and 90% Growth PotentialExciting news on the charts for ENSUSDT!
So, after what feels like ages, we finally saw ENSUSDT break free from its year-long downtrend trendline. Price then went on to form a Symmetrical Triangle pattern, and at the start of this month, we witnessed the breakout above the triangle, accompanied by a brand-new higher high.
Now, what does all this mean? Well, it's screaming bullish vibes! The persistent bullish pressure we're seeing strongly hints at an ongoing uptrend. And if we take a look at the initial upside move, we can make a pretty educated guess about what comes next.
Based on the strength of the first wave, it's entirely possible that our next upside target could hit around $44. It conveniently lines up with the 161.8% Fibonacci retracement level.
It looks like we're in for quite the ride with ENSUSDT!

Short and Mid Term Analysis for ENSUSDTIf the price breaks through the red box, targets such as $38 in the short term, $58 & $65 in the mid-term will be on the agenda.
I am hopeful for this pair as long as the green box continues to act as support.

ENS buy setupThere is a good range for ENS that has a chance to reject the price to the upside.
If the price reaches the green range, we will enter the buy/long position.
The targets are marked on the chart.
Closing a daily candle below the invalidation level will violate the analysis
For risk management, please don't forget stop loss and capital management
When we reach the first target, save some profit and then change the stop to entry
Comment if you have any questions
Thank You
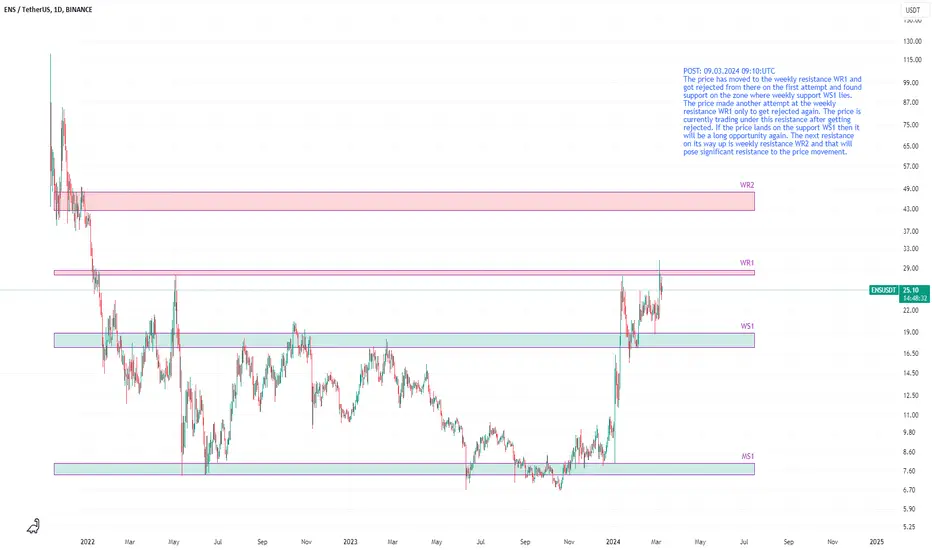
ENSUSDT at weekly resistance, likely to land on weekly supportThe price has moved to the weekly resistance WR1 and got rejected from there on the first attempt and found support on the zone where weekly support WS1 lies. The price made another attempt at the weekly resistance WR1 only to get rejected again. The price is currently trading under this resistance after getting rejected. If the price lands on the support WS1 then it will be a long opportunity again. The next resistance on its way up is weekly resistance WR2 and that will pose significant resistance to the price movement.
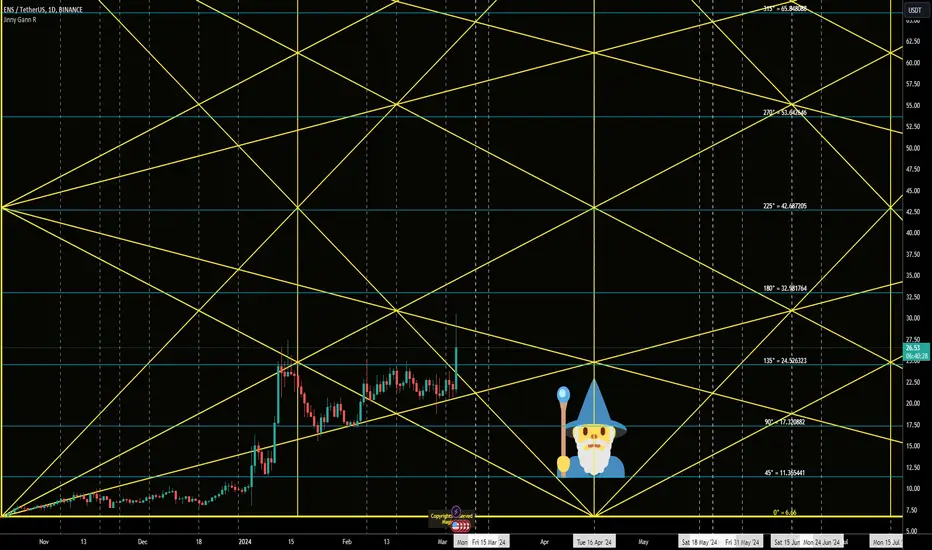
ENS Next Bull RUN?Hello Dear Traders,.
Back from Last luna Long..
Is this the next ?
ENS Reversal dates on chart
Expected Cycle top @ 79
But 53 Is @ Important Level.
horizontal lines are Support/Resistance .
Vertical lines are time pivots .
The most accurate Gann tools here.
Jinny Gann
Appreciate your Comments.
GL
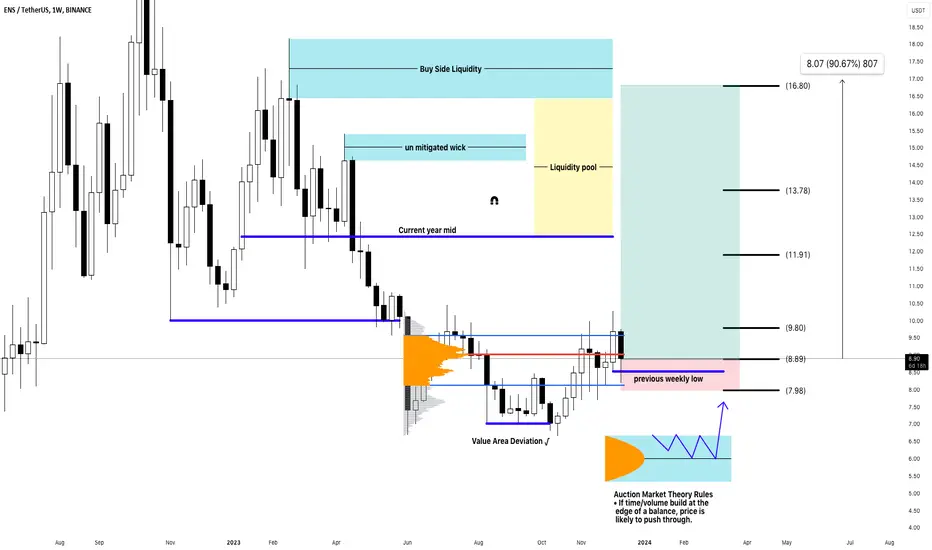
ENS/USDTWarning Technical analysis is not financial advice
BINANCE:ENSUSDT give my trading system sign of strength
1-taken previous weekly low This is the fuel point to move
2- Value area has been deviation deviation as failure swing point
3- successful auction after ranging and previous weekly low
4- Auction Market Theory Rules
• If time/volume build at the
edge of a balance, price is
likely to push through.
5- the liquidity is resting on the opposite side
-current year mid as a liquidity must be taken like a magnet
- Liquidity pools as un mitigated wicks
➖
📈COIN : BINANCE:ENSUSDT
CEX. : BINANCE - SPOT
➖
ENTRY :8.89
➖
TARGETS :
T1 : 9.80 (1/1R)
T2 : 11.91
T3 : 13.78
Long term T4
➖
STOP :7.98
➖
💡HINTS:
1️⃣ • Sell (25% to 50%) on (T1) and don't move your stop lose
2️⃣ • Sell 50% on (T2) and move ur stop lose to entry point
3️⃣ • You are safe now and the next 25% up to you
4️⃣ • Very important: stop lose = jump from ship and keep alive
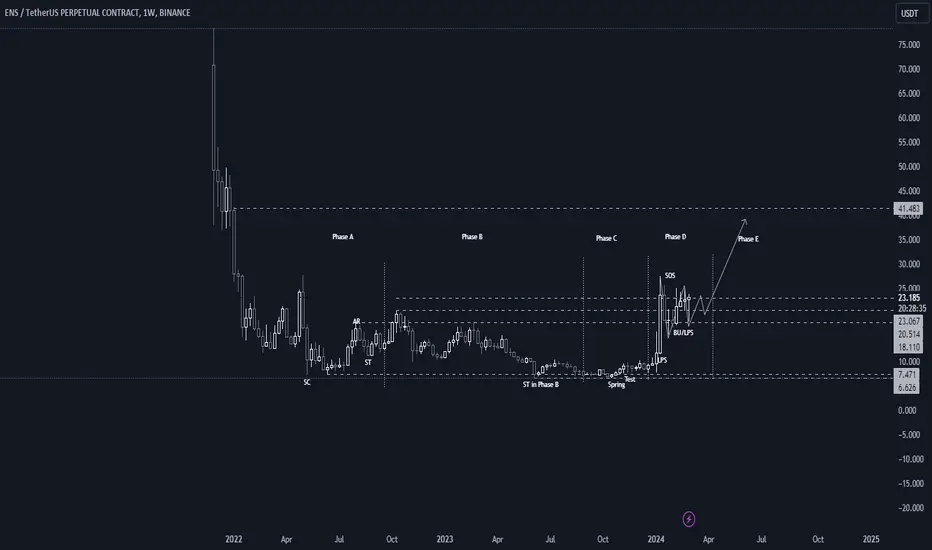
ENS Wyckoff AccumulationOnly a newbie trying to learn on how Wyckoff Accumulation and it seems like ENS bout to enter Phase E which can claim 45$ if it bust through the final resistance. #dyor #nfa