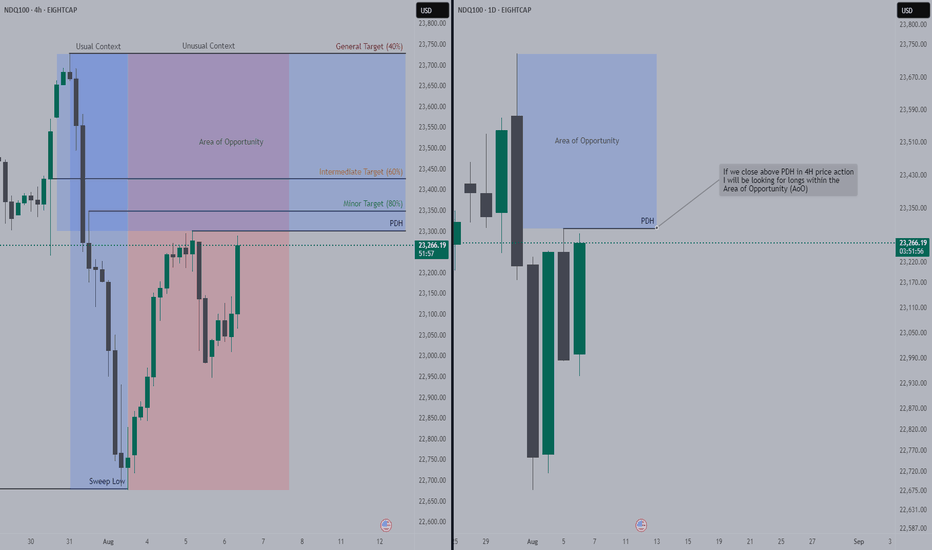
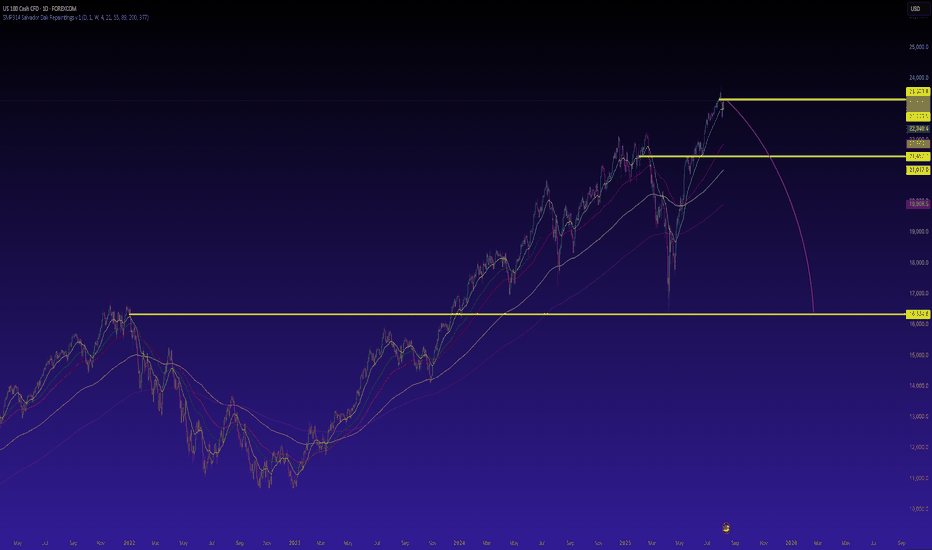
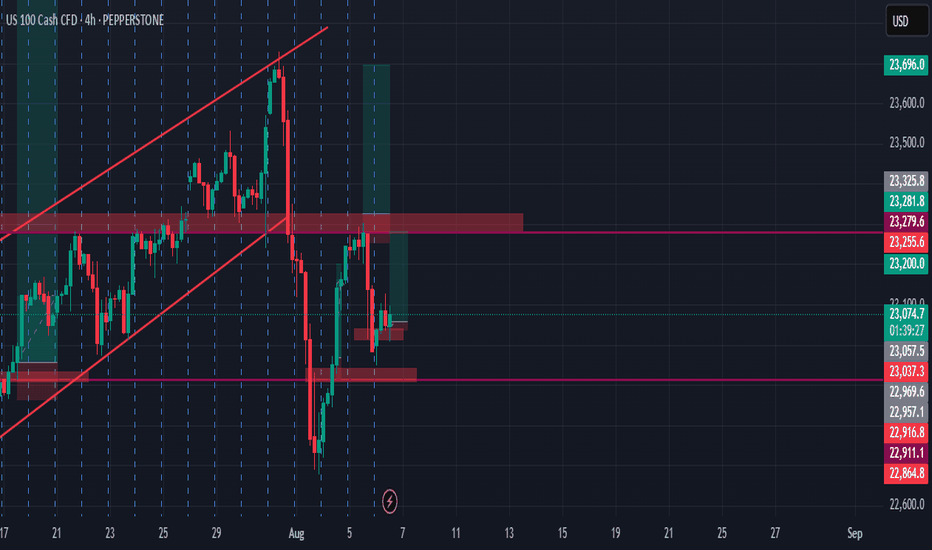
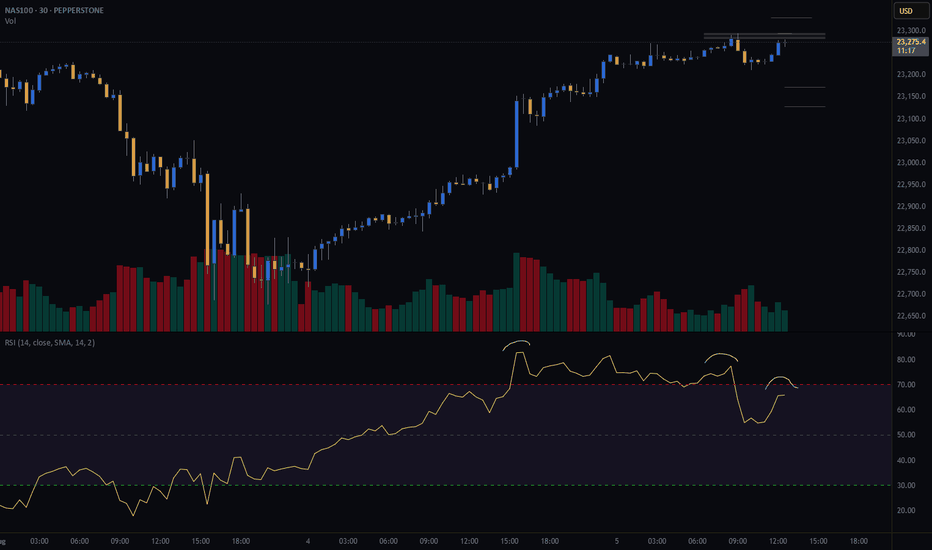
US100 trade ideas
Behold the grand NAS100 short expeditionBehold the grand NAS100 short expedition, unleashed by my top-secret pyramidal formula (concealed in golden tombs and guarded by laser-eyed sphinxes):
Pharaoh’s Pivot Points
– We superimpose recent NAS100 peaks onto the Great Pyramid’s four secret chambers. When price breaches the “Upper Antechamber Zone” near 23,300, the ibis-headed guardian squawks—our signal to draw the short sword.
Oracular Sphinx Sentiment
– We feed Fed minutes hieroglyphs and mega-cap earnings scrolls into the Sphinx’s riddle engine. If the answer murmurs “overheating” or “tech fatigue,” it confirms our bearish quest.
Ra’s Wall-Street Candle Filter
– Only candles closing between 09:30–16:00 ET count as true “New York sun-blessed bars.” Any rogue moves in the witching hour? Mirage dust—ignored.
Anubis’ Volume Veil
– Volume spikes are weighed in pharaoh-ounces of pure gold. When daily turnover eclipses 30,000 pharaoh-ounces, the Underworld Flush ritual begins—time to tighten our longs… er, shorts.
Tomb-Run Trend Confirmation
– Trendlines aren’t drawn from ordinary swing highs; we connect the three sacred glyph-points carved into the sarcophagus walls. Once that “Tomb-Run Downtrend” appears, we descend into the dark.
NSDQ100 Pre US Open Key Trading levelsTrade Policy & Tariff Risks:
Donald Trump escalated trade rhetoric, signaling higher tariffs on countries importing Russian energy, and previewing new tariffs on semiconductors and pharmaceuticals within days. This raises geopolitical and supply chain uncertainty—key risks for NSDQ 100 tech and healthcare stocks, particularly chipmakers, drug manufacturers, and firms exposed to global trade.
Swiss Tariff Dispute:
Swiss President Keller-Sutter is in Washington seeking to lower a newly imposed 39% tariff—highlighting the broader unpredictability of US trade actions, which could fuel market volatility and weigh on investor sentiment.
Ukraine Conflict & Sanctions Outlook:
As the US pushes toward an Aug. 8 deadline to resolve the Ukraine conflict, Trump's envoy is in Moscow. Potential Kremlin concessions (e.g., halting airstrikes) may reduce geopolitical risk premiums, especially for defense, energy, and global consumer tech firms.
Federal Reserve & Rate Policy:
With Fed Governor Kugler resigning, Trump is expected to name a replacement this week. His ongoing pressure on the Fed to cut rates adds policy uncertainty. This could support rate-sensitive NSDQ stocks in the near term, especially growth names in tech, if dovish expectations build.
Takeaway for NSDQ100 Traders:
Expect increased volatility around tariff news, Fed appointments, and geopolitical headlines. Traders should watch for:
Semiconductor stocks (e.g., NVDA, AMD, INTC) under pressure from tariff threats.
Big tech and biotech swings tied to pharma trade policy.
Potential relief rallies if Russia concessions materialize or Fed commentary turns dovish.
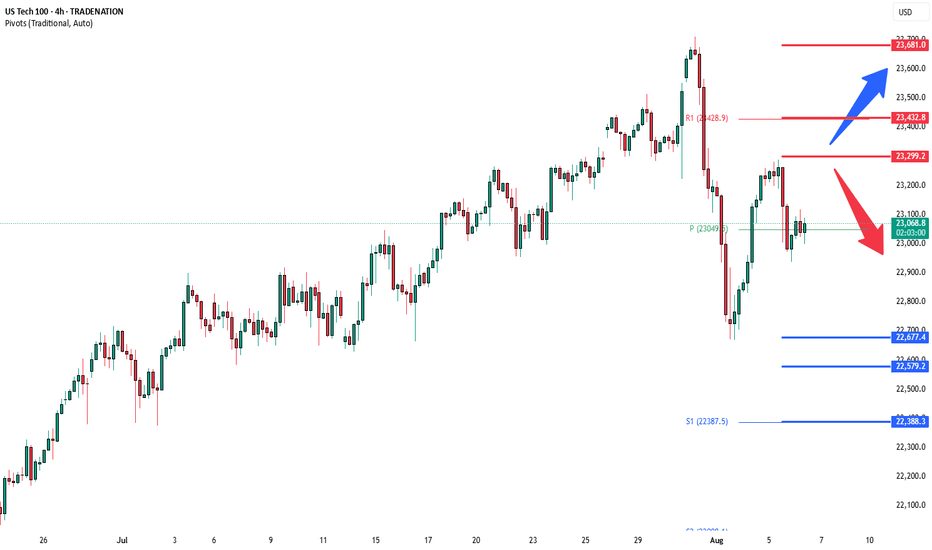
Key Support and Resistance Levels
Resistance Level 1: 23300
Resistance Level 2: 22430
Resistance Level 3: 23680
Support Level 1: 22677
Support Level 2: 22580
Support Level 3: 22388
This communication is for informational purposes only and should not be viewed as any form of recommendation as to a particular course of action or as investment advice. It is not intended as an offer or solicitation for the purchase or sale of any financial instrument or as an official confirmation of any transaction. Opinions, estimates and assumptions expressed herein are made as of the date of this communication and are subject to change without notice. This communication has been prepared based upon information, including market prices, data and other information, believed to be reliable; however, Trade Nation does not warrant its completeness or accuracy. All market prices and market data contained in or attached to this communication are indicative and subject to change without notice.
US indices paused as fragile macro data undermined recent gains
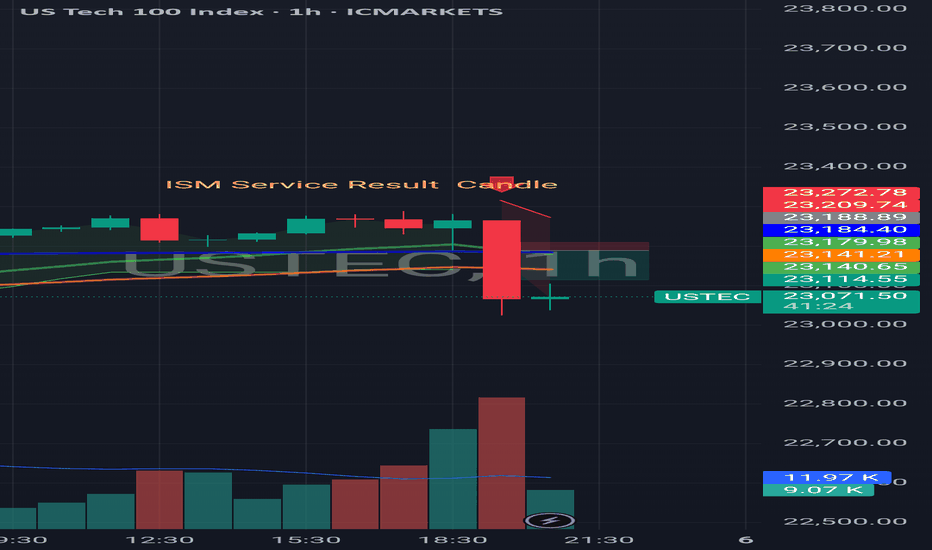
US equity gains paused amid President Trump’s renewed tariff threats and weakening economic data. Trump warned of steep tariff hikes on India and a potential 35% levy on the EU if obligations are not met. Meanwhile, the US July Services PMI fell from 50.8 to 50.1, missing the 51.5 consensus. New orders dropped to 50.3, while employment declined to 46.4—the lowest since March.
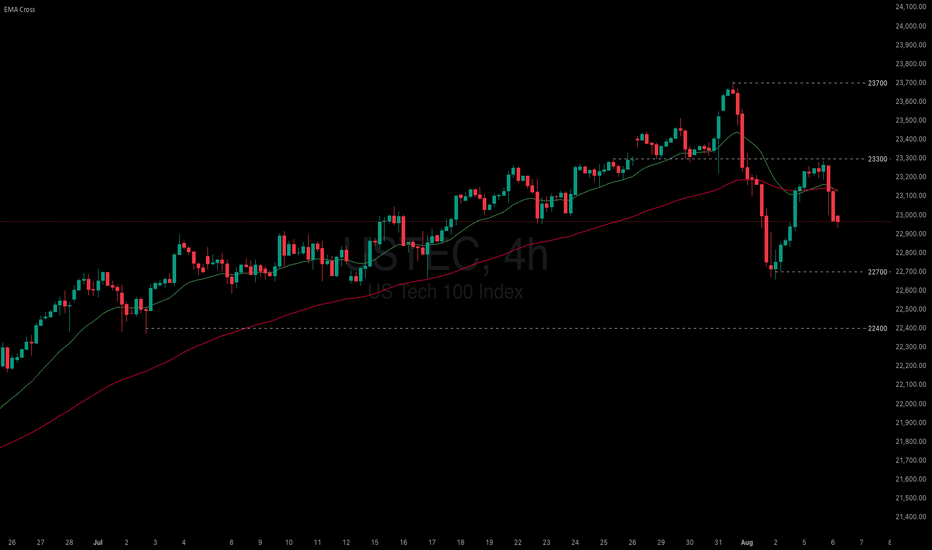
USTEC briefly tested 23300 before breaking below both EMAs. The widening gap between EMA21 and EMA78 suggests a potential shift toward bearish momentum. If USTEC fails to break above the resistance at 23300, the index could decline further toward 22700. Conversely, if USTEC breaks above both EMAs and 23300, the index may gain bullish traction toward 23700.
NAS100 (CASH100) Short - Double top 30minThe 15min head and shoulders setup got invalidated.
However, my double top variables are currently being met.
Still need confirmation before entering trade.
Risk/reward = 2.7
Entry price = 23 284
Stop loss price = 23 331
Take profit level 1 (50%) = 23 173
Take profit level 2 (50%) = 23 129
What does everyone thing the NASDAQ is going to do today?
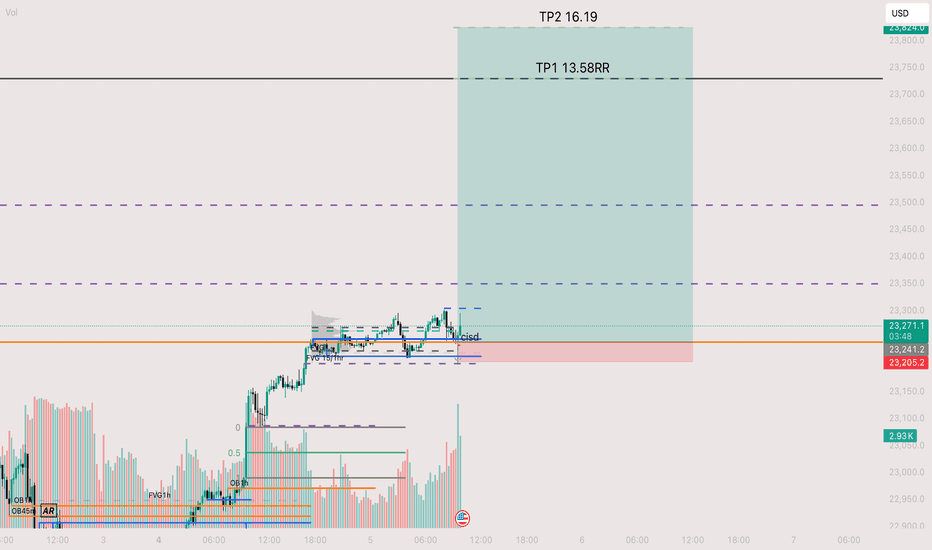
Long entry ON 1min off of daily bullish retracemen going into exMy overall bias is bullish and on the daily price was retracing into a high volume node which I then zoom into the 1min to find an entry. that entry was in a smaller time frame palace zone which price purge and heading upwards. Final TP is at 16.18rr due to me be trying to pass a phase in a prop firm. The real tp is like 40rr if I wasn't doing a challange
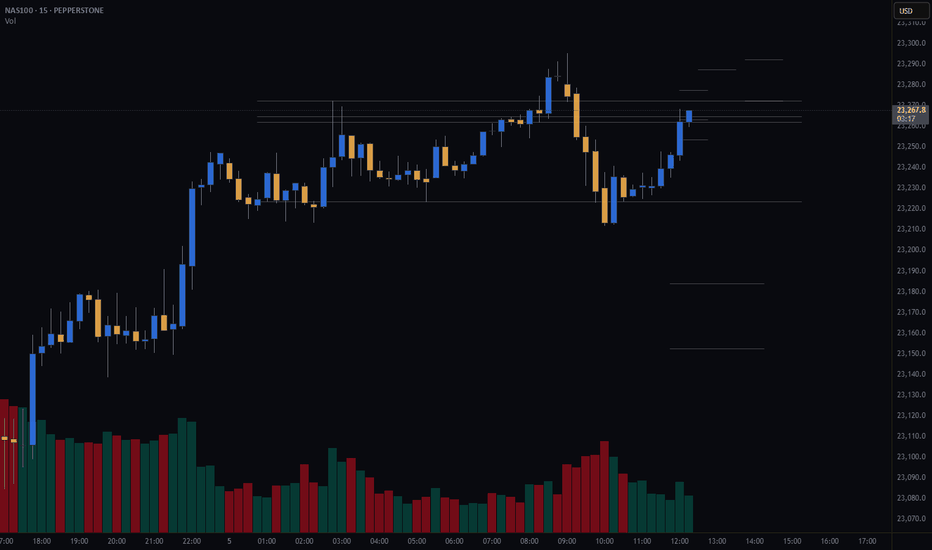
NASDAQ (CASH100) SHORT - head and shoulders 15minPotential short on nas100 (cash100) with head and shoulders on the 15min.
Still waiting for confirmation on some of my variables before I enter.
Risk/reward = 3.3
Entry price = 23 262
Stop loss price = 23 287.3
Take profit level 1 (50%) = 23 184
Take profit level 2 (50%) = 23 153
What do you guys and girls think the nasdaq is going to do?
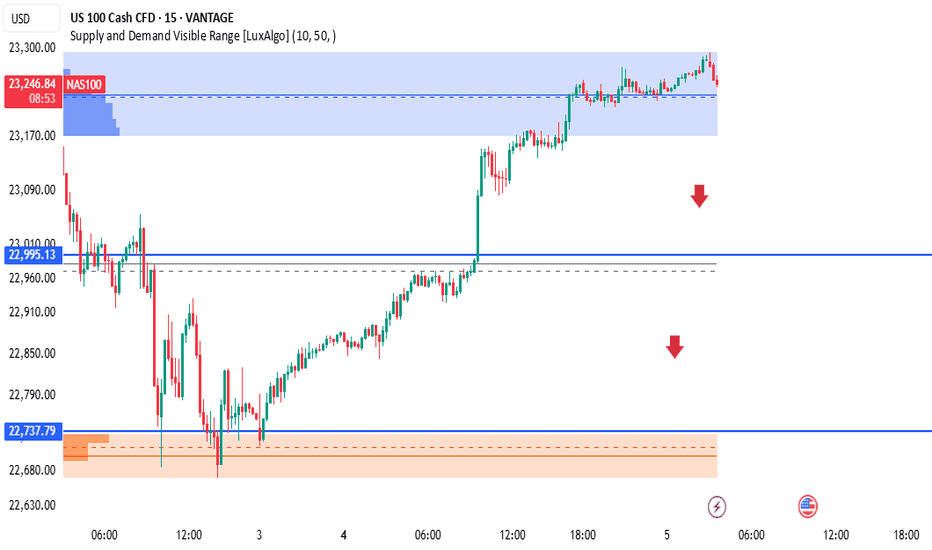
NAS100 – Supply Zone Rejection Trade IdeaPrice has entered a strong supply zone (highlighted in blue), where previous selling pressure originated. A sharp move up has now slowed within this zone, potentially signaling a distribution phase or exhaustion of bullish momentum.
🔰 Key Levels:
🟦 Supply Zone: 23,170 – 23,260
🔵 Mid Support: 22,995.13 (Potential retracement level)
🟧 Demand Zone: 22,680 – 22,750
🔽 Red arrows indicate potential downside targets.
🧠 Smart Money Perspective:
Price has filled the Fair Value Gap (FVG) and tapped into a low-volume node on the visible range volume profile.
Signs of liquidity sweep and exhaustion within the supply zone.
Possible short setup forming if price confirms a Change of Character (CHOCH) on LTF (e.g., break of short-term bullish structure).
💡 Trade Idea:
Short Entry: On confirmation inside supply zone
SL: Above 23,260
TP1: 22,995 (reaction level)
TP2: 22,737 (major demand zone)
Watch for a reaction at the 22,995 level; if price slices through, the next destination may be the orange demand block.
⚠️ Disclaimer:
This is for educational purposes only, not financial advice. Always use proper risk management.
🔖 Hashtags:
#NAS100 #SmartMoney #PriceAction #SupplyZone #OrderBlock #CHOCH #LuxAlgo #FrankFx14 #TradingView #US100
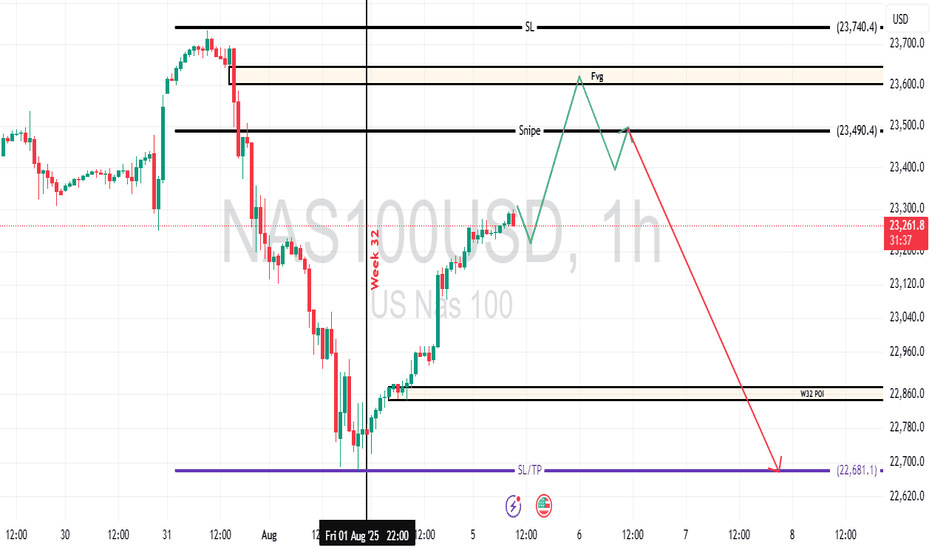
NASDAQ Week 32 OutlookOn the US Nas 100 1-hour chart, a bearish breakout from a symmetrical triangle suggests downward momentum. The Fair Value Gap at 23,500.0 is a pivotal level—watch for a breakout and retest here to confirm sell entries. Aim for the target at 22681.1, with a stop-loss at 23,740.4 to protect against adverse moves.
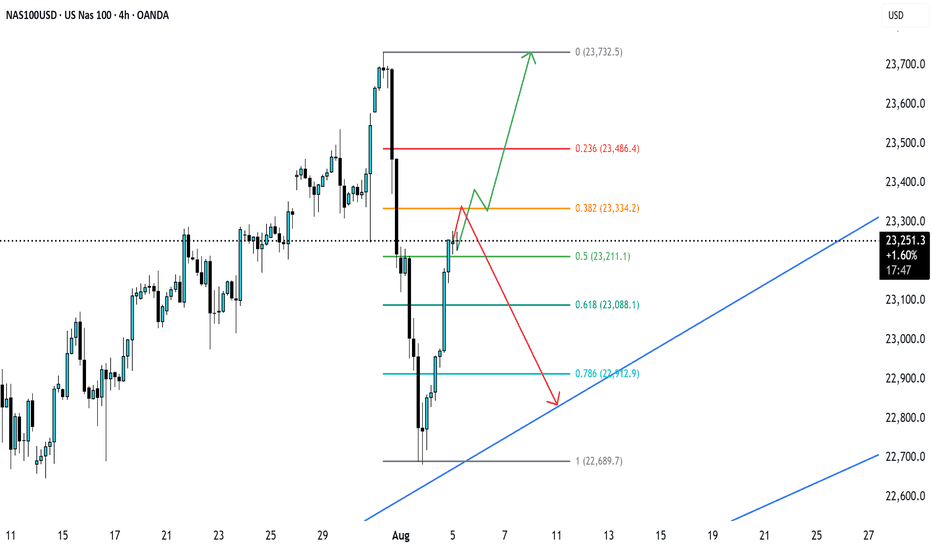
NAS100 at mjaor resistance area Fib 0.5Price has reached the 0.5–0.382 Fibonacci retracement zone of the recent swing. If the bears are strong, we may see a rejection toward the trendline support. However, if this resistance is broken, a bullish continuation is also possible. Let's see how it plays out.
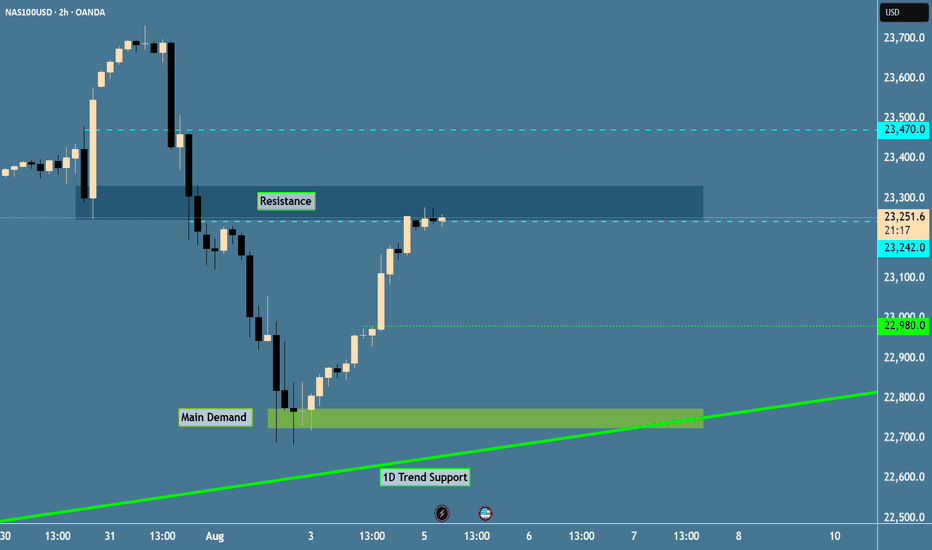
NAS100 - IMPORTANT UPDATEDear Friends in Trading,
How I see it,
Investors imposed a very strong recovery attempt.
Daily tweezer close.
As it stands, potential for a "BEARISH" sentiment is wavering.
1) Will price come all the way back to main demand for a second leg?
2) Will price only retrace back into discount for a higher right foot?
Keynote:
Investors show confidence/hopeful for a near term rate cut...
I sincerely hope my point of view offers a valued insight
Thank you for taking the time study my analysis.
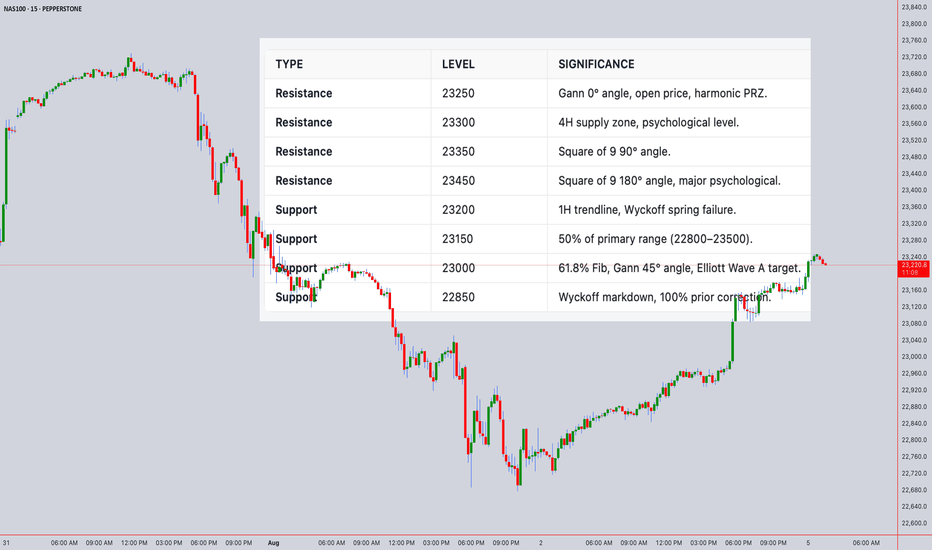
Technical Analysis Forecast for NAS100Open Price: 23242.3 (UTC+4)
1. Japanese Candlestick Analysis
4H/1H: Price opened at 23242.3 near resistance (23250–23300). Recent candles show bearish harami (4H) and dark cloud cover (1H), signaling rejection.
30M/15M: Gravestone doji at 23242.3 and three black crows indicate strong bearish momentum.
5M: Shooting star formation suggests exhaustion. Failure to close above 23250 confirms weakness.
Outlook: Bearish reversal likely if 23200 breaks.
2. Harmonic Patterns
4H/1H: Bearish Butterfly Pattern completing at 23242.3 (D-point).
PRZ: 23240–23250 (confluence of 127.2% XA and 161.8% BC).
Fibonacci Ratios: AB=CD symmetry (23240–23250).
30M: Bullish Crab forming at 23100, but secondary to larger bearish setup.
Outlook: High-probability short entry at 23240–23250 with target 23000.
3. Elliott Wave Theory
4H: Wave 5 of impulse cycle peaked at 23242.3.
Structure: Completed 5-wave sequence from 22800 → 23242.3.
Corrective Phase: ABC pullback targeting 23000 (Wave A) and 22850 (Wave C).
1H: Sub-wave (v) of 5 ending at 23242.3. RSI divergence confirms exhaustion.
Outlook: Bearish correction to 22850–23000 within 24 hours.
4. Wyckoff Theory
Phase: Distribution (after markup from 22800 → 23242.3).
Signs: High volume at 23242.3 (supply), upthrust above 23300 failed.
Schematic: Phase C (markdown) initiating.
1H/30M: Spring at 23200 failed to hold, indicating weak demand.
Outlook: Break below 23200 triggers markdown to 23000.
5. W.D. Gann Theory
Time Theory
24H Cycle: Key reversal windows:
UTC+4: 08:00–10:00 (resistance test), 14:00–16:00 (trend reversal).
Square of 9: 23242.3 aligns with 0° angle (resistance).
Square of 9
23242.3 → Resistance Angles:
0° (23250), 90° (23350), 180° (23450).
Support: 45° (23000), 315° (22850).
Price Forecast: Reversal at 23250 (0° angle).
Angle Theory
4H Chart: 1x1 Gann Angle (45°) from 22800 low at 23000. Price above angle = bullish, but overextended.
1H Chart: 2x1 Angle (63.75°) at 23242.3 acting as resistance.
Squaring of Price & Time
Price Range: 22800 → 23242.3 (442.3 points).
Time Squaring: 442.3 hours from 22800 low → 23250 resistance (442.3 points ≈ 442.3 hours).
Harmony: 23242.3 = Time Cycle Peak (24H from open).
Ranges in Harmony
Primary Range: 22800–23500 (700 points).
50% Retracement: 23150 (support).
61.8% Retracement: 23000 (critical support).
Secondary Range: 23000–23300 (300 points).
Key Levels: 23150 (50%), 23000 (61.8%).
Price & Time Forecasting
Price Targets:
Short-Term: 23000 (61.8% Fib, Gann 45° angle).
Extension: 22850 (100% of prior correction).
Time Targets:
First Reversal: 8–12 hours from open (UTC+4 12:00–16:00).
Second Reversal: 20–24 hours (UTC+4 00:00–04:00 next day).
Synthesized 24H Forecast
Bearish Scenario (High Probability)
Trigger: Break below 23200 (confirmed by 1H/30M close).
Targets:
T1: 23000 (61.8% Fib, Gann 45° angle).
T2: 22850 (Wyckoff markdown, Elliott Wave C).
Timeline:
8–12H: Drop to 23000 (UTC+4 12:00–16:00).
20–24H: Test 22850 (UTC+4 00:00–04:00 next day).
Confirmation: RSI <50 on 1H, volume spike >25% average.
Bullish Scenario (Low Probability)
Trigger: Sustained close above 23300 (Gann 0° angle).
Targets: 23350 (90° angle), 23450 (180° angle).
Timeline: 12–16 hours (if 23300 breaks).
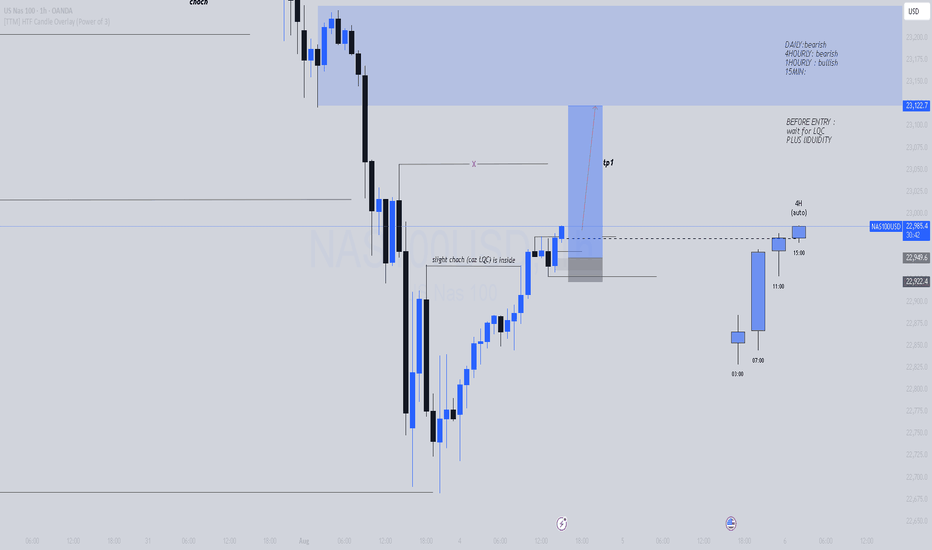
NAS100 | 1H Bullish Continuation Setup – Aug 4, 2025Here’s a complete **TradingView trade description** for your NAS100 setup based on the chart you shared — using Smart Money Concepts, market structure, and intraday context:
---
**NAS100 | 1H Bullish Continuation Setup – Aug 4, 2025**
### 🔹 Market Bias:
* **Daily**: Bearish
* **4H**: Bearish
* **1H**: Bullish structure forming
* **15min**: Bullish BOS + internal structure break
---
### 🧠 Trade Narrative (SMC-Based):
Price created a **liquidity sweep + slight CHoCH** on the 15min inside a discount zone. After the sweep, we saw strong bullish displacement on the 1H, shifting momentum temporarily back to buyers.
We've now returned to the **origin of the impulsive move (POI)** and are looking for **continuation into premium**, targeting the nearest inefficiency + supply zone above.
Entry taken from a refined OB with **Buy Limit at 22,949.6**, aligned with:
* Internal liquidity resting below
* 50% of the bullish candle
* Structure support formed after BOS
---
### 📌 Entry Criteria:
* **Buy Limit**: 22,949.6
* **SL**: Below recent low / zone invalidation (e.g., below 22,922.4)
* **TP1**: 23,056.6 (1H imbalance + prior S/R flip)
* **Extended TP**: 23,122.7 (origin of H4 supply zone)
* **RR**: \~3.2R to TP1
🛑 Before entry: Wait for **LQ grab + internal confirmation** (e.g., M5 rejection wick or engulfing).
---
### 🧩 Confluences:
* ✅ Internal liquidity sweep
* ✅ BOS + CHoCH (15M + 1H structure)
* ✅ Entry refined to OB with imbalance
* ✅ Targeting clean inefficiency + unmitigated supply
* ✅ Volume and momentum shift support continuation
---
**⚠️ Invalidation**: Clean break below 22,922.4 structure + bearish engulfing = setup no longer valid.
---
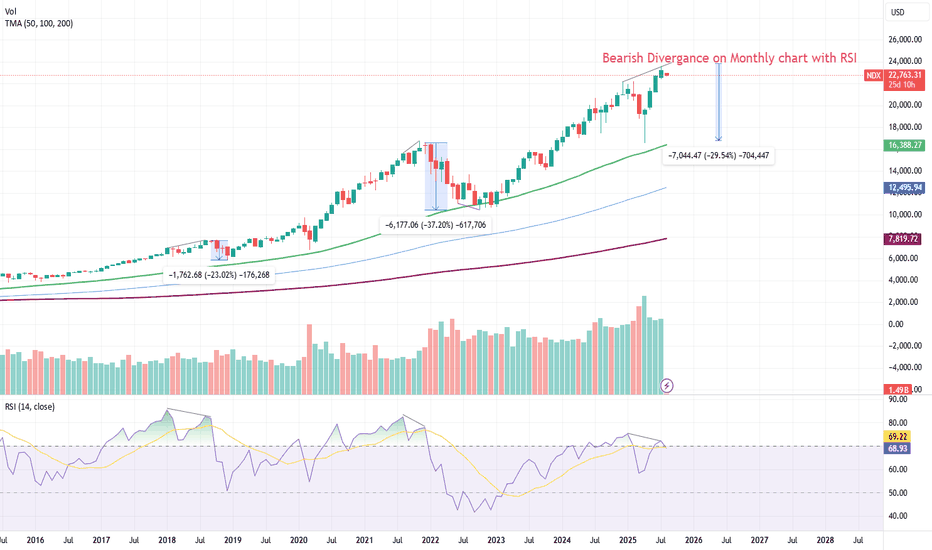
Nasdaq 100 Bearish Divergence Signals Potential 30% down ?Chart Analysis (Monthly):
The Nasdaq 100 (NDX) is showing a significant bearish divergence on the monthly chart with RSI, which historically has been a strong reversal signal. While the price has recently made a new high, the RSI has failed to confirm this move, forming lower highs. This divergence typically precedes major corrections in the index. Similar patters have been observed on S&P 500 and FANG+ Index.
Historical Context:
In past instances (highlighted on the chart), similar divergences led to substantial declines:
2018: ~23% drop
2022: ~37% drop
Currently, if history repeats, the NDX could potentially correct by ~30% from recent highs, bringing it closer to the 16,000–17,000 zone, aligning with the previous demand zone and the 100-month moving average.
Fundamental Backdrop – Tariff Issues:
Adding to the technical weakness, renewed concerns over U.S. trade tariffs under Trump's policy stance are resurfacing. Potential escalation in tariffs could weigh heavily on mega-cap tech stocks, which dominate NDX, impacting global supply chains and margins. Historically, tariff-related uncertainty has triggered volatility in growth-heavy sectors.
Watchlist Action:
Closely monitor upcoming U.S. trade policy announcements and tariff discussions.
Hedge long positions or consider selective short opportunities if bearish confirmation patterns appear on weekly/daily timeframes.
📌 Disclaimer: This analysis is for educational purposes only and does not constitute financial advice.
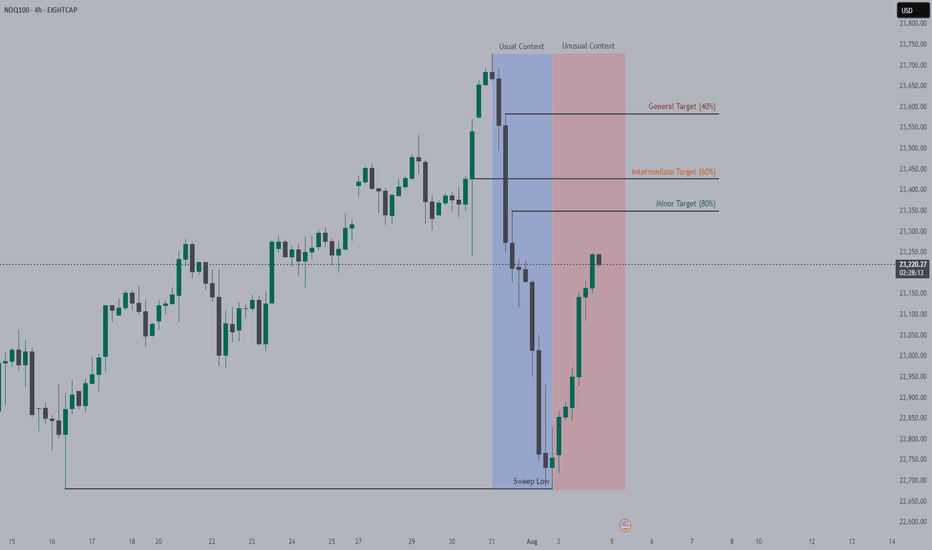
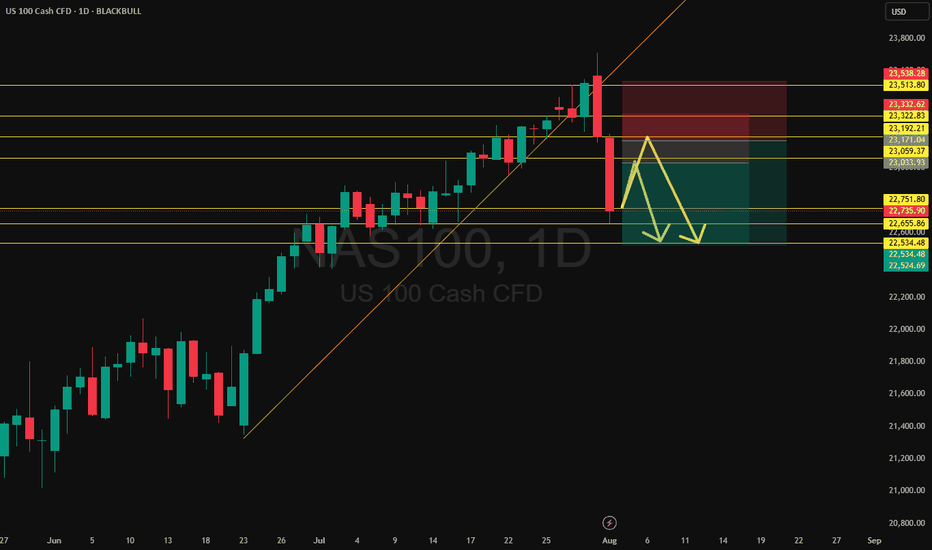
NAS100 Hits Monthly Level - Retrace or Reload?After a sharp leg down, NAS100 remains in a broader uptrend but is now reacting off a key monthly level. Expect a short-term retracement with the potential for a second leg lower. If bullish momentum returns, watch for an attempt to reclaim the level. Momentum is strong enough to challenge it again—traders should be ready for either a deep retrace or continuation move.
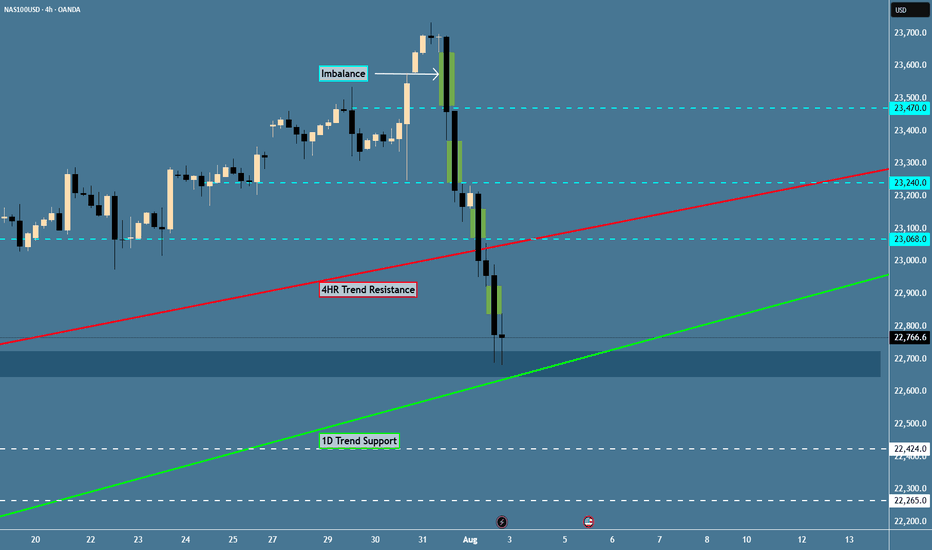
NAS100 - Potential Targets this WeekDear Friends in Trading,
How I see it,
(My week is building up; I'm using the DATA we have thus far)
Keynotes:
510k orders stacked at the current demand area.
If sellers push through Daily support decisively, it will become a strong resistance.
The real battlefield between sellers and buyer lies between 23250 - 23500.
Remember with stocks, Imbalances can remain unfilled for very long periods.
I sincerely hope my point of view offers a valued insight
Thank you for taking the time study my analysis.
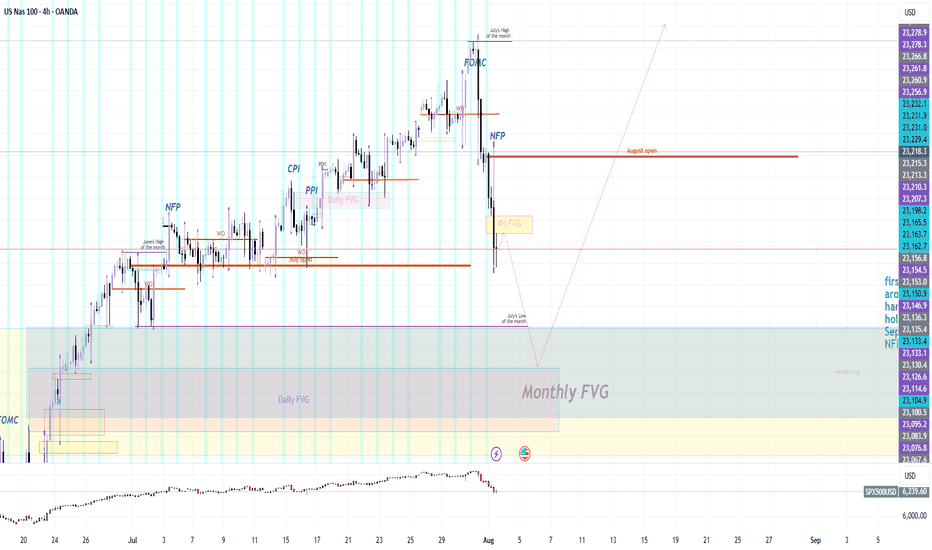
Sunday Premarket AnalysisWe will likely hit the 4H FVG not too far above where price left off on Friday.
Then head all the way down take July's low and hit the area below that
because there is a BIG FAT juicy MONTHLY, WEEKLY && DAILY FVG
sitting directly under the July monthly low. We will likely hit all three or maybe just 2
of these FVG's and then head up for super big push, bullish into at least the first week of September. Keep in mind Jackson Hole Symposium is mid month-ish also.
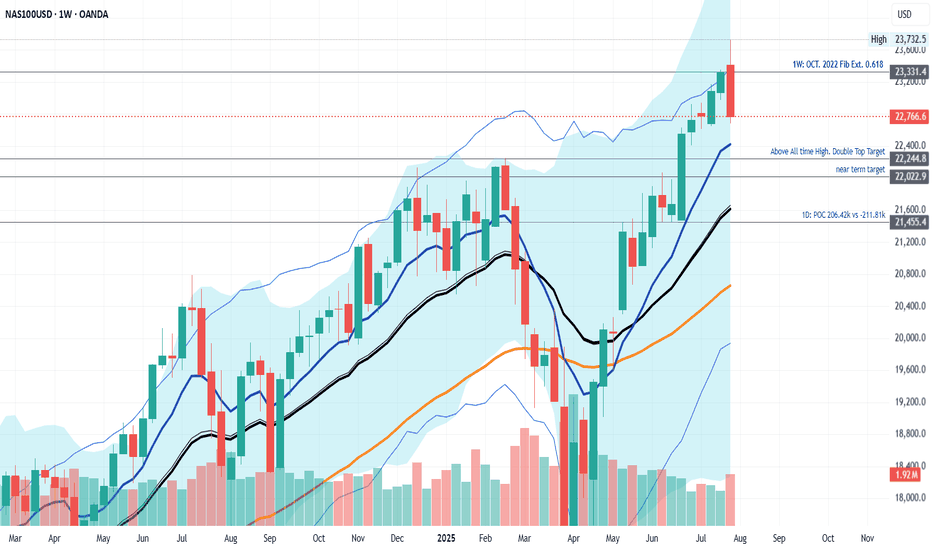
NAS100 Reversal Confirmed: Is the Rally Over?The NASDAQ 100 (NAS100) may have just hit its ceiling. In this video, I break down the technical evidence pointing to a confirmed reversal—including key candlestick formations and indicator signals that suggest the recent rally is losing steam.
The bearish engulfing candle on both the daily and weekly, along the monthly RSI divergence is signaling a deeper correction. Our initial target for this week is the previous high with a bounce for a much deeper correction which will be analyzed next week so stay tuned to all my updates and new publications. Thank you and have a great trading week. Cheers!!
