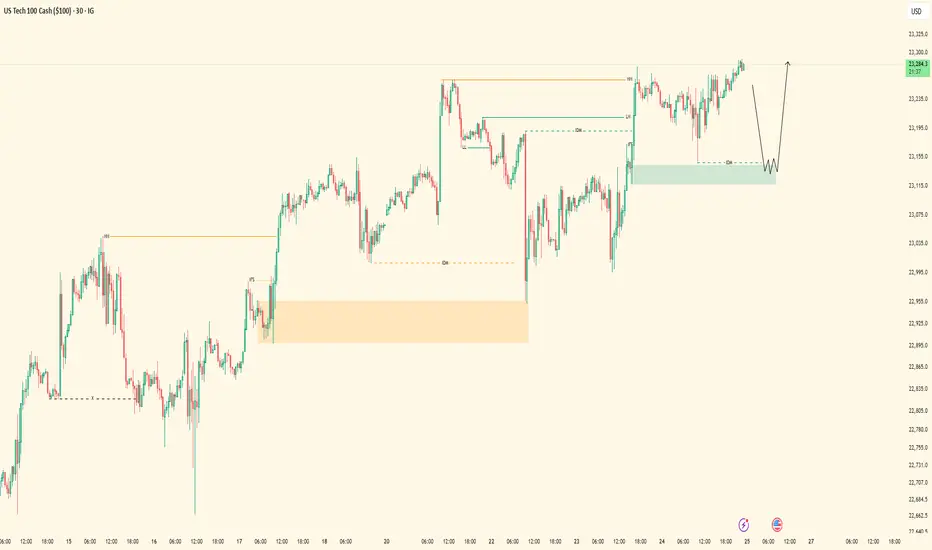
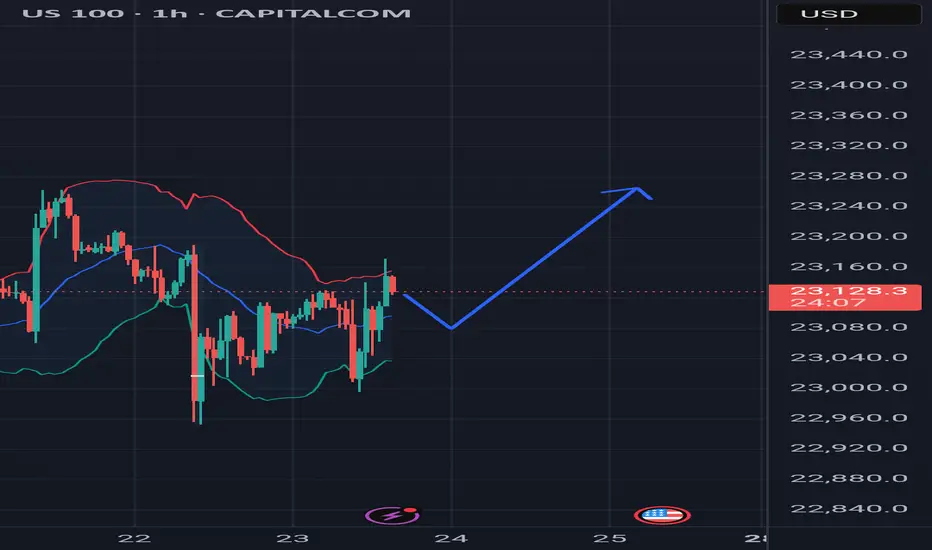
US100 LONGWe can see that there is a strong resistance zone, and the US30 has made a pullback into that zone. Based on the SK system, the outlook appears more bullish for this week.
US100 trade ideas

NAS100 - Potential TargetsDear Friends in Trading,
How I see it,
Insightful article: (The same principle applies to Nasdaq naturally)
1) Read the article first:
investinglive.com
2) Follow the link to watch the short video -
youtu.be
Keynote:
We are waiting for a decisive and very clear bearish signal
I promise you; we won't miss it.
It will be in our face, on a 4Hr grouping or a Daily grouping.
Most times it's 1 x Big Red signal on a high TF.
I sincerely hope my point of view offers a valued insight
Thank you for taking the time study my analysis.

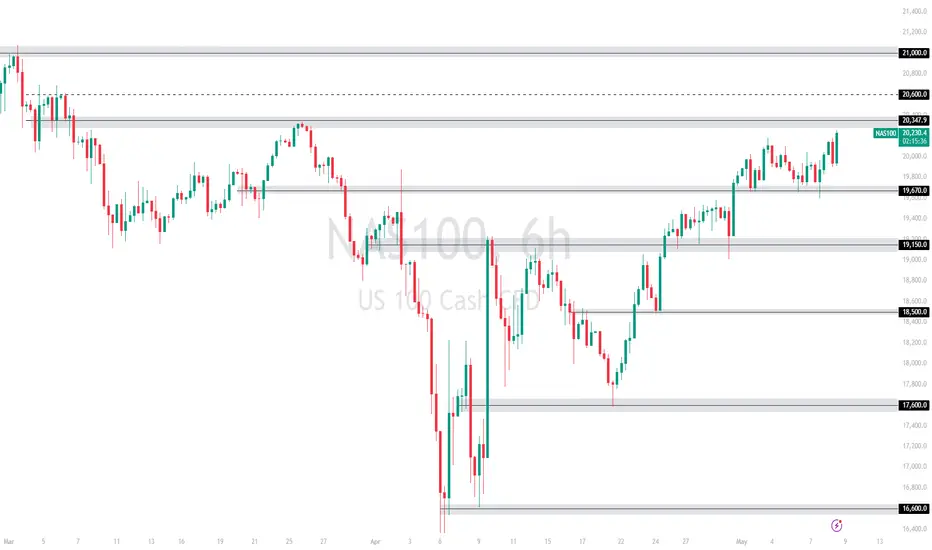
NASDAQ Bulls Pushing – Will 20,347 Hold or Break?Price is currently approaching the 20,347 🔼 resistance zone after a strong bullish rally from the 19,150 🔽 support level. The market structure remains bullish with consistent higher highs and higher lows, showing strong buyer momentum.
Support at: 19,670 🔽, 19,150 🔽, 18,500 🔽, 17,600 🔽
Resistance at: 20,347 🔼, 20,600 🔼, 21,000 🔼
Bias:
🔼 Bullish: If price breaks and holds above 20,347 🔼, we could see a continuation toward 20,600 and 21,000.
🔽 Bearish: A strong rejection from 20,347 🔼 could send price back down toward 19,670 and 19,150 for a retest.
📛 Disclaimer: This is not financial advice. Trade at your own risk.
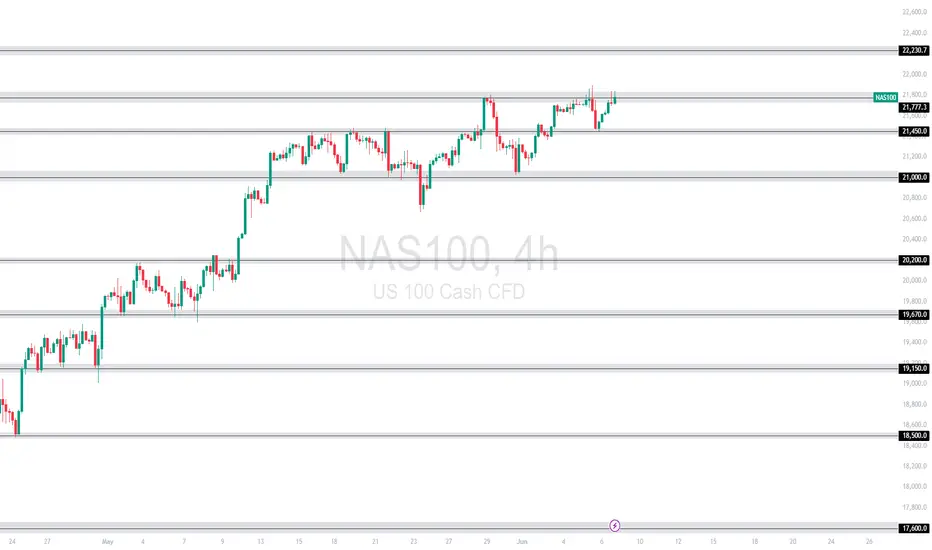
NAS100 [Consolidating ] – Will It Break Higher or Pull Back?The NAS100 has maintained a bullish structure and is currently pressing against the resistance zone around 21,777.3. This area has acted as a ceiling several times in recent sessions. Price is showing consolidation just below resistance, suggesting either an imminent breakout or another rejection.
Currently trading at 21,777.3, with
Support at: 21,450.0 🔽
Resistance at: 22,230.7 🔼
🔎 Bias:
🔼 Bullish: A strong break and hold above 21,777.3 may drive price toward the next resistance at 22,230.7.
🔽 Bearish: Rejection from 21,777.3 could lead to a retracement toward 21,450.0, with deeper downside potential if that level fails.
📛 Disclaimer: This is not financial advice. Trade at your own risk.
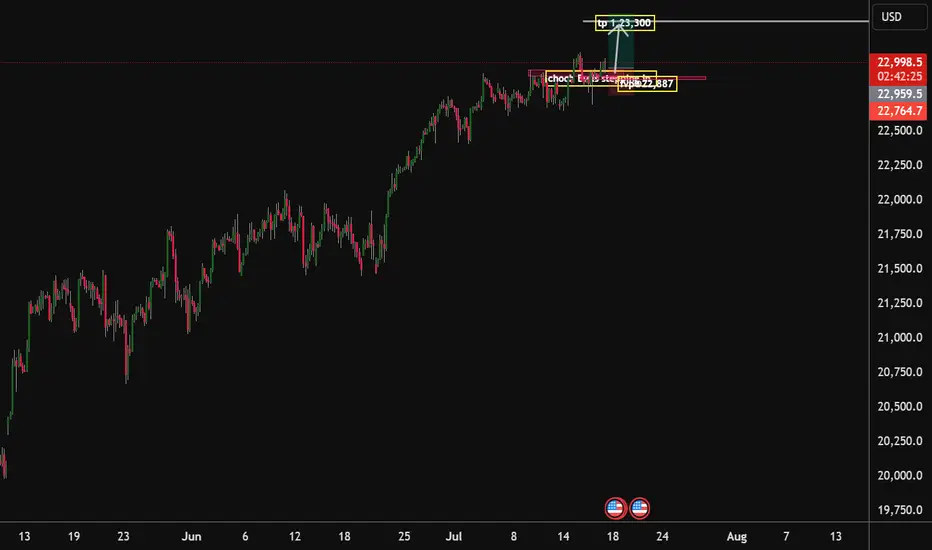
Nasdaq100 Bulls ready to drive the price to 23,300 handle With the choch on the market structure and with Key data released on Thursday, reflected strength in the U.S. economy. Stocks rose this Thursday, buoyed by fresh economic data reports and a slew of corporate earnings releases. The tech-heavy Nasdaq Composite has advanced 0.4%, and quarterly earnings reports released this week have exceeded Wall Street’s expectations, fueling investor confidence. I am expecting that by the end of this week or the beginning of next week will see the bulls drive the market to our 23,300 handle. I am with the bulls on this one
Tp1.23,300.
Results from 7/21/25Just like I said -- it played out
WE hit the Daily FVG and then headed up hard.
If you got in buys this week, COMMENT down below
share why and how.

NSDQ100 pushing to new ATH?Thursday was a slightly positive session for equities, with the NASDAQ 100 rising +0.18% to close at a fresh record high, driven by strong economic data. However, overall market action was subdued, with the S&P 500’s trading range the narrowest since February (0.35%).
Notably, the equal-weighted S&P 500 fell -0.33%, highlighting underlying weakness outside mega-cap tech.
A key drag on the NASDAQ came from Tesla (-8.20%), which slumped after disappointing earnings. This weighed on the Magnificent 7, which declined -0.21% despite gains in the other six members.
On the macro front, the US dollar strengthened as Donald Trump downplayed his dispute with Fed Chair Jerome Powell, though continued to pressure the Fed on interest rates. Meanwhile, the FCC approved Paramount’s merger with Skydance, signaling a green light for M&A activity in media despite political tensions.
Conclusion – NASDAQ 100 Trading View:
The NASDAQ 100 remains technically bullish, setting new highs amid resilient economic data. However, breadth is weakening, and headline risk—especially around earnings (e.g., Tesla)—could trigger short-term volatility. Traders should stay long with caution, watching for sector rotation or profit-taking near highs, and monitor Fed-related rhetoric for macro-driven moves.
Key Support and Resistance Levels
Resistance Level 1: 23480
Resistance Level 2: 23600
Resistance Level 3: 23790
Support Level 1: 23070
Support Level 2: 22950
Support Level 3: 22750
This communication is for informational purposes only and should not be viewed as any form of recommendation as to a particular course of action or as investment advice. It is not intended as an offer or solicitation for the purchase or sale of any financial instrument or as an official confirmation of any transaction. Opinions, estimates and assumptions expressed herein are made as of the date of this communication and are subject to change without notice. This communication has been prepared based upon information, including market prices, data and other information, believed to be reliable; however, Trade Nation does not warrant its completeness or accuracy. All market prices and market data contained in or attached to this communication are indicative and subject to change without notice.

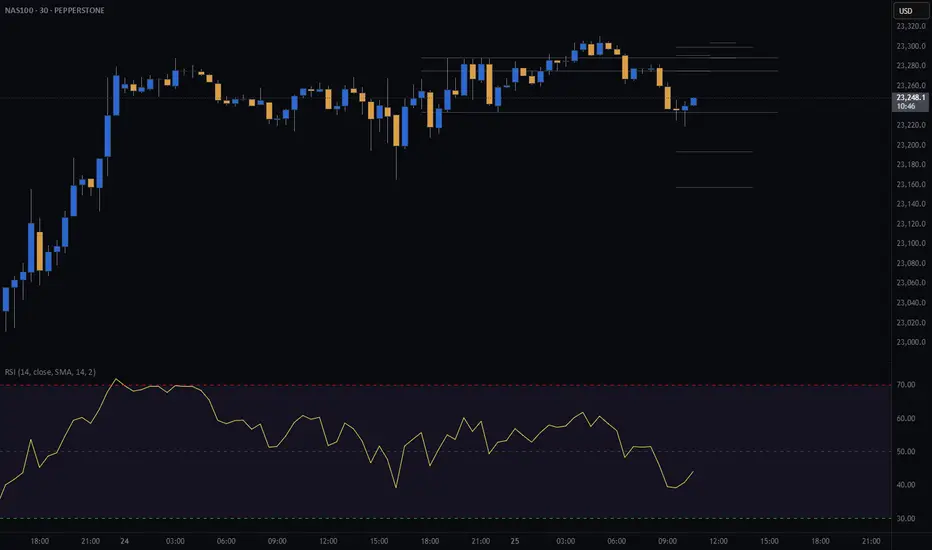
Bullish RSI Divergence on Nasdaq 100$ustech Bullish RSI Divergence on the 1H TF indicating continuation of the bullish trend

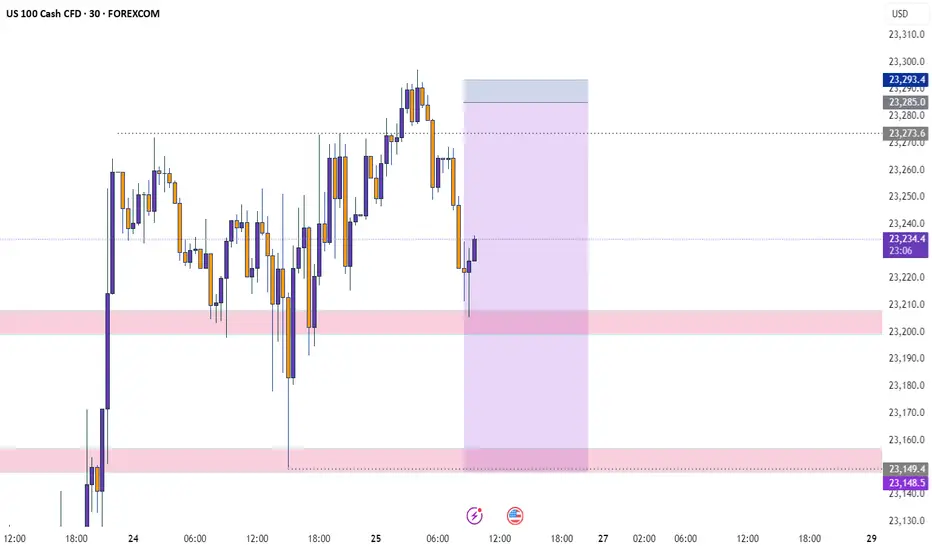
NDX (NASDAQ) CASH500 SHORT - Head and shoulders 30minRisk/reward = 3.2
Entry price = 23 275.7
Stop loss price = 23 303.9
Take profit level 1 (50%) = 23 193
Take profit level 2 (50%) = 23 157
Waiting on confirmation on a number of variables before entering the trade.
SellRejection Level
Daily Volume
Market Structure Shift
London US Session
Trend Line Break
Untapped Order Point
NASDAQ (CASH100) SHORT - double top H6Risk/reward = 4.3
Entry price = 23 282
Stop loss price = 23 398
Take profit level 1 (50%) = 22 871
Take profit level 2 (50%) = 22 663
If current H6 goes back into range, I will open short position.
All variables on checklist have been met.
I was out last night so I missed my initial entry. Hoping for a second chance.
Hopefully this short works because the last few higher time frame short setups have failed, although because of exit plan I have made very little losses.

Nasdaq Bullish Flow | 5M OB Execution PendingPair: NAS100
Bias: Bullish
Timeframes: 30M / 5M
Price remains heavy bullish — structure aligning perfectly across the board. Ever since the 30M OB was mitigated, I’ve been following Nasdaq’s order flow step-by-step.
I was watching for full-bodied confirmations inside the 30M zone, but instead, price gave clarity through the lower timeframes. That 5M flip gave away smart money’s intent — showing me exactly where accumulation is happening.
Now waiting for price to tap into the 5M OB to shift into execution mode. This setup has been mapped with precision — no guessing. Once entry presents itself, I’ll follow through.
Entry Zone: 5M OB
Target: 5M highs
Mindset Note: Still in analysis mode — patience until price hits my zone. Smart money doesn’t rush, it accumulates. So do I. 💼
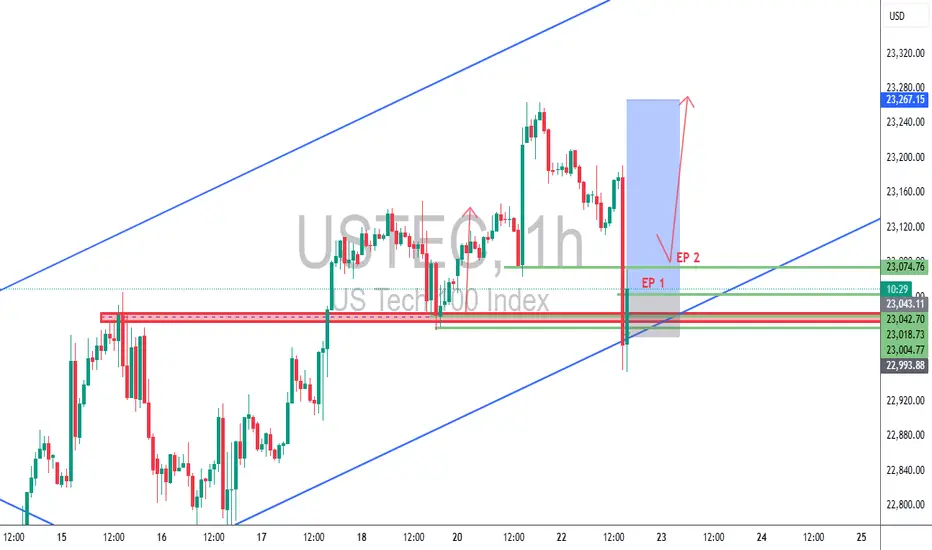
USTEC 1H – Dual Entry Precision | TCB Trend Phase SetupUSTEC 1H – Dual Entry Precision | TCB Trend Phase Setup
Market remained bullish with clear channel structure. After a pullback into the previous breakout zone, price swept liquidity and wicked below, offering two refined entries (EP 1 & EP 2) inside the demand zone.
🔸 EP 1 – Aggressive entry on first touch
🔸 EP 2 – Confirmation entry after rejection
🔸 SL placed below structural liquidity sweep
🔸 Target: Mid-channel + price inefficiency fill above
Trade Summary
🧠 Trend Phase entry with TCB logic
📌 Demand zone = Key structure
⏱️ Low drawdown
💥 RRR ~1:3
📈 TP in motion (or hit, if price reached 23,267)
📎 #Hashtags:
#USTEC #US100 #Nasdaq #SmartMoneyConcepts #SniperTrader #ForexTrading #PriceActionTrading #TCBSetup #TrendTrading #LiquiditySweep #RiskReward #TradingViewAnalysis
Nasdaq Index Analysis (US100 / NASDAQ):The Nasdaq index continues its upward trend in the medium to long term. Yesterday, it tested the 23,000 USD level and bounced higher toward 23,290 USD.
1️⃣ If the price breaks below 23,100 USD and closes beneath it, we may see a decline toward 23,000 USD, followed by 22,920 USD.
2️⃣ However, if the price holds above 23,290 USD, further bullish momentum could lead to a new high around 23,400 USD.
⚠️ Disclaimer:
This analysis is not financial advice. Please monitor the markets and analyze the data carefully before making any investment decisions.

Will USTEC Continue Its Rallies Amid Better Market Sentiment?Macro approach:
- USTEC advanced modestly this week, supported by upbeat corporate earnings and resilience in economic data amid ongoing policy uncertainty.
- The index benefited from strong expected results in major tech firms such as Microsoft (MSFT) and Nvidia (NVDA), as top giant AI leadership, helping to bolster sentiment despite lingering concerns about tariffs and Fed policy direction.
- US macro data showed sticky inflation in key categories, robust retail sales, and falling jobless claims. This prompted the Fed to retain its cautious stance on rate cuts while markets reassessed policy expectations. Policy-related headlines and manufacturing sector developments also partly drove market volatility.
- USTEC could remain sensitive to incoming tech earnings, the 29-30 Jul Fed meeting, and potential US tariff announcements in early Aug. Persistent inflation and any surprises in central bank communication may drive volatility in the sessions ahead.
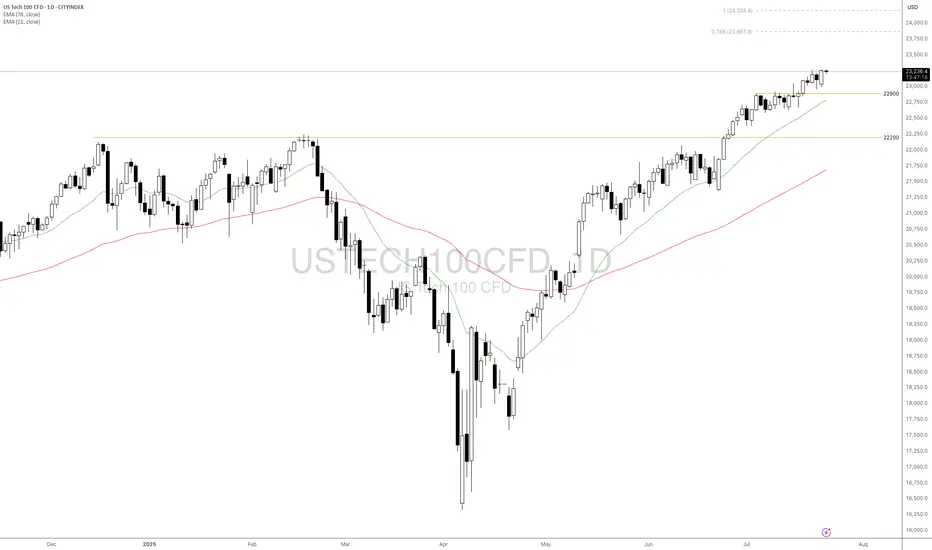
Technical approach:
- USTEC trended higher and created a new record high. The price is above both EMAs, indicating a strong bullish momentum.
- If USTEC stays above the support at 22900, the price may continue toward the 78.6% Fibonacci Extension at around 23867.
- On the contrary, breaking below the support at 22900 and EMA21 may prompt a deeper correction to retest the following support at 22000.
Analysis by: Dat Tong, Senior Financial Markets Strategist at Exness
NASDAQ100| - Bullish Bias RemainsPrice didn’t give me the deep candle retrace into my 30M OB — just a wick tap — but that was enough. That wick shows me smart money touched in.
Dropped to the LTF and got my shift in structure confirming bullish intent.
Now I’m locked in, watching for price to sweep a 5M sell-side liquidity pocket into a clean LTF order block for the next entry.
🎯 Target: Short-term 5M highs
🚀 Bias: Still bullish unless structure breaks
This is a patience game now — execution only after confirmation.
NASDAQ (CASH100) SHORT - Head and shoulders H1Risk/reward = 3.8
Entry price = 23 167.9
Stop loss price = 23 232.8
Take profit level 1 (50%) = 22 943
Take profit level 2 (50%) = 22 878
Still waiting on confirmation on some variables in checklist

long position on nas100I am long on nas100 ,I go in detail on the video hope I'm clear ,if you have a question or correction I am open to adjust thank you

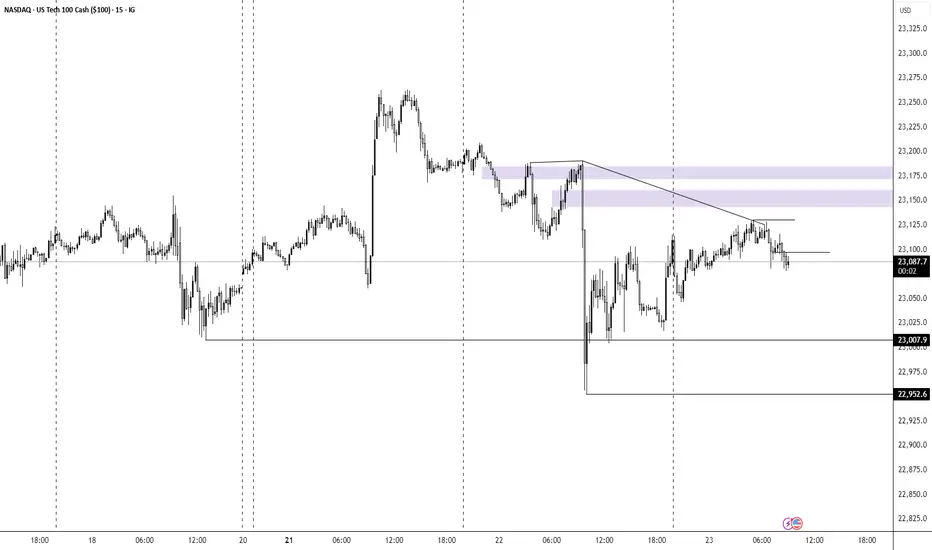
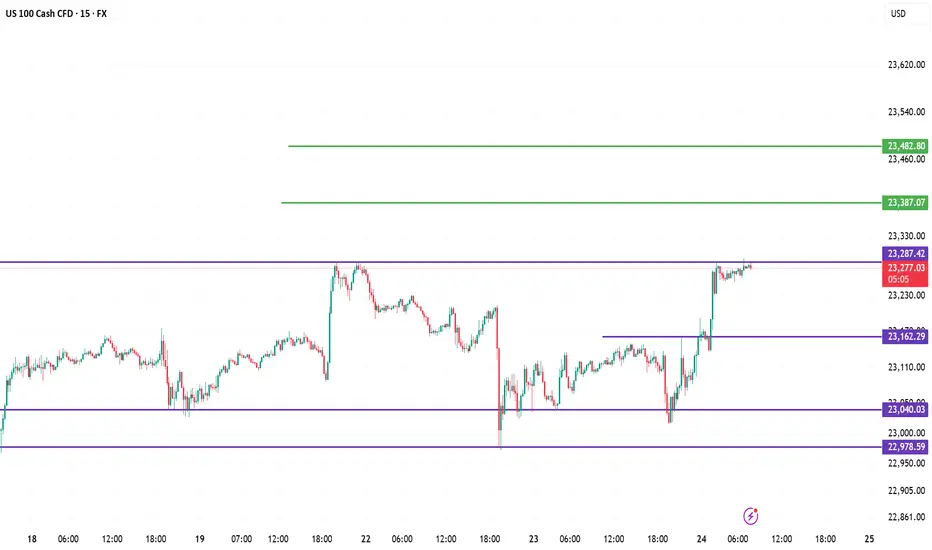
US100 Analysis Report (15m Chart)1. 🔍 Liquidity Grab (Sell-side taken)
Price swept below 23,040 and sharply reversed from 22,978, clearing out weak sellers.
2. 📈 Break of Structure (BOS)
A bullish BOS occurred after price broke above 23,162, confirming short-term bullish intent.
3. 🟪 Rejection Zone
Price is now testing 23,287.42 — a supply/resistance zone. Watch for signs of rejection or breakout.
4. 📊 Bullish Scenario
If price breaks 23,287 cleanly, expect next moves towards 23,387 and then 23,482.
5. 📉 Bearish Setup Possibility
Rejection from 23,287 could pull price back to 23,162 or 23,040 before the next move.

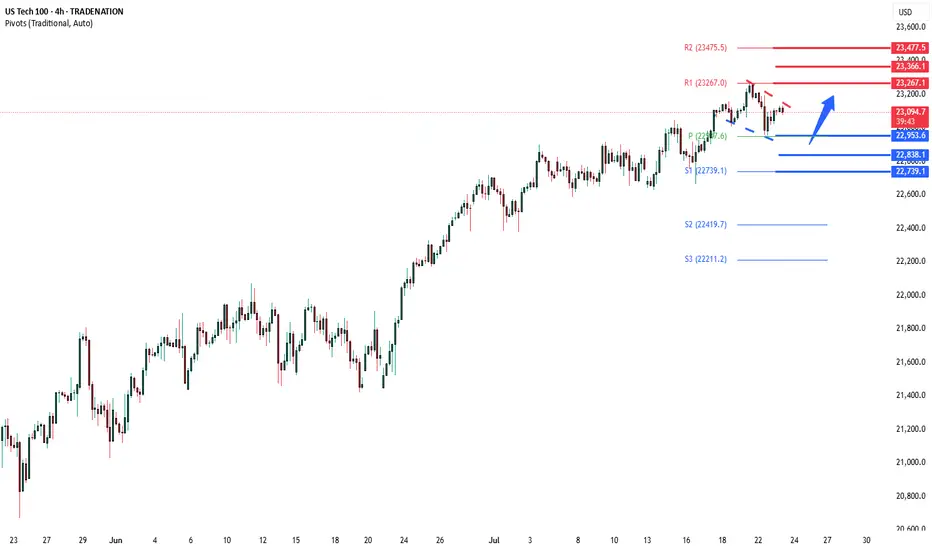
NSDQ100 another bullish flag developing ?Donald Trump has agreed a new trade deal with Japan, setting 15% tariffs on US imports like cars and launching a $550 billion fund to boost investment in the US. This is lower than his earlier 25% tariff threat. Other allies saw mixed outcomes—the Philippines got a small tariff cut, while Canada’s talks stalled. Goldman Sachs now expects the US baseline tariff rate to rise to 15%.
Trump also suggested that Fed Chair Jerome Powell may not stay in his role much longer, and he’s considering removing capital gains tax on home sales, which could affect the housing market.
Separately, a Chinese-linked cyberattack breached the US nuclear weapons agency, though no classified data was stolen. Meanwhile, SpaceX’s investor documents flagged Elon Musk’s political activity as a potential risk as the company targets a $400 billion valuation.
Conclusion for Nasdaq 100:
The Nasdaq 100 faces short-term uncertainty due to rising trade tariffs, Fed leadership questions, and geopolitical risks. While some US-focused investments could benefit, traders should stay cautious as policy and global tensions evolve.
Key Support and Resistance Levels
Resistance Level 1: 23265
Resistance Level 2: 23670
Resistance Level 3: 23480
Support Level 1: 22953
Support Level 2: 22840
Support Level 3: 22740
This communication is for informational purposes only and should not be viewed as any form of recommendation as to a particular course of action or as investment advice. It is not intended as an offer or solicitation for the purchase or sale of any financial instrument or as an official confirmation of any transaction. Opinions, estimates and assumptions expressed herein are made as of the date of this communication and are subject to change without notice. This communication has been prepared based upon information, including market prices, data and other information, believed to be reliable; however, Trade Nation does not warrant its completeness or accuracy. All market prices and market data contained in or attached to this communication are indicative and subject to change without notice.