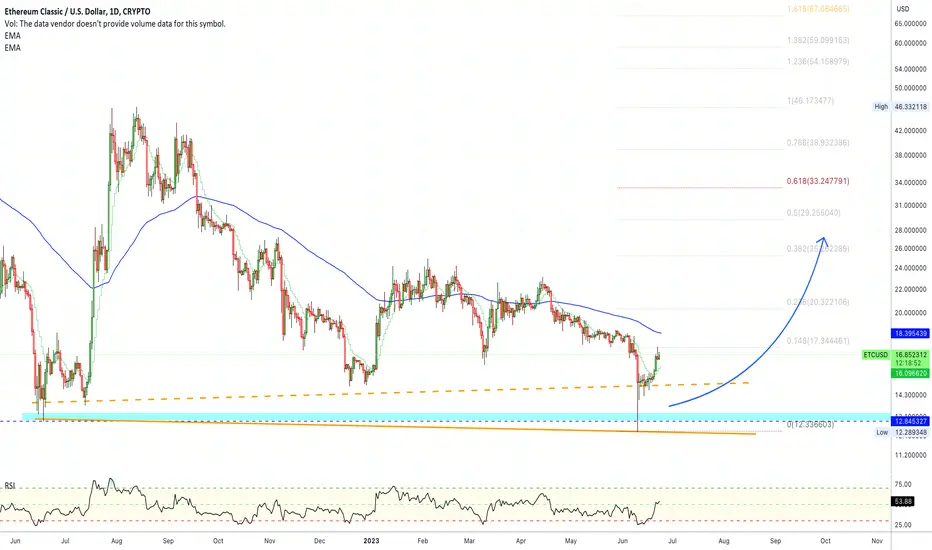
Ethereum Classic levelsEthereum Classic levels on the 1-day chart: I'm posting this as a long from a much better entry price so be careful about a new entry price. ETC printed a big volume candle on Wednesday with price action going up with it, followed by a pullback yesterday. Now, pi RSI is at the top with BBMC set to VWMA13 expanding up since Wednesday. Probability wise, it'd be better to wait for another pullback than chasing it up here after +25% in 48hrs. Still with that said, ETC is looking like it's headed for SMA200 $25 eventually. Plus, I still think ETC is undervalued from a utility valuation in the future.
SMA200 = $25.02
VWMA13 Bollinger-Bands.Multi_Choice:
top = $21.91
R3 = $20.75
R2 = $19.58
R1 = $18.41
pivot = $17.25
S1 = $16.08
S2 = $14.91
S3 = $13.74
bottom = $12.57
Do your own due diligence, your risk is 100% your responsibility. This is for educational and entertainment purposes only. You win some or you learn some. Consider being charitable with some of your profit to help humankind. Good luck and happy trading friends...
*3x lucky 7s of trading*
7pt Trading compass:
Price action, entry/exit
Volume average/direction
Trend, patterns, momentum
Newsworthy current events
Revenue
Earnings
Balance sheet
7 Common mistakes:
+5% portfolio trades, capital risk management
Beware of analyst's motives
Emotions & Opinions
FOMO : bad timing, the market is ruthless, be shrewd
Lack of planning & discipline
Forgetting restraint
Obdurate repetitive errors, no adaptation
7 Important tools:
Trading View app!, Brokerage UI
Accurate indicators & settings
Wide screen monitor/s
Trading log (pencil & graph paper)
Big, organized desk
Reading books, playing chess
Sorted watch-list
Checkout my indicators:
Fibonacci VIP - volume
Fibonacci MA7 - price
pi RSI - trend momentum
BBMC - bollinger bands
TTC - trend channel
AlertiT - notification
tickerTracker - MFI Oscillator
tradingview.sweetlogin.com
ETCUSD trade ideas

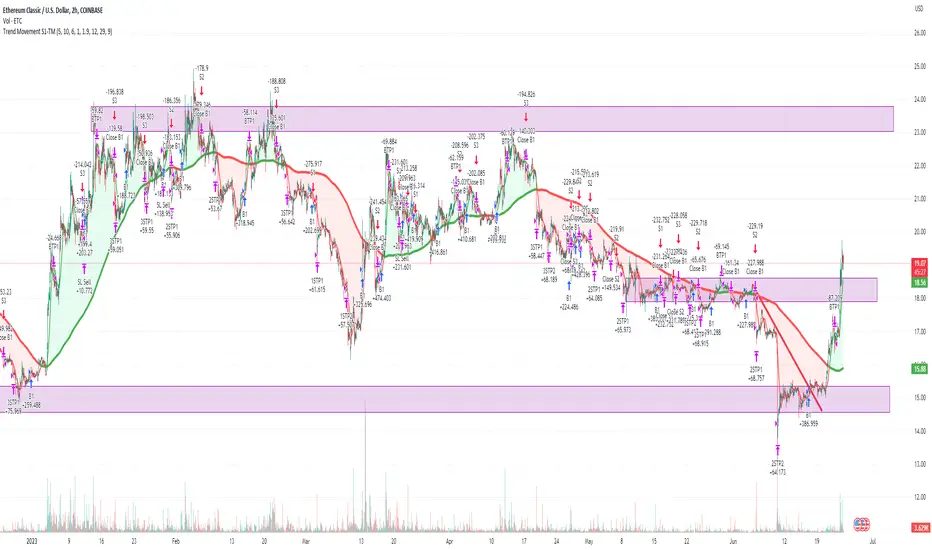
Breaking strong resistanceOn the 2h ETCUSD chart, we see that the price of ETC is reacting after breaking through the 18.x resistance area.
Before that, the price after breaking through the downtrend line at 15.x area accumulated and had a very good bullish phase.
The price needs to accumulate strength to break through to the 23.x range to confirm the position of the uptrend firmly.
Currently suitable for a hold order, not suitable for opening a new position.
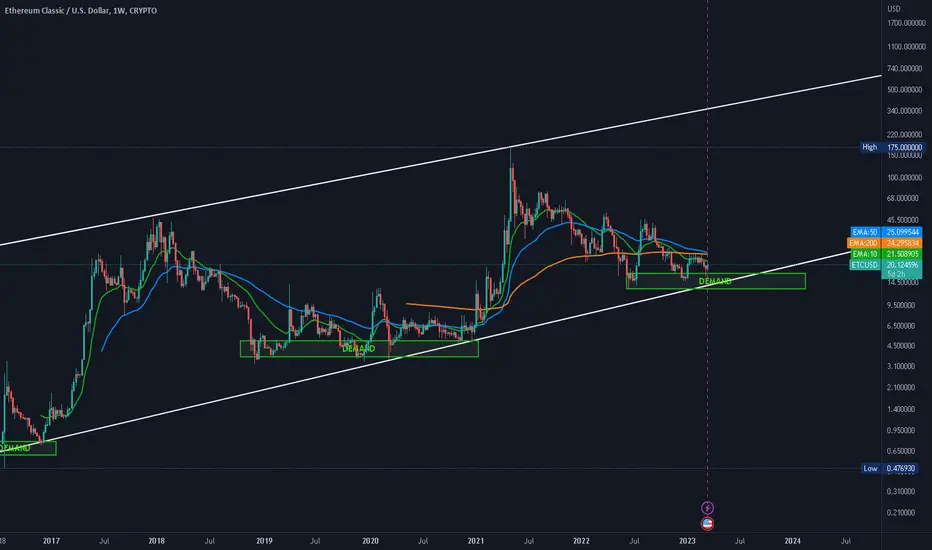
✴️ Ethereum Classic Ultra Strong Bullish Potential ($65 Next?)We have a situation here similar to what we saw with Cardano.
Ethereum Classic hit a lower low when we look at the candles wick in June 2023 vs June 2022 but a higher low when we look at the candle close.
The candle close is many times more important/relevant when it comes to TA.
A higher high is more valid than a lower low, in this case but we consider both.
The fact that the low was just a wick is a bullish signal. Bears/sellers sold everything but it was quickly bought.
We were talking about EMA100 and comparing it to last year, obviously, EMA100 failed as support and ETCUSD has been trading below it.
Since it peaked in August 2022, we have gone through a massive correction phase.
All the people that had to sell sold.
All those people who had doubt are gone.
With such a long correction, weak hands exist no more.
It is easy/safe to buy now expecting long-term growth.
Once we hit bottom, the only place left to go is up.
The next wave can go higher than August 2022, meaning $65+... We will see how it goes!
This is not financial advice.
I am sharing my opinions and experience. I am not responsible for your actions.
Thank you for reading.
And thank you for your continued support.
Namaste.
ETCUSDT undergoing the reversalLove the formation of the double bottom, and the current pullback on ETCUSDT. It provides a good RR opportunity for the long-term hold. However, the first resistance at 50% Fibs must be taken out for the uptrend to start.

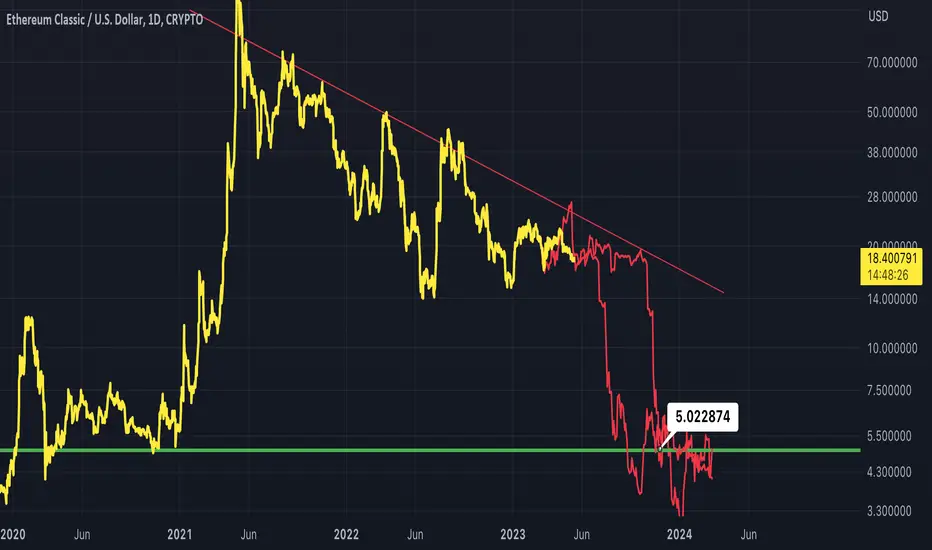
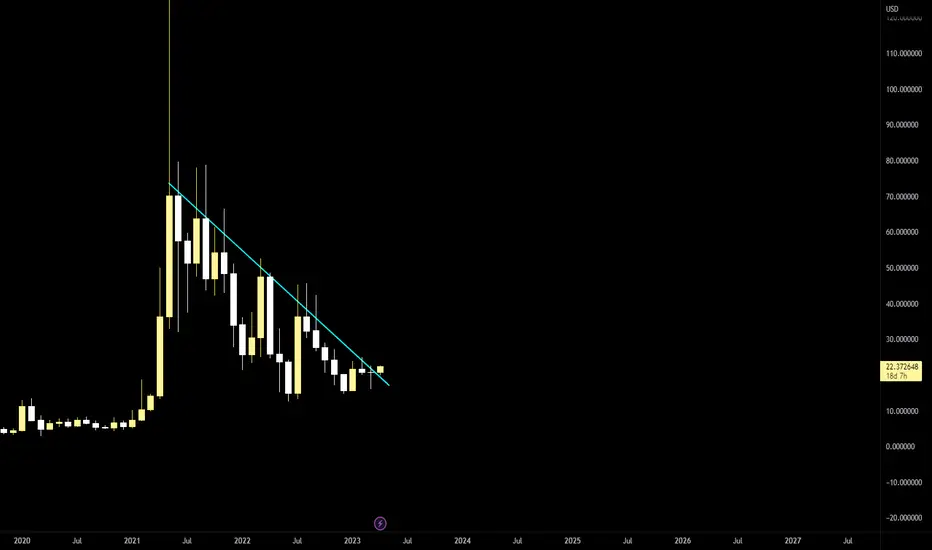
ETCUSD - Bitcoin FractalA fractal from bitcoins post 2017 bear run
I noticed the similar downward bear period leading to this ultimatum of a large drop
This drop on BTC occurred at December 2018
The horizontal line is a very strong support
ETCUSDTIt is expected to drop to a faded square in order to complete wave C and end three bearish main waves
ETCUSD - BULL FLAG Double bull flag have been seen with bullish divergence and new higher high and higher low have been formed
✴️Ethereum Classic Will Also Recover (222% Possible Higher high)Volume is one of the strongest indicator and can help you clear any doubts.
Ethereum Classic (ETCUSD) hit a higher low compared to June (5 months ago) but how to know if it will recover here or continue lower?
Here we use the volume indicator.
Notice how trading volume continues to diminish, it goes lower and lower.
That's your signal.
It means the current trend is losing strength.
Since the mid-term trend is bearish, as it loses strength things can turn and ETCUSD reverse.
Higher lows can lead to higher highs.
Over 222% possible on a higher high.
Easy 50% to 80%+ on a bounce.
You still need a plan to trade and your own research.
The support levels are marked with blue on the chart and can be used as a stop-loss.
These analyzes are not intended as financial advice.
Thank you for reading.
Remember to boost 🚀
Namaste.

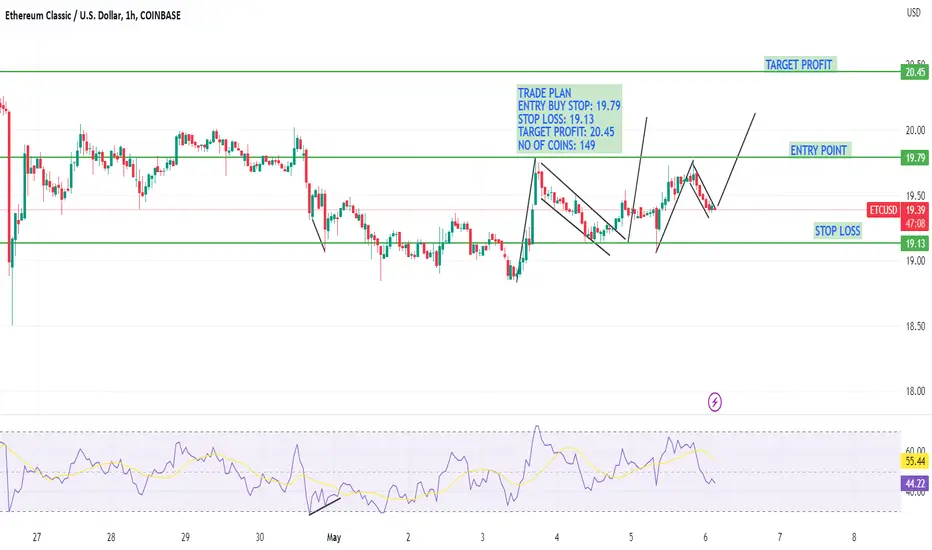
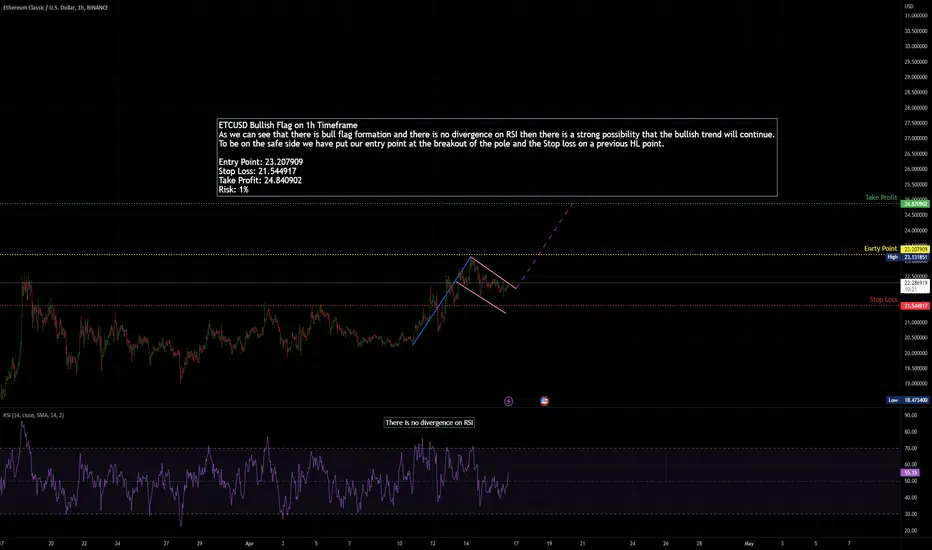
ETCUSD Bullish Flag on 1h TimeframeETCUSD Bullish Flag on 1h Timeframe
As we can see that there is bull flag formation and there is no divergence on RSI then there is a strong possibility that the bullish trend will continue.
Would you Buy this? The idea here is simple, Long people.Going to start to scale in here. I was self educating back in 2018, about sept. Needless to say as a new trader i thought I could just scalp up and make
a fortune, LOL, after my 4th year now I know what to do!!! Just buy it and leave it alone. Thats it and that's all. If you are new and reading this please save yourself
a few years of tuition and buy it and walk away, that's it seriously!!!
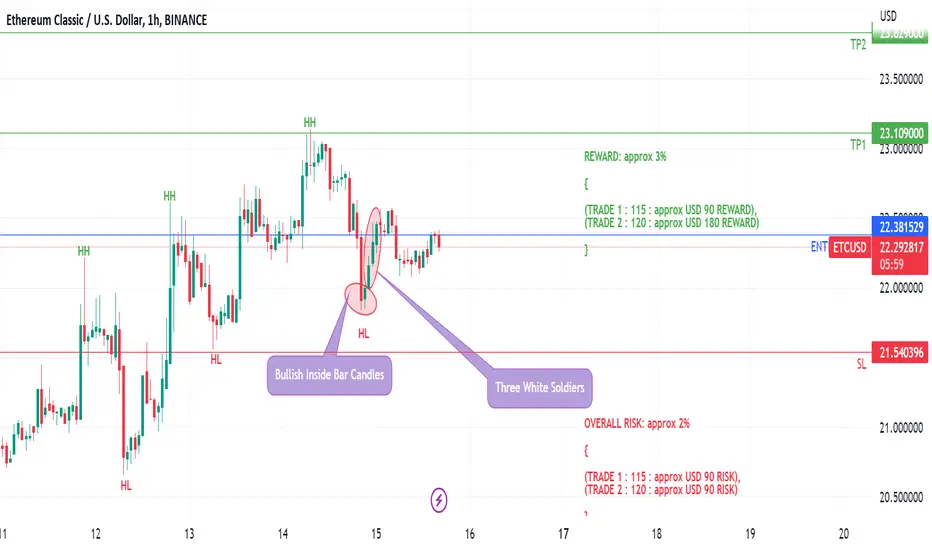
ETCUSD BULLISH TREND PRICE PREDICTIONETCUSD is making a series of HHs and HLs aligned with the concept of DOW THEORY and I believe this chart will continue its bullish trend and generate decent profits for me. Additionally, bullish candlestick patterns such as Bullish Inside bar Candles and Three White Soldiers are forming after the recent HH showing buyers/bulls are currently in control of the market making a strong case for continued bullish movement.
My entry point for this trade is 22.381.
SL is set at 21.540 and my TP is set at 23.109.
To take advantage of this rising trend, I have applied another trade but this time TP 2 is set at 23.829 which gives me a risk-to-reward ratio of 1:1.5 for my 2 trades.
OVERALL RISK: approx 2%
{
(TRADE 1 : 115 : approx USD 90 RISK),
(TRADE 2 : 120 : approx USD 90 RISK)
}
REWARD: approx 3%
{
(TRADE 1 : 115 : approx USD 90 REWARD),
(TRADE 2 : 120 : approx USD 180 REWARD)
}
ETCUSD [3h] On the right track push forwardOn the way of 27 usd. Etherium Shanghai update reaction will decide if go further or pull back...
Always be your advisor!!!

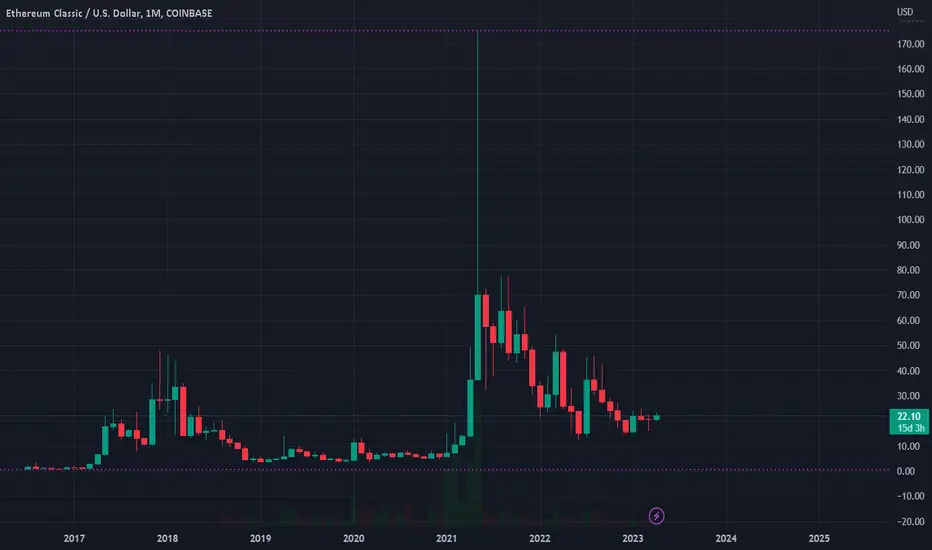
Ethereum classic has bottomed- monthly dragonfly doji is a very strong sign
- while it is unclear if this is a macro or a market cycle bottom it is likely ETC reaches at least 40$ in the mid-term
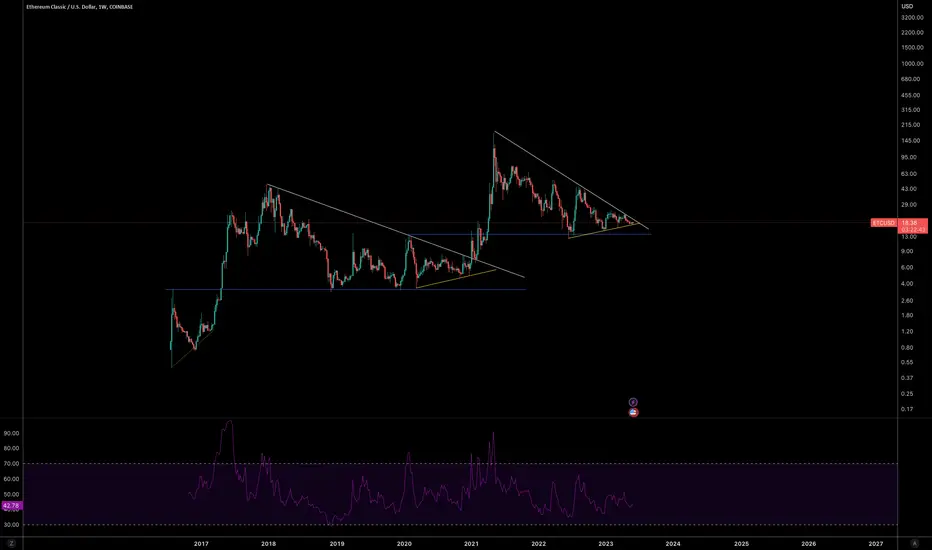
ETC (Ethereum Classic) Channel of Simple ImaginationDoesn't take a rocket scientist to see where this one is headed. Bounce off the bottom to the top, again, and again.
Not advice, but just pointing out the obvious.
Don't forget, all forms of money through all time, was made for everyone, not only the people who sought to understand it and control you with it.
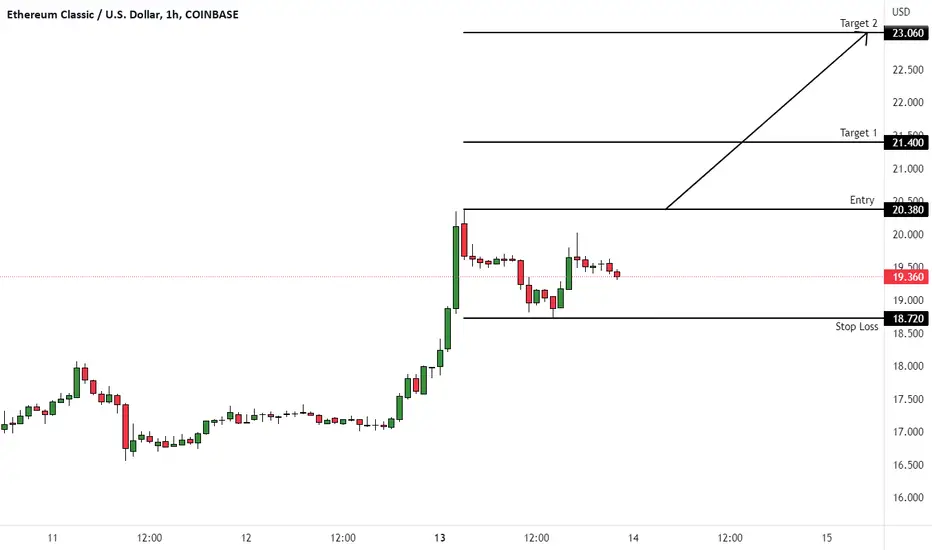
ETCUSD (1H) - Bullish breakoutHi Traders
ETCUSD (1H Timeframe)
The market is in an uptrend, and we are waiting for an entry signal to go LONG above the 20.38 resistance level. Only the downward break of 18.72 would cancel the bullish scenario.
Trade details
Entry: 20.38
Stop loss: 18.72
Take profit 1: 21.40
Take profit 2: 23.06
Score: 8
Strategy: Bullish breakout
#ETCUSD - A Small but Profitable Short?Having just locked in 10% with our Long trade on #ETC we're looking at a small but well-worth-doing Short trade, expected returns of around 10%.
We've seen the price test and get rejected several times by the upper resistive trend line and now we seem to be trapped in a wedge formation - the price may trend within this range for a small time but given Crypto market sentiment after the recent Bull run, we can see some volatility coming!
We don't see massive gains on this one, but 10% is 10%!
If you enjoyed or agree with this idea - drop us a comment, like & follow! :)

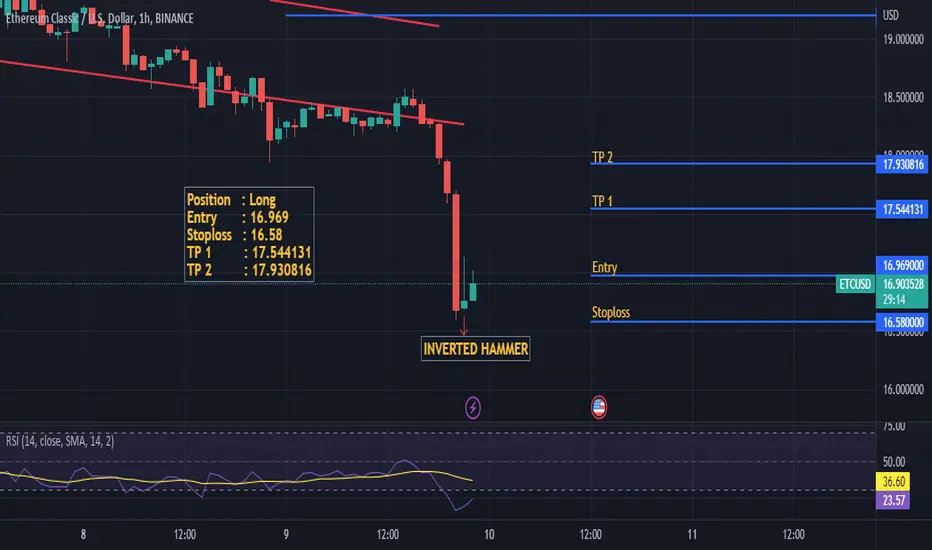
ETCUSD - BULLISH REVERSALETCUSD possible bullish reversal because it printed a bullish inverted hammer candle
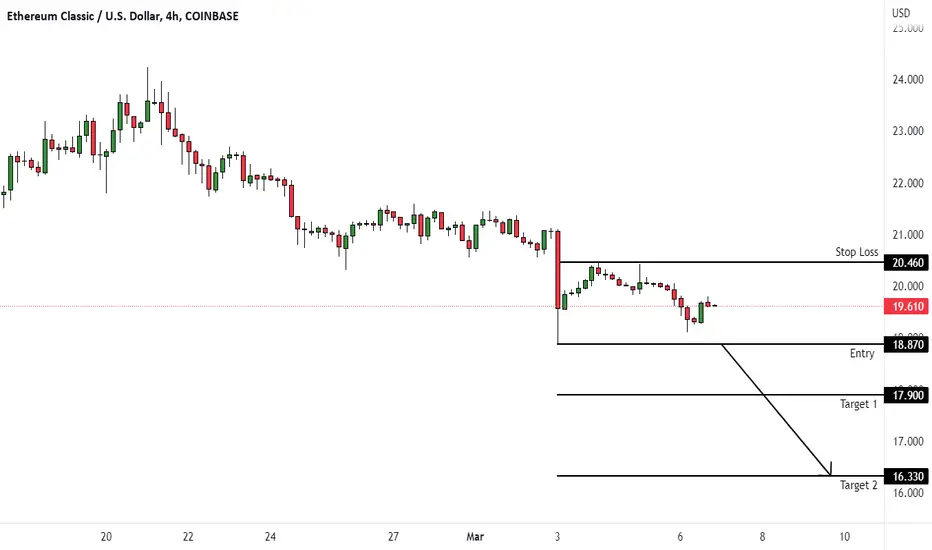
ETCUSD (4H) - Bearish breakoutHi Traders
ETCUSD (4H Timeframe)
The market is in a downtrend, and we are waiting for an entry signal to go SHORT below the 18.87 support level. Only the upward break of 20.46 would cancel the bearish scenario.
Trade details
Entry: 18.87
Stop loss: 20.46
Take profit 1: 17.90
Take profit 2: 16.33
Score: 7
Strategy: Bearish breakout
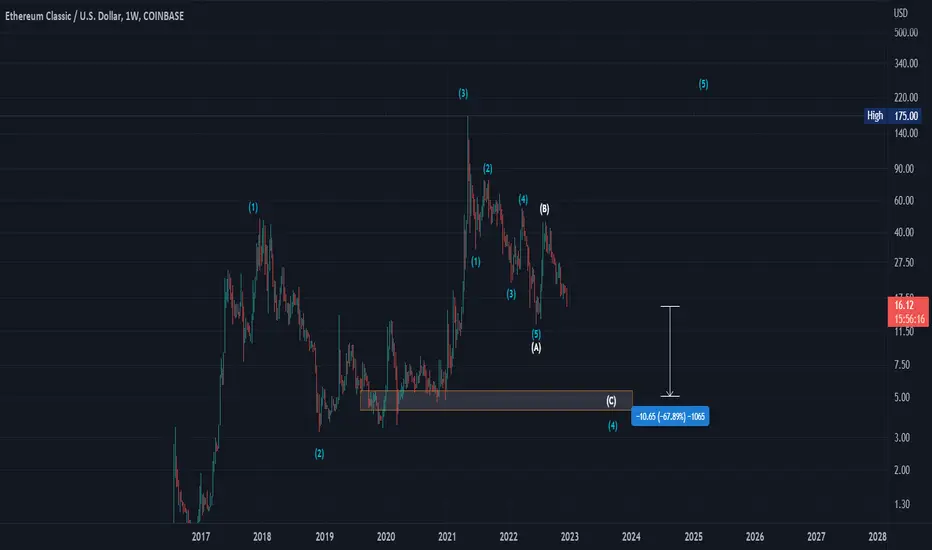
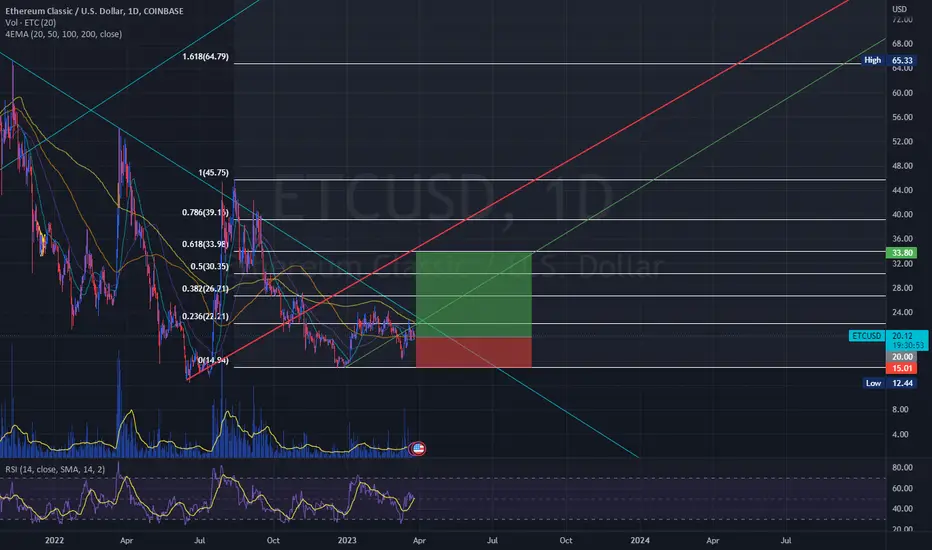
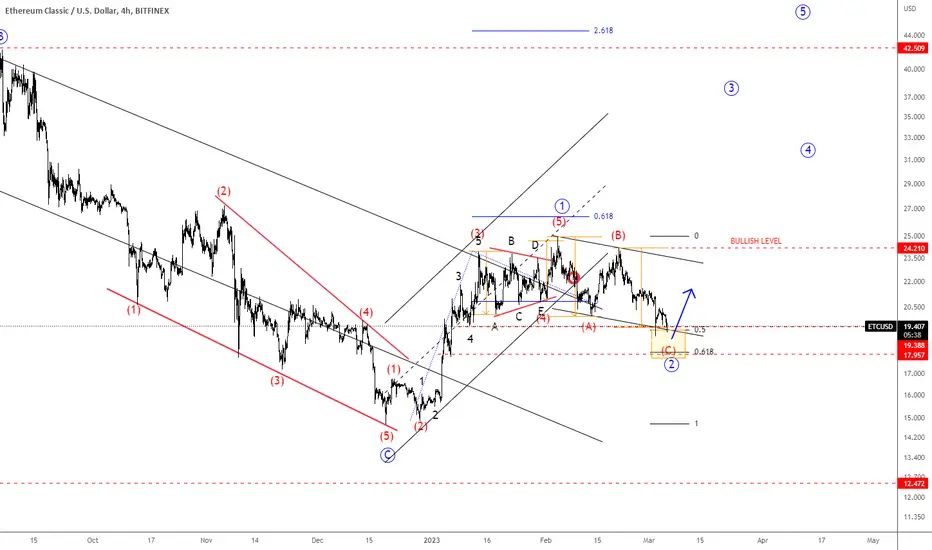
ETCUSD Is Moving Into A Support AreaETCUSD can be ready for more upside as market can be forming a new bullish setup formation based on Elliott wave theory.
Ethereum Classic with ticker ETCUSD made an impulsive five-wave recovery since December 19th of 2022, when we spotted a completed ending diagonal/wedge pattern within wave C of an A-B-C correction. A five-wave recovery indicates a change in the trend from Elliott wave perspective, so be aware of more upside in March.
We can see that price is currently nicely slowing down, making a three-wave (A)-(B)-(C) correction for wave 2 after we noticed a five-wave rally into wave 1 from the previous lows. So, keep an eye on strong support here around 19-17 area, from where we expect a bullish continuation above 25.10 while price is above 14.80 low. So as long this level is not breached we expect a new turn up.
I hope to see you in webinar today here on tradingview. Link can be find below.
ETCUSD BEARISH TREND ETC USD
My entry is based on three black crows candlestick patterns. ETCUSD is making a series of lower highs and lower lows.

ETCUSD [4h] just turn longETCUSD Long time stayed flat and just turn green on chart. But 17.27 pull back in possibility before Monday markets opening!
Smartly advice yourself!
