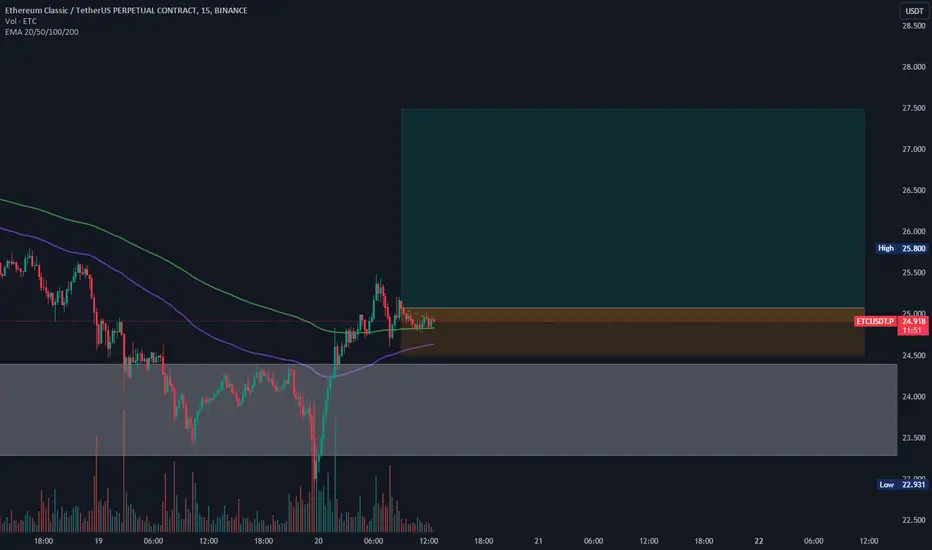
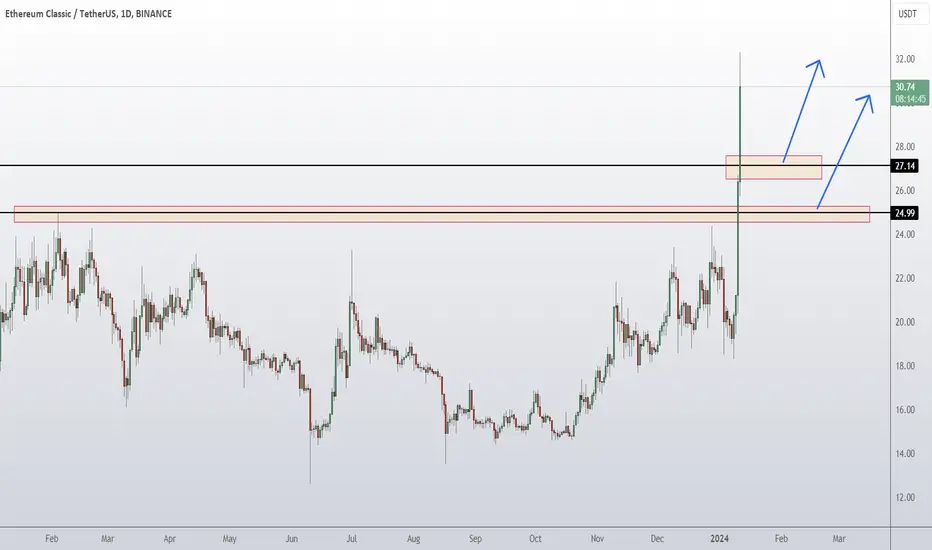
Long ETCIn the rapidly evolving landscape of cryptocurrency markets, the ETCUSDT (Ethereum Classic against the US Dollar) pair is currently capturing the attention of investors. Here are some insights into the investment opportunities for this pair:
Entry: 25
Stoploss: 24.502
Take profit: 27.491
Risk Warning:
Before engaging in any investment activity, investors should also consider potential risks that may arise. Here are some points to note:
Market Volatility: Cryptocurrency markets often experience significant and unpredictable volatility. Such fluctuations can impact the price of ETCUSDT and result in losses for investors.
Fundamental Factors: Events such as global news, economic changes, or even shifts in the economic landscape can have a substantial impact on cryptocurrency prices.
Profits and Losses: Investors should remember that all investments come with risks. Setting profit targets is essential, but it's equally important to acknowledge the potential for losses.
Risk Management: Proper risk management through the use of stop-loss orders and setting reasonable profit expectations is key to protecting investment capital and maintaining stability throughout the investment process.
Before making any investment decisions, investors should conduct thorough research, listen to expert opinions, and, most importantly, invest only what they can afford to lose.
ETCUST trade ideas
#ETCIn the daily time, it is moving in an ascending channel, which, if it maintains the $21.85 area, it will have the ability to break the resistance and reach the ceiling of the channel. Otherwise, it will correct to the floor of the channel at $19.

ETCUSDT EtcUsd has entered a perfect buy zone. accumulation should be done heavily as breakout is soon to happen.
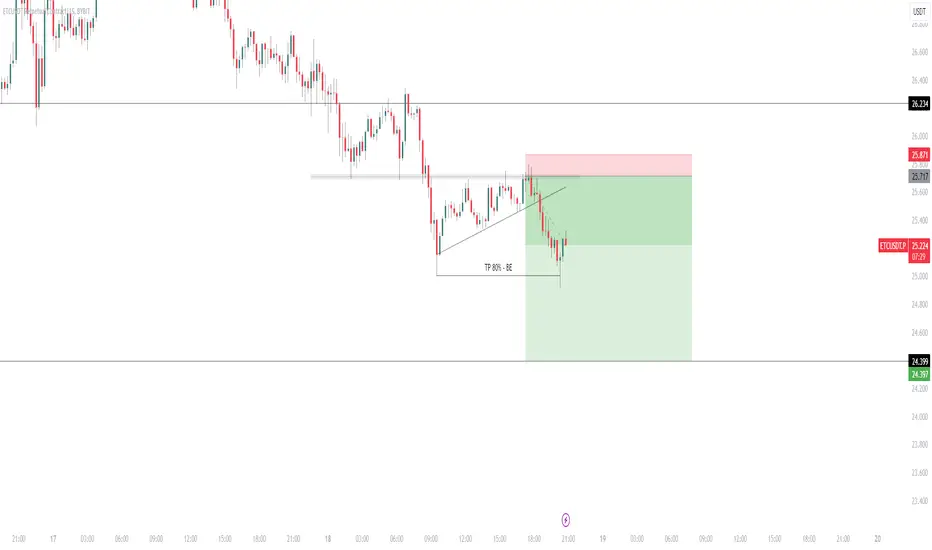
Short Trade on ETC/USDTOpened a short entry on resistance, 80% Take Profit on Previous low, moved Stop Loss at break even.
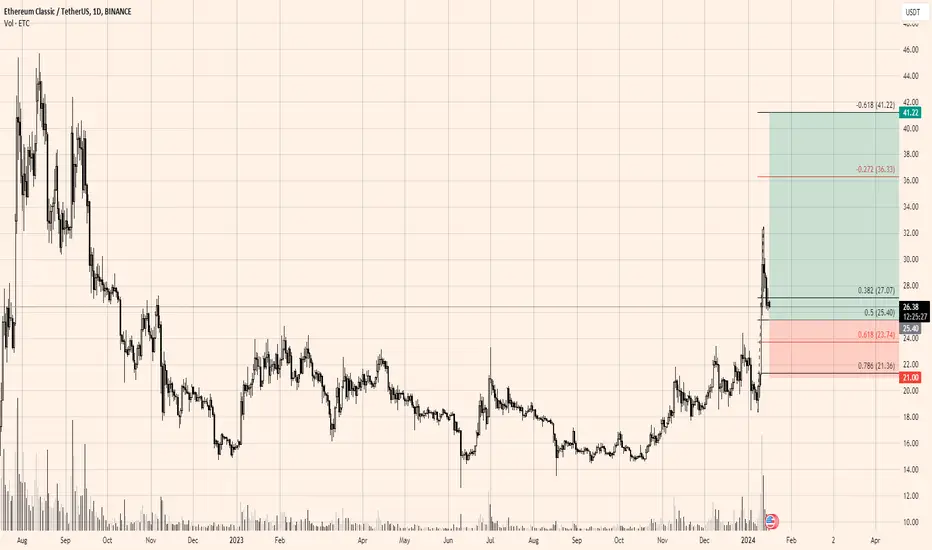
ETCUSDTThe price is trading around 26.40, we saw an impulse in the price and from that impulse, 50% Fib retracement is placed around 25.40 which acts as support level. Long position can be considered upon the confirmation. 32.45 acts as resistance level which it breaks then price can test 36.33 and 41.22 level. Stop loss is placed below 21.
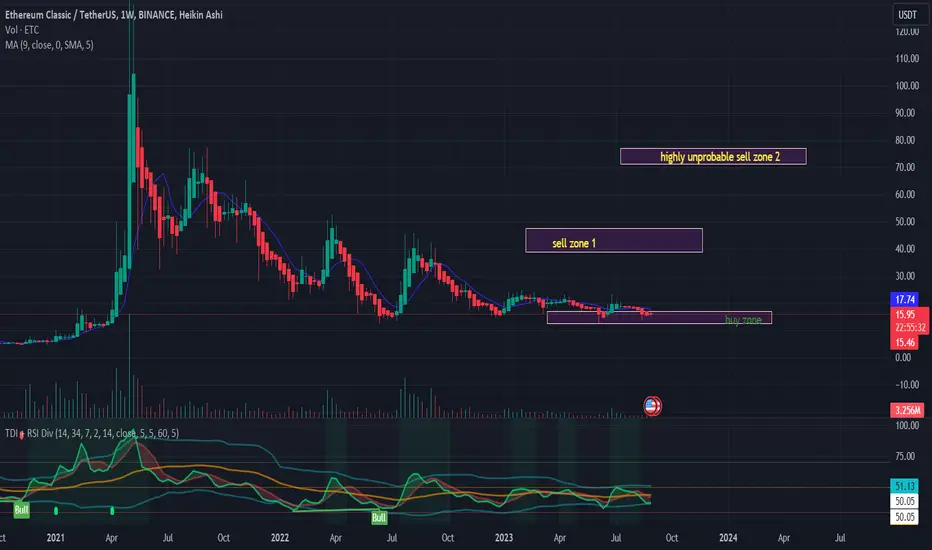
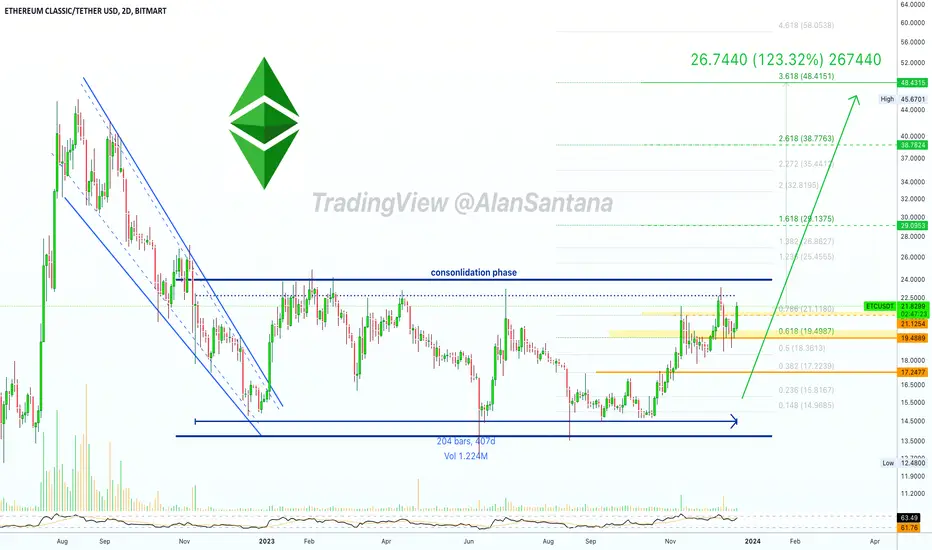
✴️ Ethereum Classic Ultra-Bullish Signal ($48 Target Or Higher)Ethereum Classic has been through the longest consolidation phase in its history —The longer the consolidation phase, the stronger the move that follows.
Seeing that ETCUSDT has been printing higher lows since June and is full time bullish, this indicates that a major bullish move is in the making.
That's it, plain and simple.
👉 We expect this move to reach $48 or higher. This can happen fast once the consolidation box/range breaks.
We will keep you updated as the chart moves and the pair grows.
Remember to do your own research to be better prepared.
Thanks again for your support... See you on the next one.
Namaste.
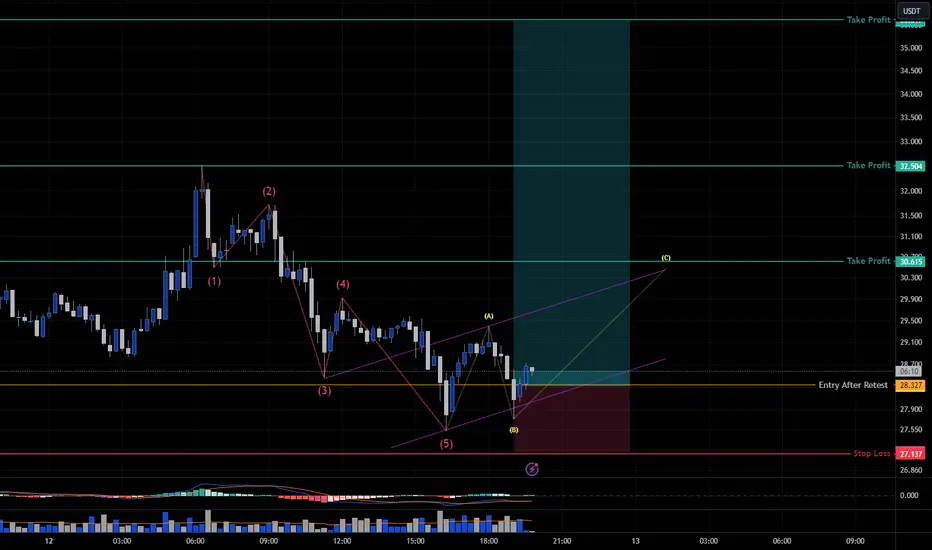
ETC - Long - Elliott Wave 15M Wave 5 formed and ABC in process. Fibonacci zone utilized for target projection with stop loss placed below 5. Let's see if we can get some momentum and scoot on above 30!
ETCUSDT(Ethereum Classic) Daily tf Range Updated till 13-01-24ETCUSDT(Ethereum Classic) Daily timeframe range. good ol etc tried to cross 31.37 but failed twice, staying above 23.32 can led it to more chances. price action is pretty reasonable here. depend on how it holds up.

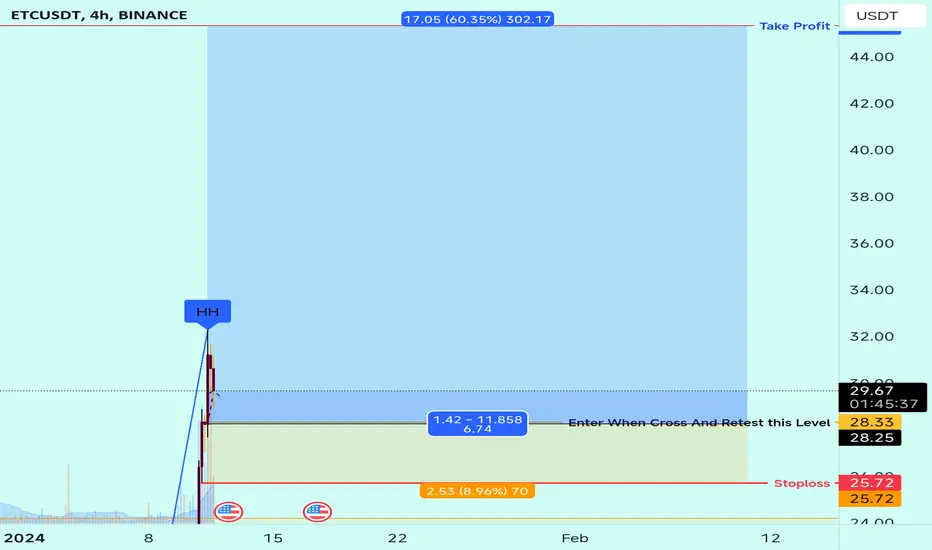
it's time to going up for ETCUSDTbefore buying, please check for being sure about your opinion about this CRYPTOCURRENCY!!!
(in every target you want, closed the position but our target is the third one)
*Guy's the entry place is importance things in enter in a position and be careful do not going up your leverage over 7x ,all things it's about risk management*
*************************************************
if you want to enter in this position:
Enter Price: 29.50
Target1: 30.62
Target2: 32.25
Target3(Final Target): 33.58
Stoploss: 27.6
*************************************************
Guy's if this idea was useful and it was intresting for you please follow for more
please do comment and like my idea
If you like my idea show me in comment section
doing and living in the best quality
thanks of all of you dear's ;)


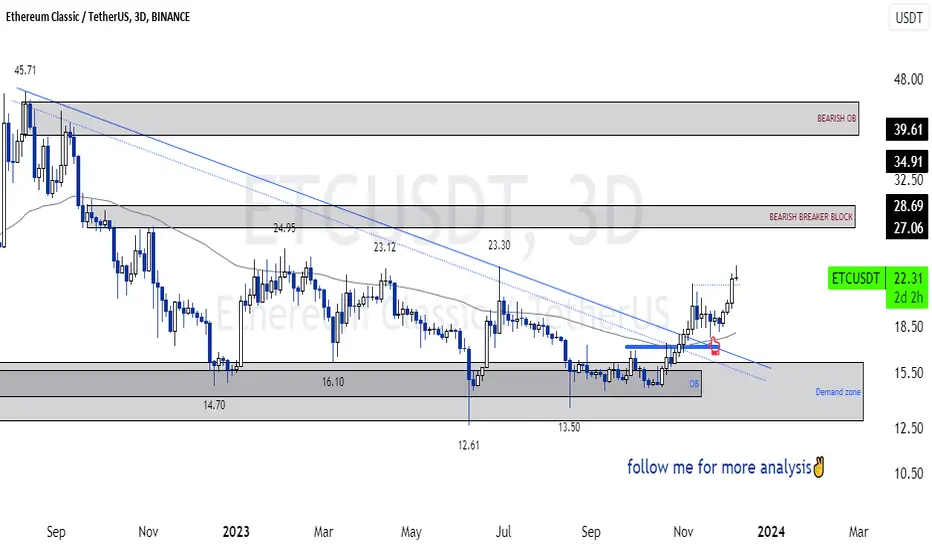
SasanSeifi 💁♂ ETC / 3DAY⏩ 28$Hey everyone,
As you can see in the 3-day timeframe, the price has been rising from the demand zone and bullish order block. It broke the downtrend line and retraced back to the 22-dollar price range. It is currently trading at 22.30 dollars.
In the medium term, the price may continue to rise to the BEARISH BB zone.
Here are two scenarios we can consider:
1 The price could rise from the 22-dollar range.
2 The price could range between 21 and 20 dollars for a while, and then rise to the target ranges of 27 and 28 dollars.
If the price rises, it will be important to see how it reacts to the BEARISH BB zone. This will help us to understand the continuation of the trend.
⭕On the other hand, if the price breaks below the 20-dollar range and consolidates, it may be facing a correction.
I hope this helps!
🔵Remember, always conduct your analysis and consider other factors before making any trading decisions. Good luck!"✌️
❎ (DYOR)...⚠️⚜️
Sure, if you have any more questions or need further clarification, feel free to ask. I'm here to help!
if you found my analysis helpful, I would appreciate it if you could show your support by liking and commenting. Thank you!🙌✌
ETC short idea hello Traders, here is the full analysis for this pair, let me know in the comment section below if you have any questions, the entry will be taken only if all rules of the strategies will be satisfied. I suggest you keep this pair on your watchlist and see if the rules of your strategy are satisfied. Please also refer to the Important Risk Notice linked below.
ETC Embrace the Future of Finance: Invest in Crypto Today 💰**Ethereum Classic (ETC) Fundamental Analysis**
**Overview**
Ethereum Classic (ETC) is a hard fork of the Ethereum blockchain that occurred in July 2016. The fork was triggered by a hack that resulted in the theft of 3.6 million ETH, the native token of Ethereum. ETC supporters believe that the blockchain should not have been tampered with after the hack, while Ethereum proponents believe that the fork was necessary to protect the integrity of the network.
**Fundamentals**
ETC is a decentralized platform that allows for the development of smart contracts and decentralized applications (DApps). The ETC blockchain is secured by a proof-of-work consensus mechanism, which means that miners compete to solve complex puzzles to validate transactions and add blocks to the chain. ETC has a market capitalization of approximately $4.5 billion and a circulating supply of 145 million tokens.
**Recent News**
* **ETC Price Surges 46% in 24 Hours**
ETC price has surged by over 46% in the past 24 hours, reaching a new all-time high of $31.15. The sudden price increase is likely due to a combination of factors, including increased institutional interest, positive news about the ETC ecosystem, and a broader rally in the cryptocurrency market.
* **ETC Foundation Launches Funding Initiative for DApp Development**
The ETC Foundation has announced a new funding initiative to support the development of DApps on the ETC blockchain. The initiative will provide grants to developers who are creating innovative and useful applications for the ETC ecosystem.
* **ETC Price Prediction: Analysts Expect Further Growth**
Several analysts are predicting that ETC price could continue to rise in the months and years to come. The ETC Foundation's funding initiative, as well as the growing adoption of decentralized finance (DeFi) applications on the ETC blockchain, are expected to contribute to the price growth.
**Disclaimer**
Please note that this is not investment advice. Cryptocurrency prices are volatile and can fluctuate significantly. Always do your own research before investing in any cryptocurrency.
**In addition to the above, here are some additional things to keep in mind about ETC:**
* ETC is a smaller and less liquid market than Ethereum. This means that ETC prices can be more volatile than Ethereum prices.
* ETC is not as widely adopted as Ethereum. This means that there are fewer DApps and other applications built on the ETC blockchain.
* ETC has a history of security vulnerabilities. In 2016, the ETC blockchain experienced a 51% attack, which allowed hackers to double-spend ETC tokens.
Overall, ETC is a promising cryptocurrency with a strong team and a loyal community. However, there are also some risks to consider before investing in ETC. Investors should do their own research and carefully consider their risk tolerance before making any investment decisions.
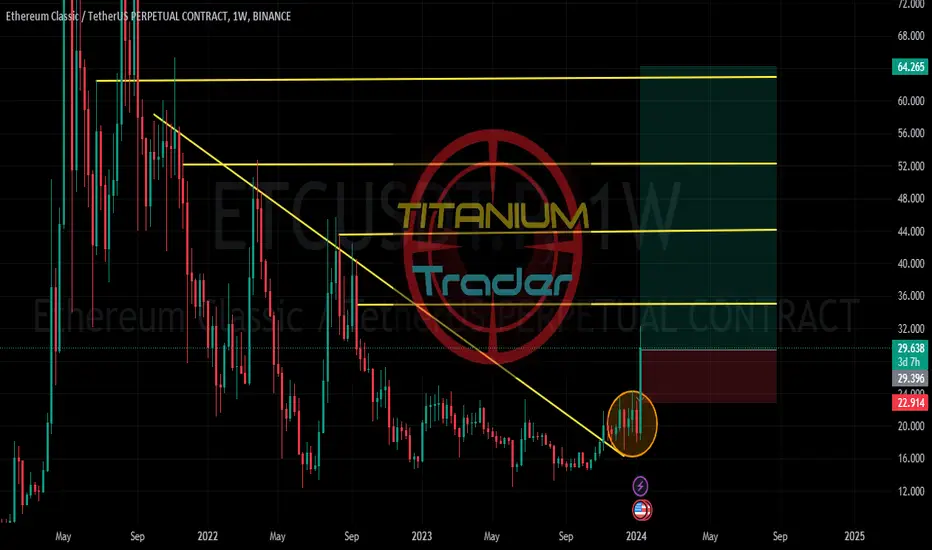
ETC/USDT 1W Bullish Long AnalysisAfter BITCOIN SPOT ETF approval, ETC has broken descending channel and seems to be bullish.
targets 35, 44, 52, 62
Invalid below 22
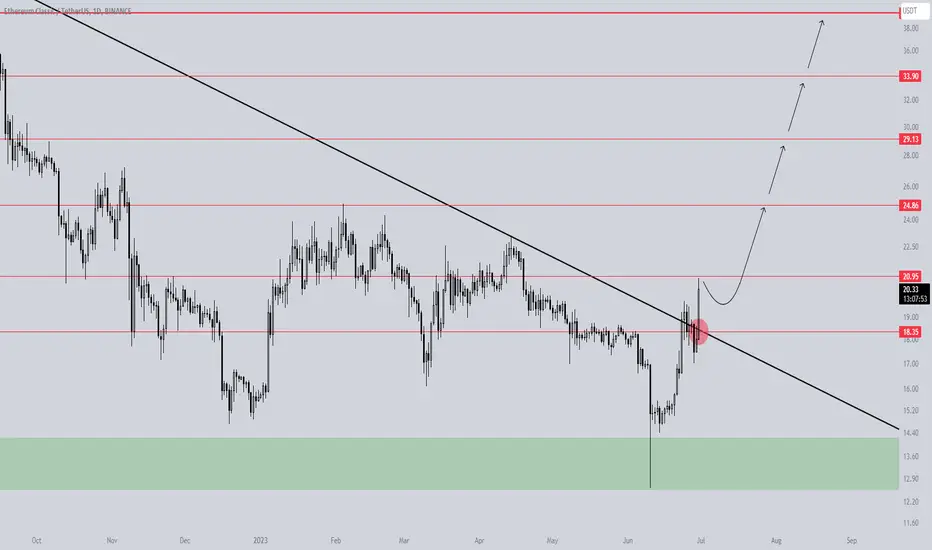
Ethereum Classic(ETC) Breaks Long-Term Downtrend Line
* 1D
ETC broke through a long-term downtrend line that has continued since May 2021, so it is likely to continue bullish.
Although it is currently facing resistance around $20.95, it is likely to rise further.
TP can be set at $24.86 / $29.13 / $33.90 / $39.42 / up to $44.48.
Ethereum Classic ETC Coin Price Prediction🔥 Price on the DAILY chart might come at these support area and we might get a potential bounce🔥
Potential bounce areas for Buying 27.30 and 25.22
👉 Follow me for More Real Time Opportunities.
Share your Thoughts if you have any?
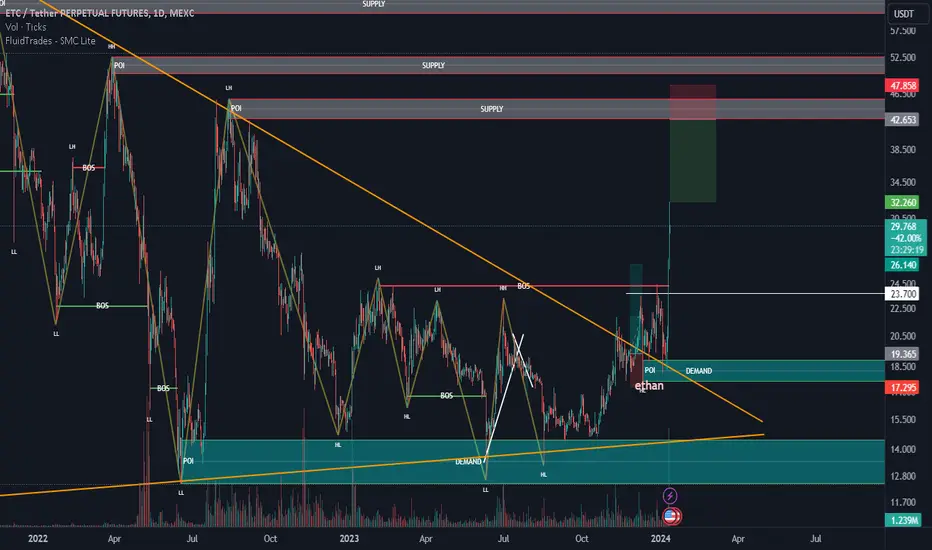
🌐🚀 Ethereum Classic (ETC) Analysis 📊💹🔓 Breaking Out of Range:
Ethereum Classic (ETC) is breaking out of its range dating back to October 2022.
📈 Bullish Scenario:
If bulls secure the $27.30 level, there's potential for a push into the $40, where the next resistance lies.
📉 Bearish Scenario:
If it's a bull trap, a potential downside could lead to a crash into the $18 region.
⚖️ Ethereum Ecosystem Movement:
Ethereum Classic's breakout signals a potential shift in the Ethereum ecosystem dynamics.
📅 Timing Consideration:
Waiting for confirmation and retesting of the region above the range rather than chasing the move.
📣 Conclusion:
ETC's breakout brings the potential for a significant upward movement.
The $27.30 level is crucial for bullish continuation.
Caution advised, and waiting for a retest may provide a more strategic entry.
#ETCAnalysis #CryptoMarket #EthereumClassic
ETC/USDTIn another successful trade update, Ethereum Classic ( BME:ETC ) has convincingly surpassed the identified zone with substantial volume, progressing steadily toward our predefined targets.
BTC ETF ETH ETF Blackrock #Cryptocurency #Ethereum #ETFApproval

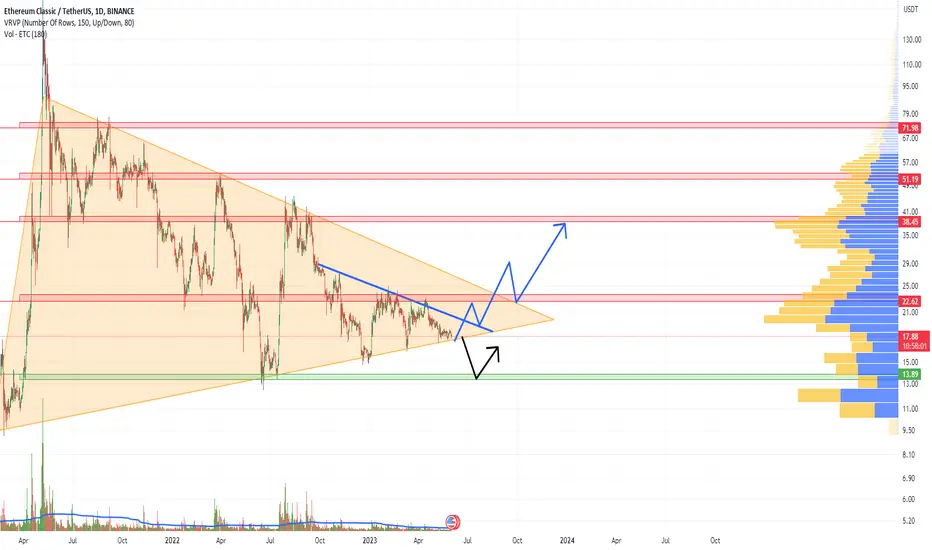
ETCUSDT 1D LONG📈Hi all. ETC forms a triangle throughout the year. I am considering going long when breaking/retesting a small triangle. Or a set to the spot with an addition from the lower level.
Elliott Waves For ETCUSDTElliott Waves for ETCUSDT
Entry level : 22~26 $ for specified target.
New uptrend wave is started.
Buy in correction with risk management
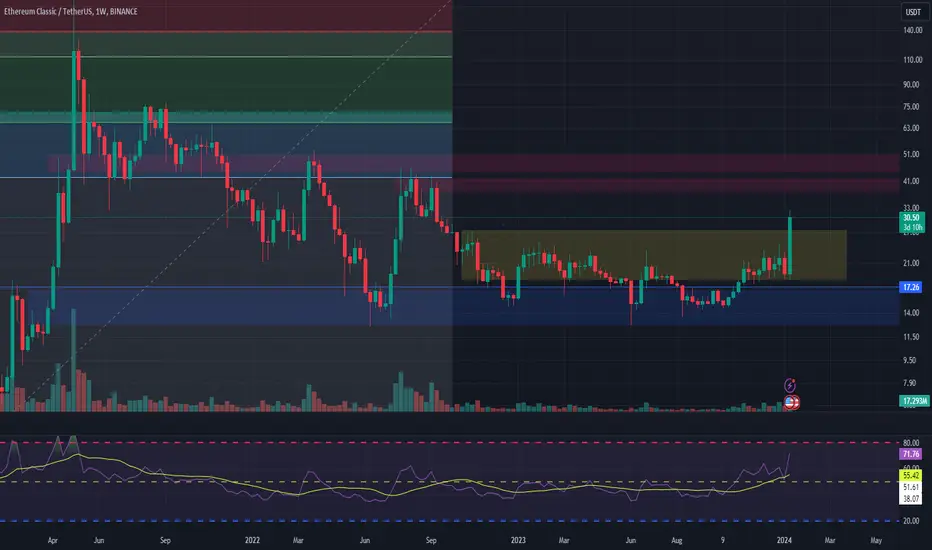
How is ETC?On the weekly time frame I was checking the structure of ETC
Examining the ETC waveform, I noticed that it is inside a large diametric that now seems to be about to complete its F wave
After the completion of wave F, we will enter wave G, which can end in the green zone of this wave and enter the next upward phase.
For risk management, please don't forget stop loss and capital management
Comment if you have any questions
Thank You

Brief Analysis——ETCLet’s get the long-awaited BTC ETF approved. This marks a new era for cryptocurrency. More funds from U.S. entities will flow into the crypto market.
Although all 11 BTC ETFs have been approved, the SEC’s attitude does not appear to have changed. The reason we think so is that the SEC deliberately waited for the U.S. stock market to close before approving the BTC ETF, and when Gensler approved the BTC ETF, he stated that the approval of the ETF was only based on pressure from the court and did not support or recognize the view of BTC. Of course, this will not affect subsequent capital inflows, but regulation may mark some tokens as unregistered securities again to clean up the crypto market.
Another special thing is that ETH saw a significant increase after the BTC ETF was approved, while BTC did not. This may mean that the market has turned its back on BTC ETFs and begun pricing Dencun.
The token we will analyze today is ETC. As a token that will be halved in 2024, let’s take a look at its recent performance.
Compared with other tokens, ETC has performed generally during this round of rise. Before yesterday, the maximum increase was less than 70%. With the gains yesterday, ETC is out of the 2023 range. This will have a positive effect on subsequent increases. Judging from the indicators, ETC has entered a bullish trend. On the WTA indicator, we can see that in the previous waves of rise, the inflow of whales represented an increase, and the outflow represented a callback. But the trend is closer to a fluctuation. Yesterday's rise in ETC was supported by a lot of whales.
To sum up, we believe that ETC’s bullish trend is not over. Judging from the rise throughout 2023, As one of the few tokens with the halving concept and POW label, ETC has a greater possibility of rising.
Disclaimer: Nothing in the script constitutes investment advice. The script objectively expounded the market situation and should not be construed as an offer to sell or an invitation to buy any cryptocurrencies.
Any decisions made based on the information contained in the script are your sole responsibility. Any investments made or to be made shall be with your independent analyses based on your financial situation and objectives.

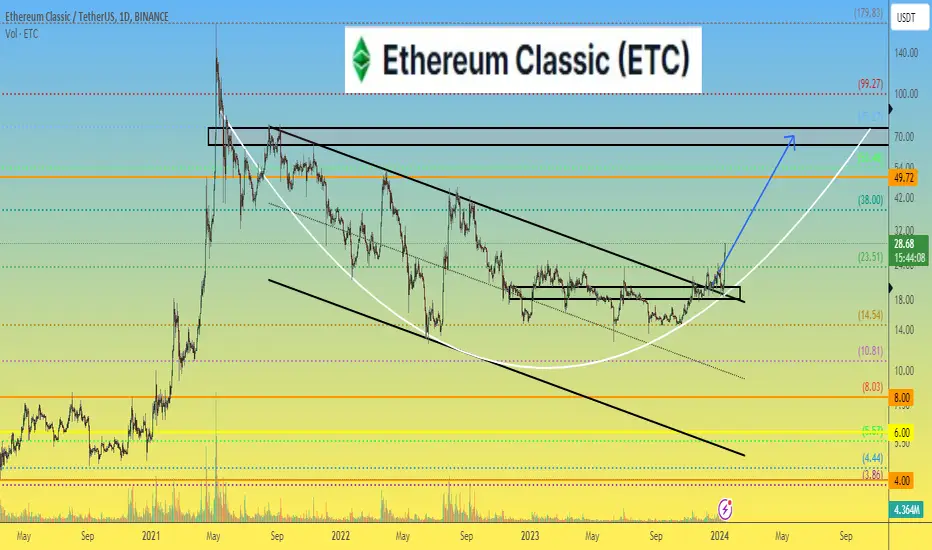
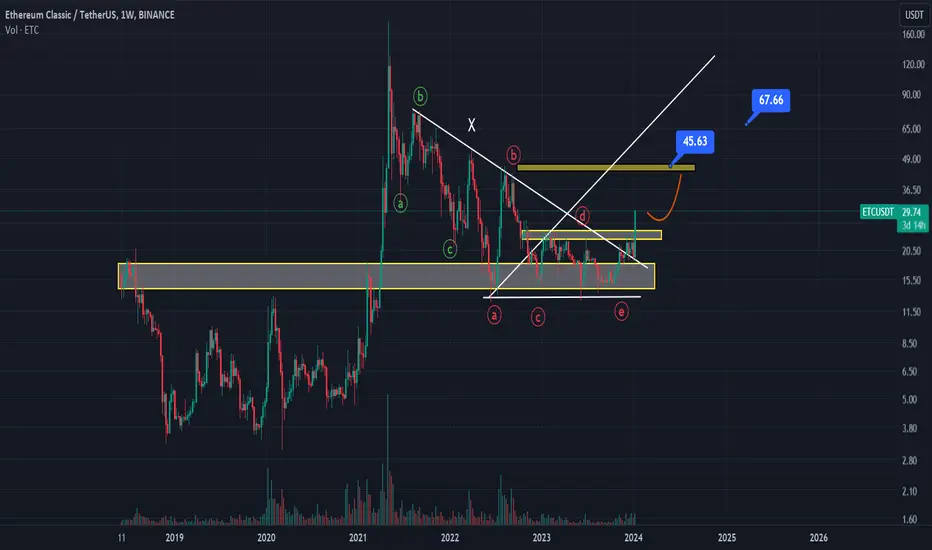
Ethereum Classic ETC price is starting to grow?Looking at the ETCUSDT chart, we can assume that the almost 3-year downward trend in the ETC price is coming to an end.
As long as the ETCUSD price is above $18-20 , it is in an upward trend.
The medium-term target is $65-75 per 1 Ethereum Classic
_____________________
Did you like our analysis? Leave a comment, like, and follow to get more