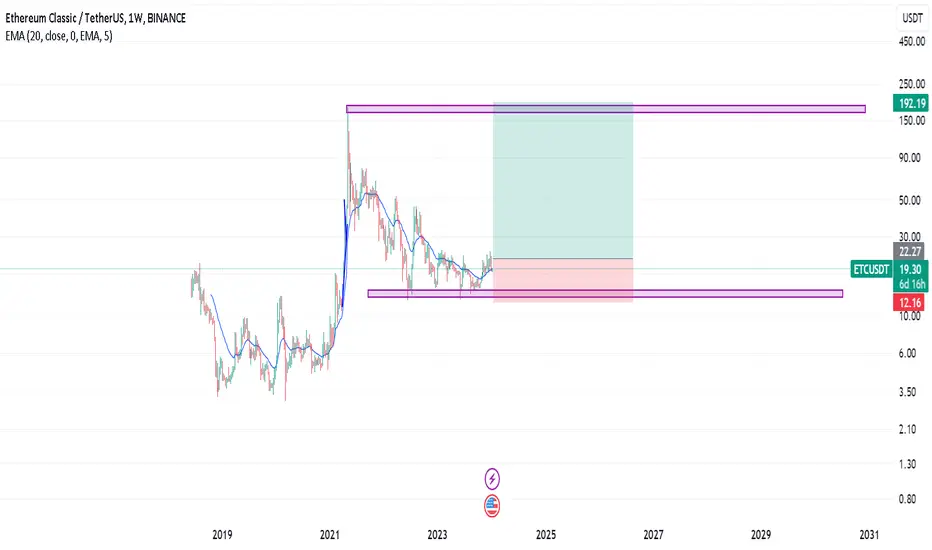
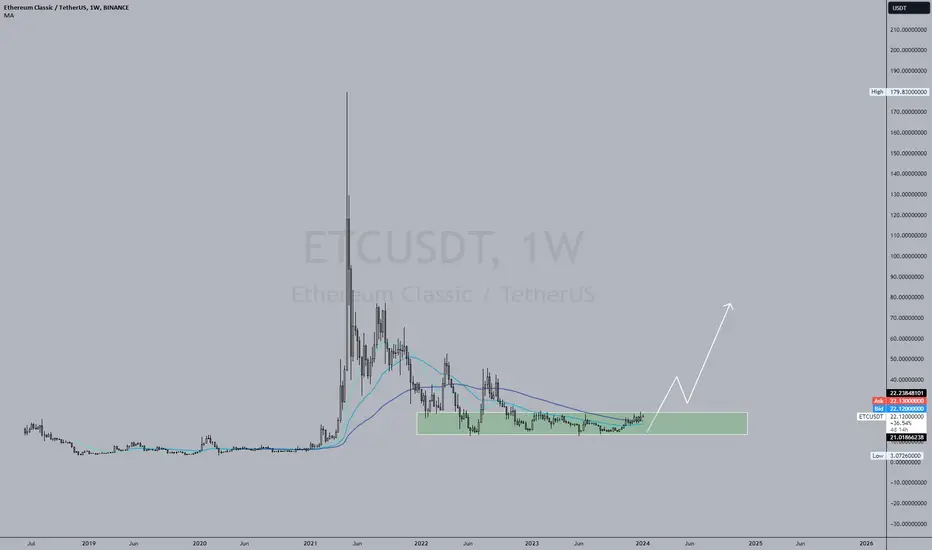
ETCUSDTEthereum Classic is at an important support level, and after breaking the resistance of $2, it will have the possibility of growing to higher prices such as $100 and $180. After breaking the resistance of $23, you can enter a buy signal.
ETCUST trade ideas
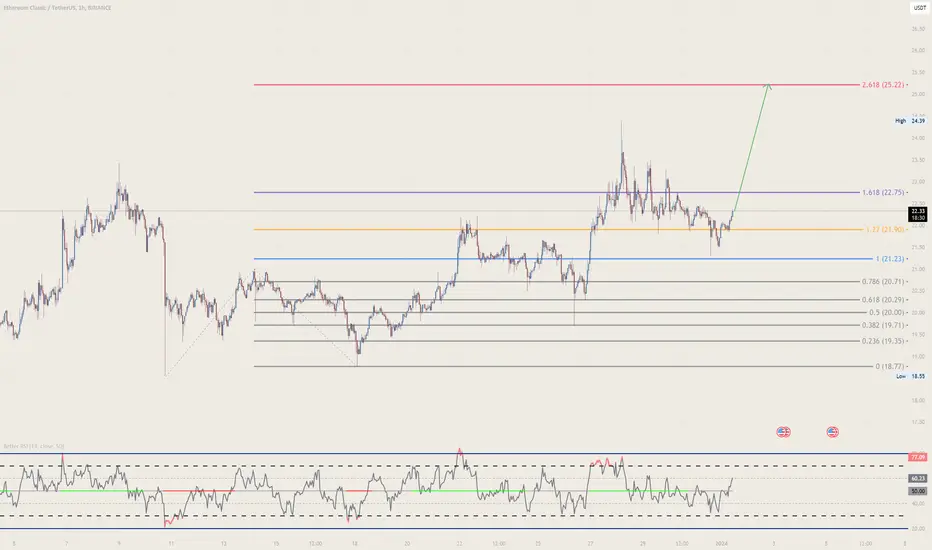
etcI am waiting for the reaction to the green lines. At the moment, a little caution is necessary for buying. Important resistances are marked with red lines

ETC ✅If 20$ and green line supported, we could came back to the rally and touch 25$ 45$ in the short time
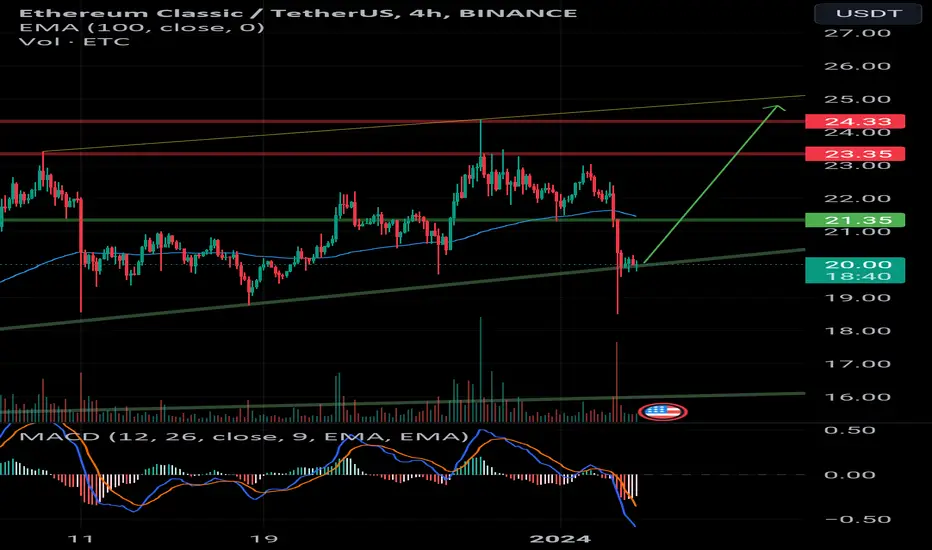
ETC/USDT 4H ChartI invite you to review the ETC chart on a four-hour interval. We will start by defining, using the blue lines, the upward trend channel from which we tried to exit at the bottom. Locally, a yellow downward trend line has formed.
Let's now move on to marking support areas for the price and here, after unfolding the trend based fib extension grid, we can see that the price with dynamic movements returned to the support zone from $20.56 to $19.52, while leaving the zone at the bottom may result in a strong decline even to the vicinity $16.50.
Looking the other way, we can similarly determine the resistance areas that the price must face. And here we can see the $20.76 level again as resistance, after which we can see increases towards the strong resistance zone from $23.12 to $24.38 just at the upper border of the previously mentioned channel.
Looking at the RSI indicator, we can see that we have approached the lower limit, which could have slowed down the decline, but there is still room for recovery, while the STOCH indicator shows a quick rebound from the lower limit, which gives us energy for another price drop.

ETC etc is going down. Please take a look on the chart, it broke the support. will be in the zone of
$15
$ETCPreparing to depart from accumulation zone soon.
Trade accordingly and use proper risk management parameters.
#ETC#ETCUSDT
the market has finally broken out of a symmetrical triangle. This is a bullish signal, and prices are expected to rise to 170 $ in the next six months to one year.

ETC DESCENDING TRIANGLE 😎🔺️😎🔻😎🔺️😎Hi dear traders
As you saw in the previous analysis, we got full profit
The price has formed a descending triangle.
If the pattern is confirmed, we expect to achieve the specified goals
Let's see what happens
This is not financial advice ( DYOR )
Good luck
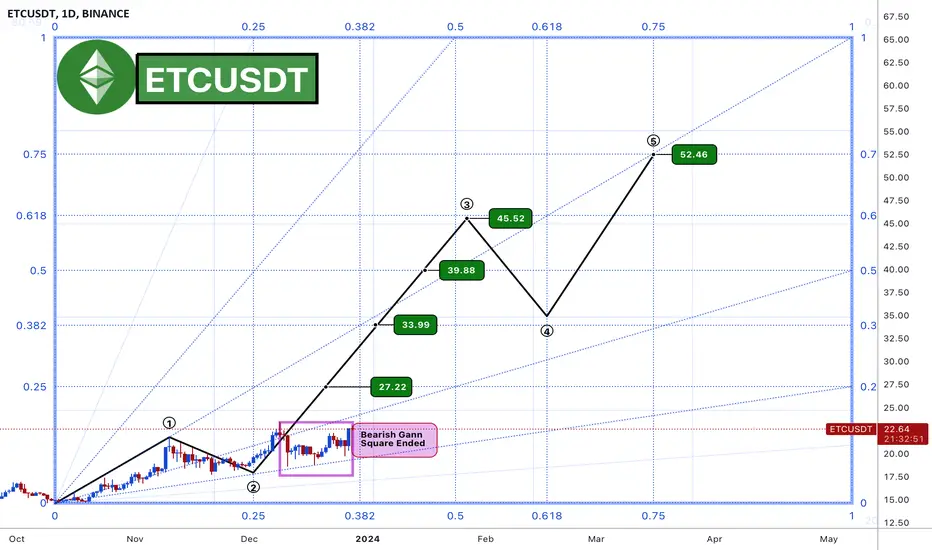
ETCUSDT #001 ( END with BEARISH move ,start with crazy bull run)Hello dear traders.
Good days .
On weekly Gann Square , first cycle of Bullish Gann square passed and 2nd cycle is started .
4HRS Bearish Gann Square is finished and from here is expected to move upward to the 0.618 Gann Box Fib level Price and continue to the 0.75 Gann box fib level.
Chart updated and route plotted with help of Gann Square and Gann Box.
Good luck and safe trades.
Thanks for your support and comments
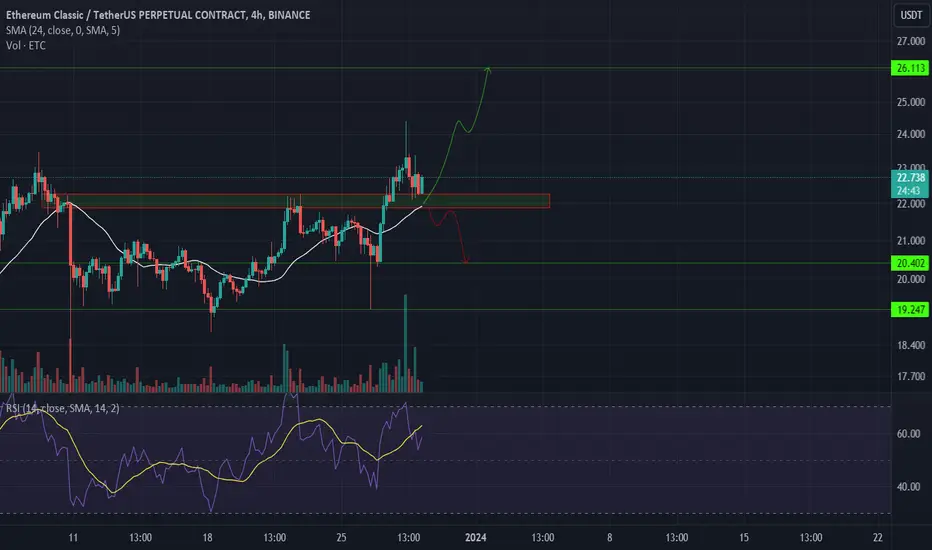
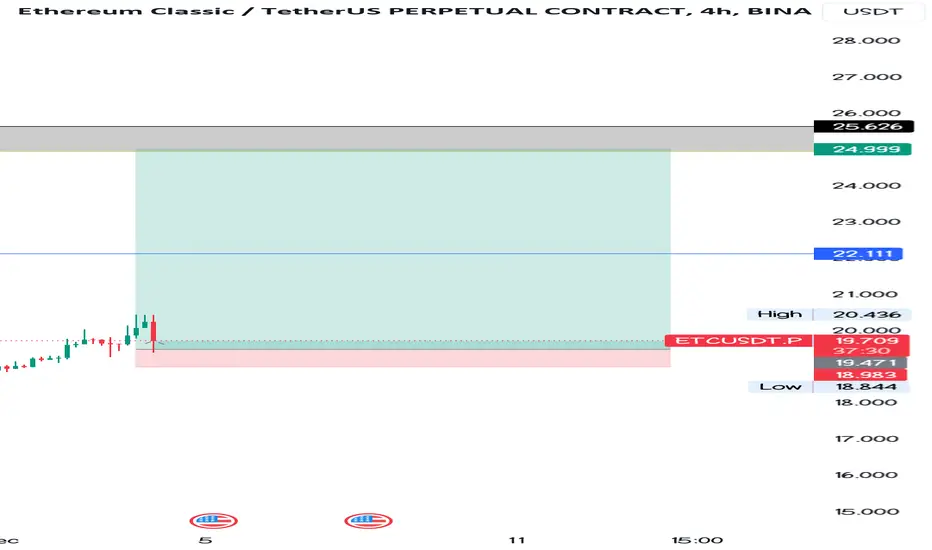
Ethereum Classic's Strategic Play: Is ETC Setting Up for a SurgeBias: Bullish
Description: Ethereum Classic (ETC) is showing a bullish setup with its price action above the Simple Moving Average (SMA) on the 4-hour chart. The recent uptick in price alongside increased trading volume suggests a potential for continued upward movement.
Direction: Upward (Long)
Entry: A prudent entry point would be after a clear breakout above the recent resistance near $22.292, ensuring that the move has enough momentum.
Stop Loss: A stop loss could be placed just below the recent swing low at $20.402 to limit potential downside risk.
Targets: Initial profit targets could be set near previous highs at $24.00 and $25.00, with a stretch target at the $27.00 mark if momentum persists.
Caution: Watch for any signs of reversal, such as bearish candlestick patterns or a drop in volume, which could signal a potential trap. Keep an eye on the broader market trends, as ETC often follows the general sentiment in the cryptocurrency market. Stay vigilant for any sudden market-moving news that could impact the trade.
ETC/USDTBME:ETC is looking good in a daily chart, after flipping the zone in red take an entry and then enjoy. Always use stop-loss. Everything is on the chart
Trust @TheCryptoCity1
Bitcoin CRYPTOCAP:ETH #XRC20 CRYPTOCAP:LTC Grayscale CRYPTOCAP:MATIC
ETC $20 supported wellso far $20 supported quite well. next resistance to break is $24.
20MA crossed 200MAs.
ETC need to break and closed above $24 for further rally.
DYODD

etcusdtetcusdt is forming distribution and we may complete deep crab also if have to form ut and utad
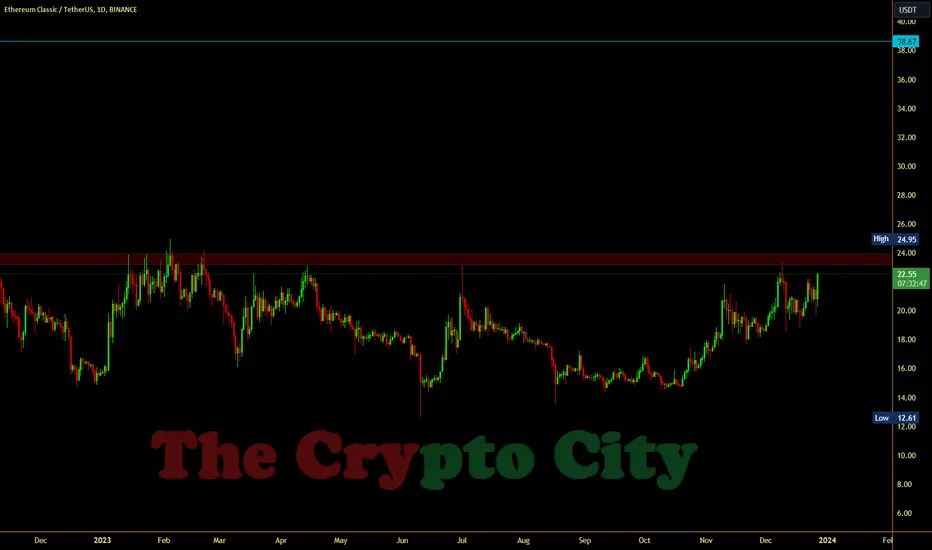
ETC's Price ActionIn the weekly analysis, Ethereum Classic (ETC) is currently navigating a critical phase, ranging between the key Fibonacci resistance at the 1.0 level and the crucial Fibonacci support at the 0 level.
This positioning indicates a distinct trading range, suggesting a consolidation phase within these boundaries. Investors and traders should anticipate a period of range-bound price movements in the short term.
However, it's important to note a significant shift in market dynamics, as the previous bullish momentum has concluded, giving way to the formation of a bearish trend.
This transition underlines the necessity for vigilance, as the emerging downward leg could signal a potential reevaluation of current strategies and readiness for shifts in market sentiment and price action.
This analysis is for guidance only and shouldn't be taken as direct trading advice.

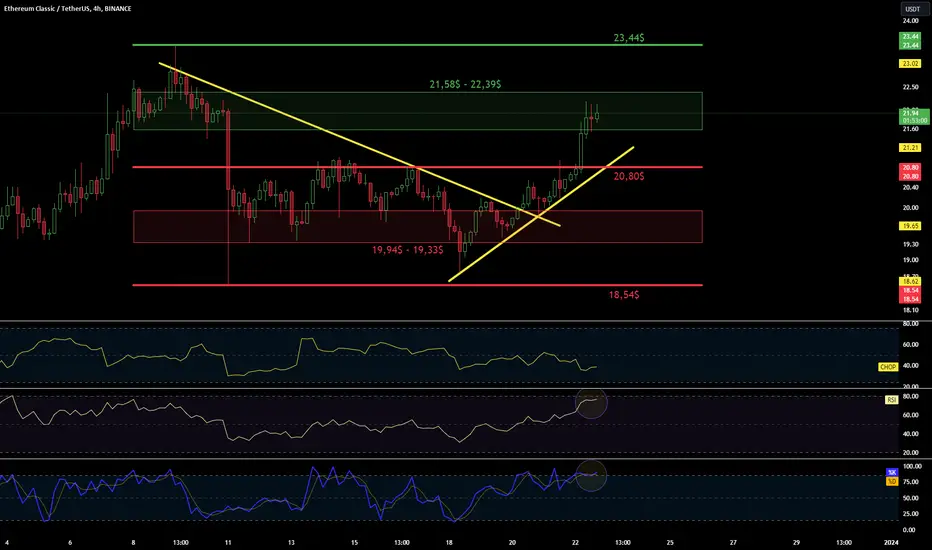
ETC/USDT 4HInterval ChartHello everyone, I invite you to review the ETC pair to USDT chart. First, we will use yellow lines to mark the downward trend line from which the price broke out with an upward movement. And currently we can see movement along the local upward trend line.
With the current upward movement, it is worth spreading the Fib Retracement grid, thanks to which we can determine a strong resistance zone from $21.58 to $22.39, in which the price is currently struggling, while an upward move from this zone may result in an upward movement around $23.44 .
On the other hand, when the recovery begins, we can see support at $20.80, then we can mark the zone from $19.94 to $19.33, and then support at $18.54.
If we look at the RSI indicator, we will see a movement at the upper limit of the range, just as on the STOCH indicator we are also bouncing from the upper limit. Looking at both of these indicators, we can expect the price to recover in the coming hours.
ETC/USDT Ready to Break out the Bullish Flag pattern ??💎 ETC has undeniably captured significant attention in the market. Currently, it is exhibiting a Bullish Flag pattern, and if it successfully breaks the resistance pattern of this formation, there is a probability of a smooth movement toward our target supply area.
💎 ETC is also following a bullish trend channel, characterized by higher highs and higher lows. However, there was a temporary breach of the support level in the bullish channel, which was promptly reclaimed. If ETC revisits the support channel and heads towards the demand area, it represents a critical juncture for ETC to resume its upward trajectory.
💎 The unfavorable scenario is confirmed if, during the retesting phase at the demand area, ETC fails to maintain its position and undergoes a breakdown. In such a case, ETC may revert to the next lower demand area, necessitating a bounce to reclaim the demand before considering further upward or downward movement, potentially towards the next lower demand area and even the strong support zone.

ETC/USDT Assessing Resistance Breakout Potential?👀 🚀ETC💎 Paradisers, focus on #ETCUSDT as it approaches a critical moment. The asset is on the verge of testing a key resistance level, presenting a high likelihood of initiating an upward movement upon a successful breakout.
💎 Currently, #EthereumClassic is inching towards the resistance at $23.17. If it respects this level, we might witness a slight pullback before a bullish continuation emerges from the demand zone. Alternatively, if BME:ETC breaks through this resistance without hesitation, it could trigger a significant bullish surge.
💎 However, given the dynamic nature of the cryptocurrency market, #ETC traders must stay prepared for various scenarios. Should the anticipated breakout not materialize as expected, pivoting to a bullish recovery strategy from the support level of $18.5 will be crucial.
💎 Importantly, a descent below this support level would signal the need for a tactical reassessment. Such a development would imply reevaluating the bullish sentiment and adapting the trading strategy to align with the new market direction. 🌴💰

ETC long full sendAfter that recent move by alts longed this here..
Very risky but if it holds it can full send from here.
Note: Not a Financial Advice.
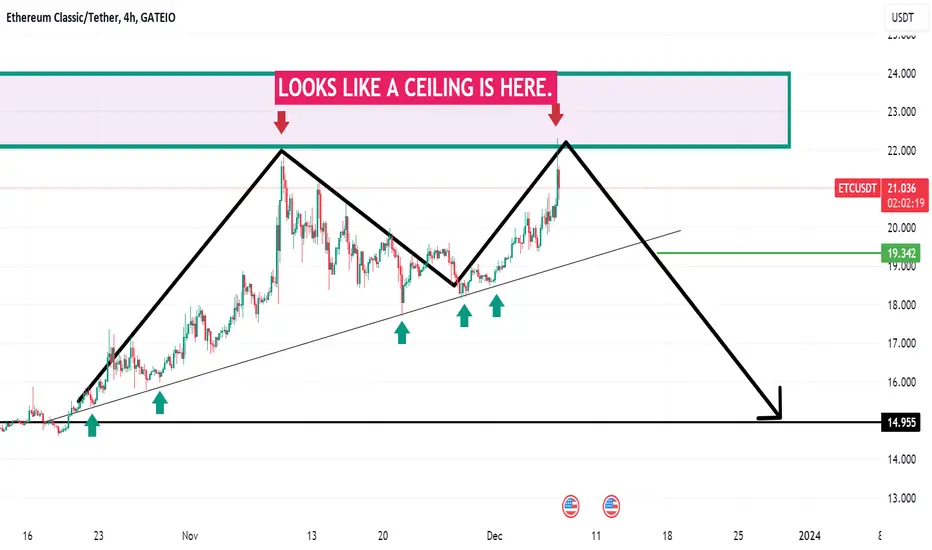
ETC ANALYSIS: LOOKS LIKE A CEILING IS HEREWe are going to be patient enough for this breakdown, when it happens, it is an opportunity for long-term investors to buy more.
For traders, it is an opportunity to make some quick profit by opening a short position.
Patience is the key!
What are your thoughts on this BINANCE:ETCUSDT analysis?
Share them with me in the comment box.
If you like this analysis, follow me now and support my idea.
Cheers!
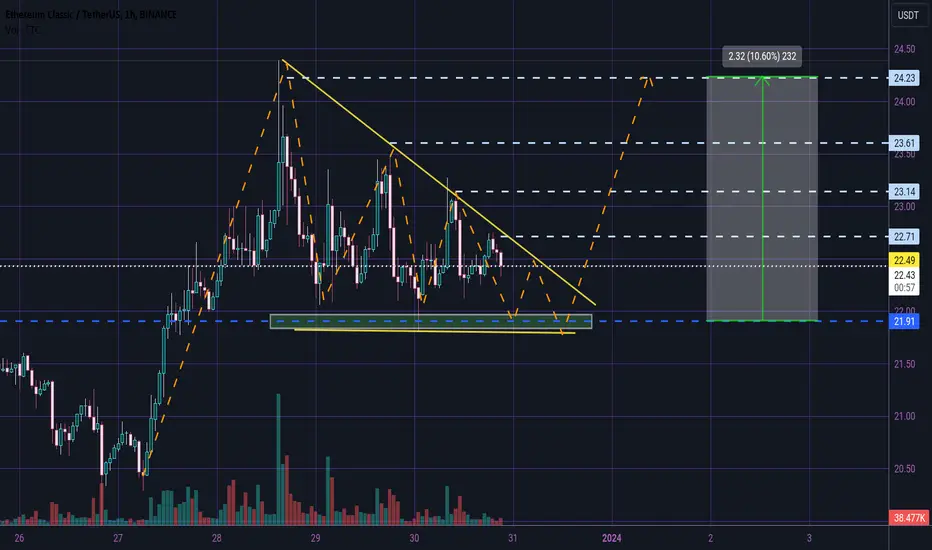
I Cannot Short This !!! situation+next targets.Hi
If the price breaks Fib 0.236 or the neck line of the Adam and Eve pattern, the price will rise well.
🤑Stay awesome my friends.
_ _ _ _ _ _ _ _ _ _ _ _ _ _ _ _ _ _ _ _ _ _ _ _ _ _ _ _ _ _ _ _ _
✅Thank you, and for more ideas, hit ❤️Like❤️ and 🌟Follow🌟!
⤵️⤵️⤵️⤵️⤵️⤵️⤵️⤵️⤵️⤵️⤵️⤵️⤵️⤵️⤵️⤵️⤵️⤵️⤵️⤵️⤵️⤵️⤵️

ETC DESCENDING TRIANGLE 😎🔺️😎🔺️😎Hi dear traders
The price broke the descending triangle and then pullback to the upper side.
Now we can open long position with suitable R/R.
Let's see what happens
This is not financial advice ( DYOR )
Good luck
