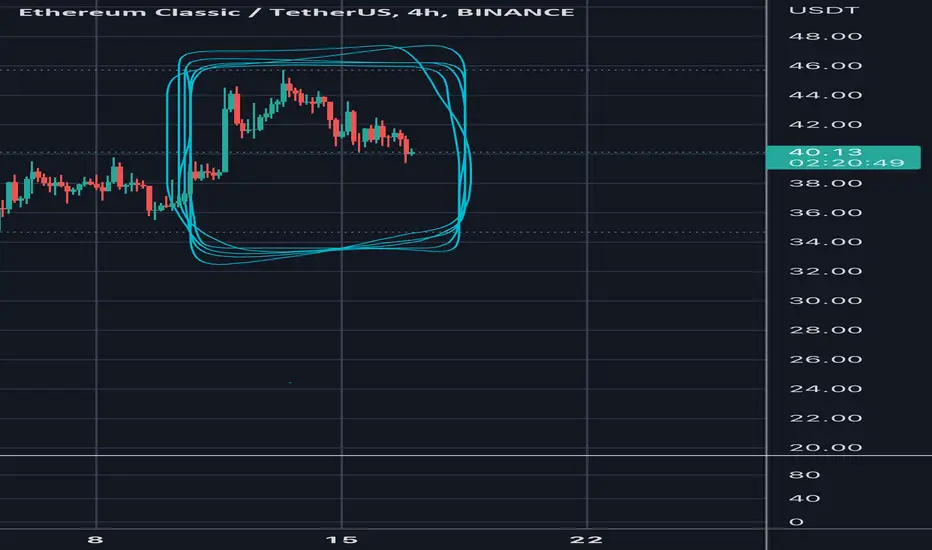
ETC Short IdeaEverything is on the chart. NFA, DYOR, do not risk what you can not afford to lose. Have good luck, traders.
ETCUST trade ideas

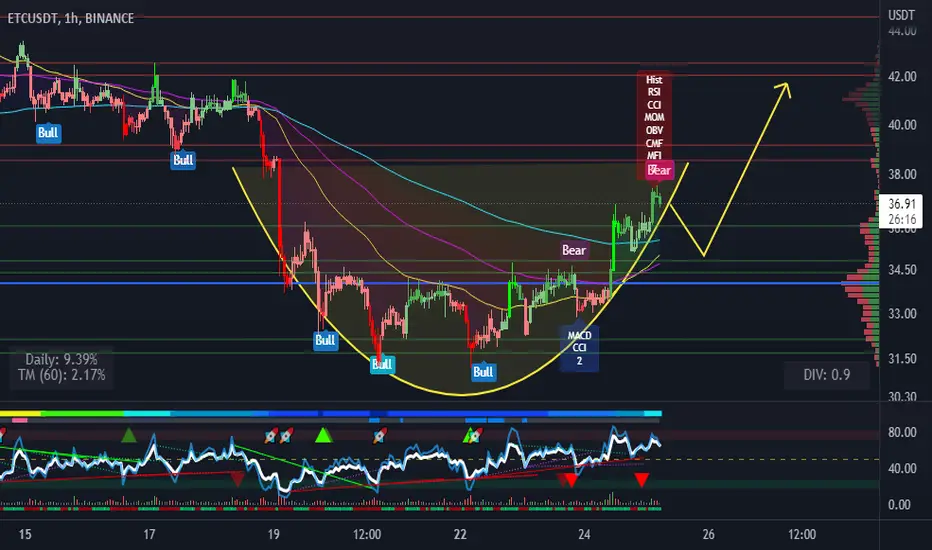
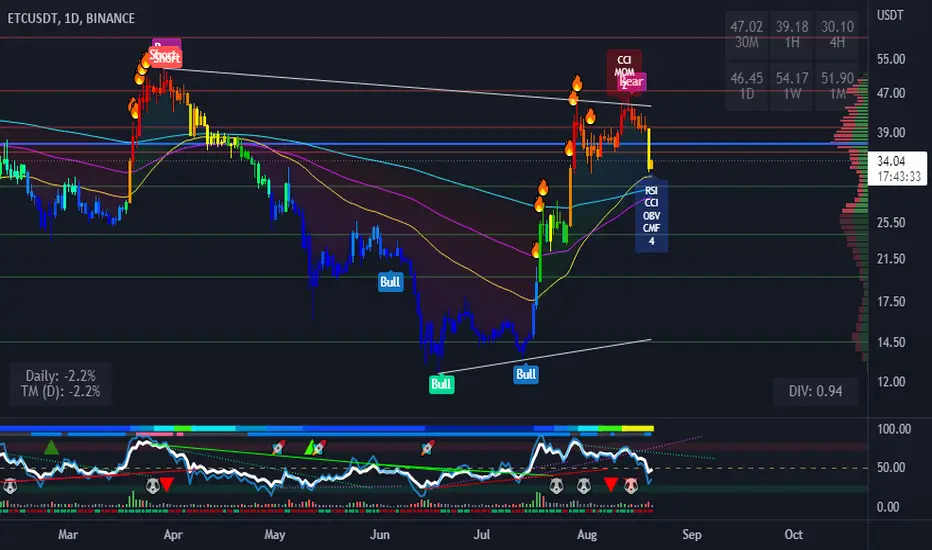
ETCThe price forms a cup pattern. A slight price correction is possible after the formation of bearish divergences and further growth after the confirmation of the cup and handle pattern
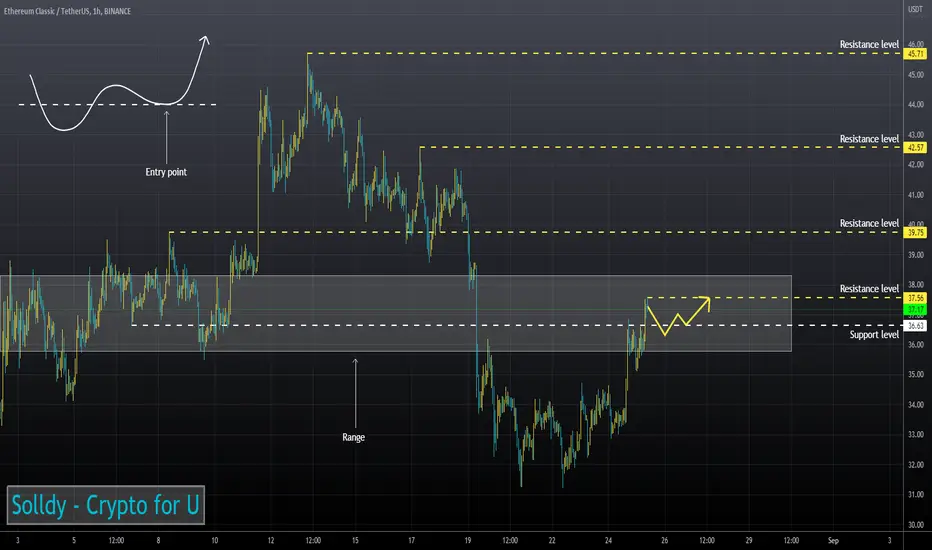
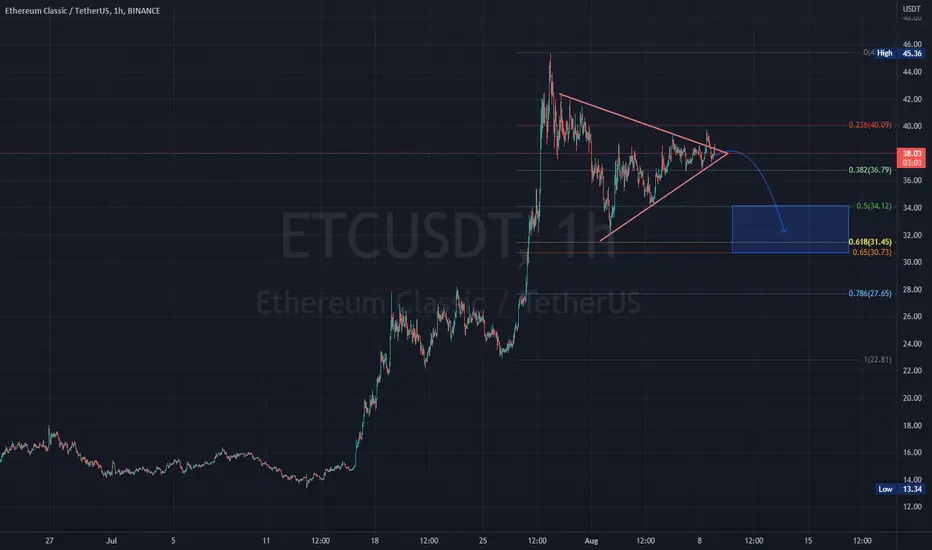
ETCUSD ❕ bearish divergenceBroke through the upside of the 200MA (4H TF)
Price and RSI formed a bearish divergence (1H TF)
I expect that the asset may go down, but after the test and fixation above the support level, ETC will continue to grow within the range.
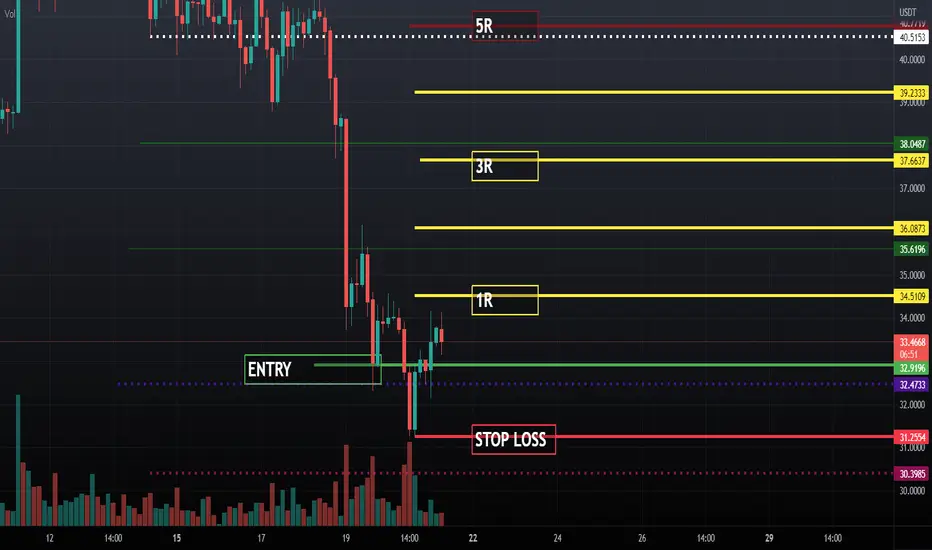
Etc long position Etc certainly is bullish for the last 2 days. There is so much volume right now in the market and I’m going long. Already in profit, hopefully target gets hit. I am open to other opinions, pls feel free to comment. I’m willing to learn too ✌️
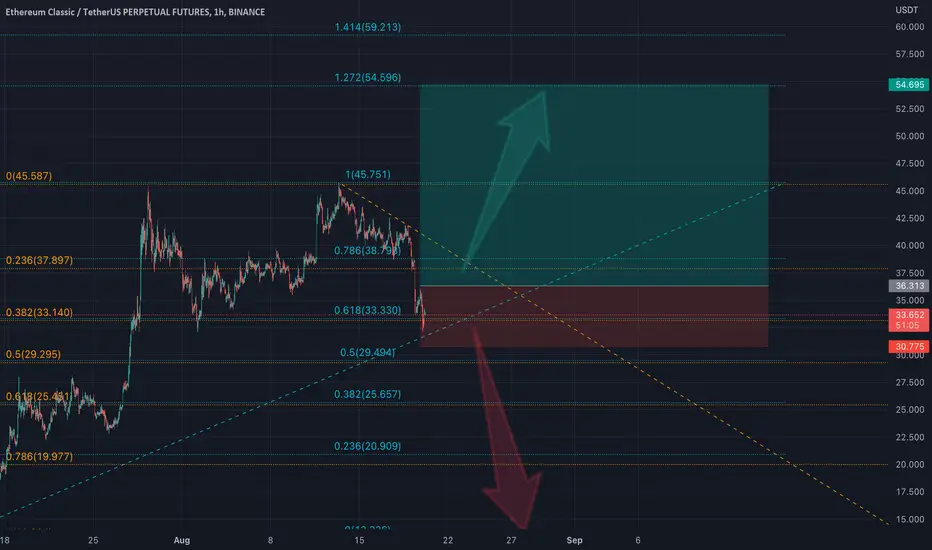
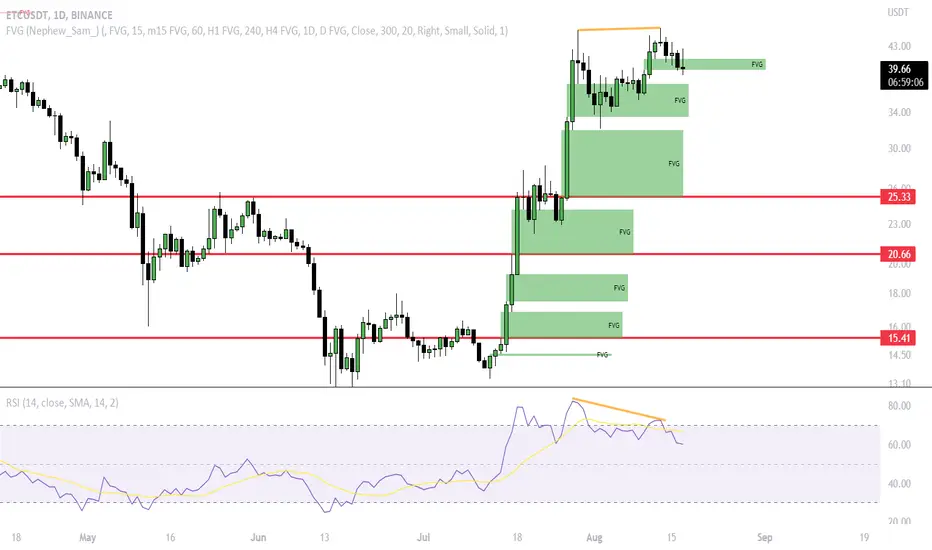
✅ Ethereum Classic Price Analysis "FW"The above chart of Ethereum Classic (ETC) laid out the falling wedge pattern. In a falling wedge pattern, both the upper trend line which connects the highs and the lower trend line which connects the lows converge downwards. The wedge pattern in general indicates a trend reversal. Especially, the falling wedge signals a bullish reversal.
This pattern indicates a breakout in the price trend towards an upswing. From the above chart, we can interpret that the momentum of the downtrend is slowing down.
Currently, Ethereum Classic (ETC) is in the range of $35.80. If the pattern continues, the price of Ethereum Classic (ETC)might reach the resistance levels of $45.60 If the trend reverses, then the price of Ethereum Classic (ETC) may fall to $33.70
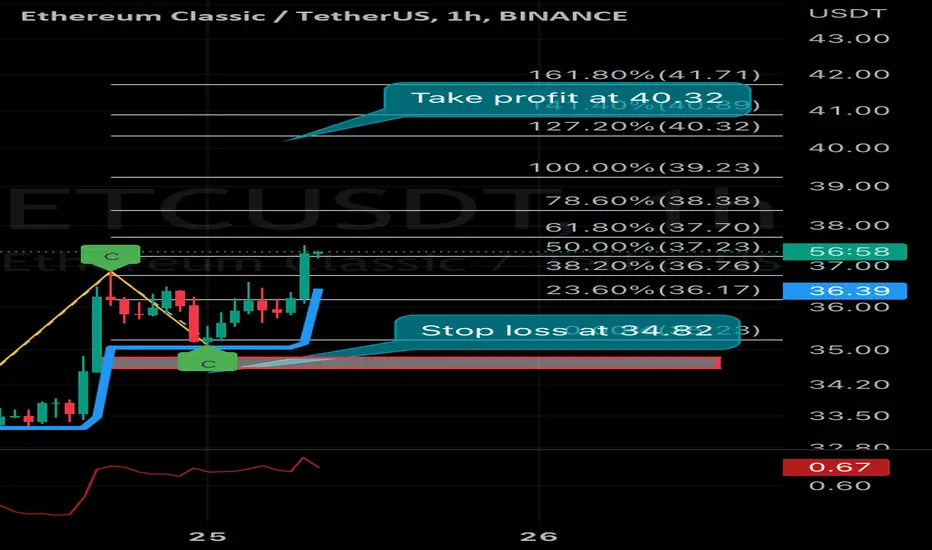
✅Trade Level
Entry Point : $36.70
Target : $45.60
Stop Loss : $33.70
Happy Trading

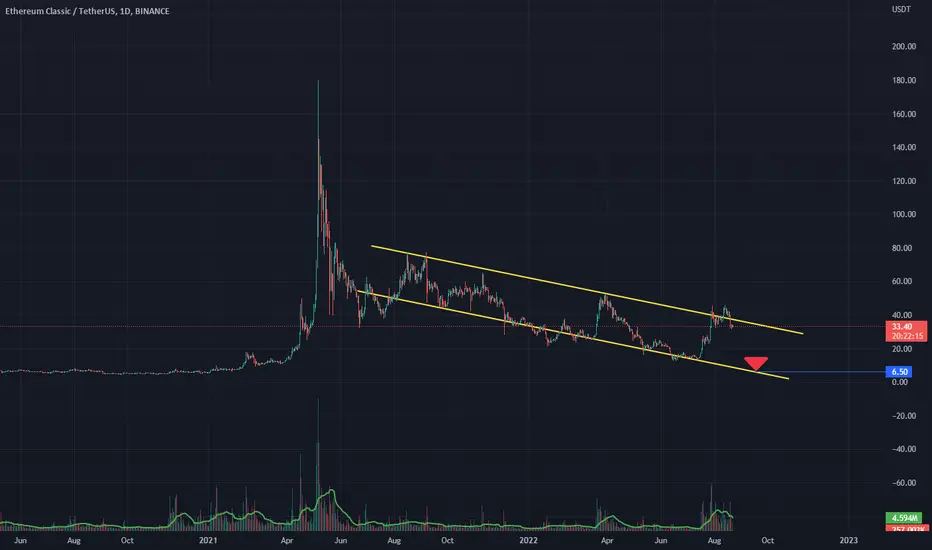
ETC above weekly support#ETC/USDT
$ETC is still above weekly support.
price can continue sideway moves between descending trend lines for a while!
🐻 rejection from upper zone can shape a Head and Shoulders pattern and drop price to the lower line of weekly support.
🐮 break out from the upper zone can ride price to the moon.
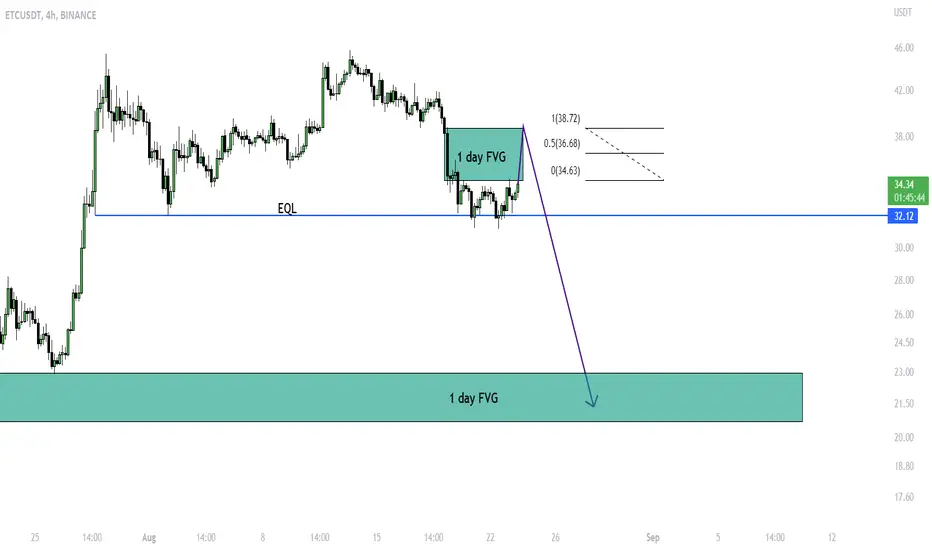
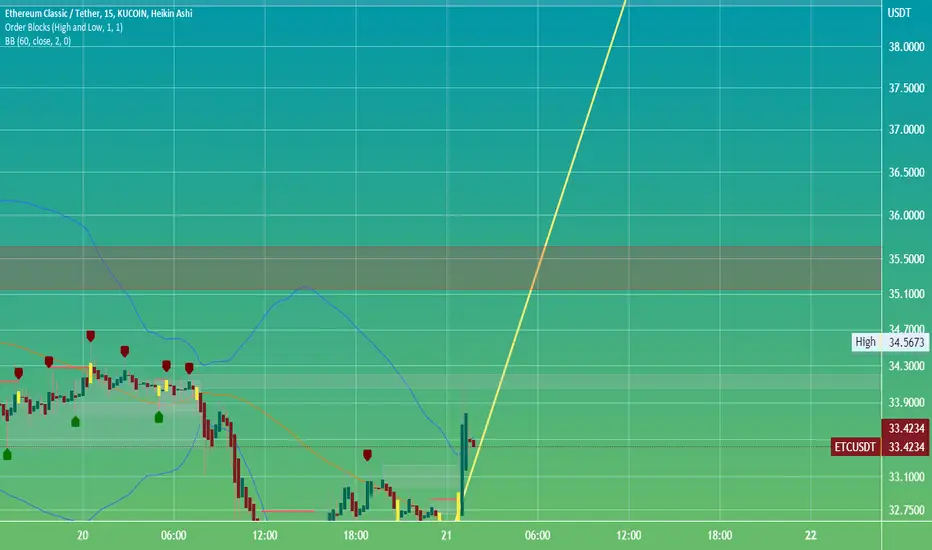
ETC local moveThe overall crypto market is short-term bullish, I expect a correction to the upwards on ETCUSDT and the price should fill the 1-day gap, after that the bearish movement should continue.
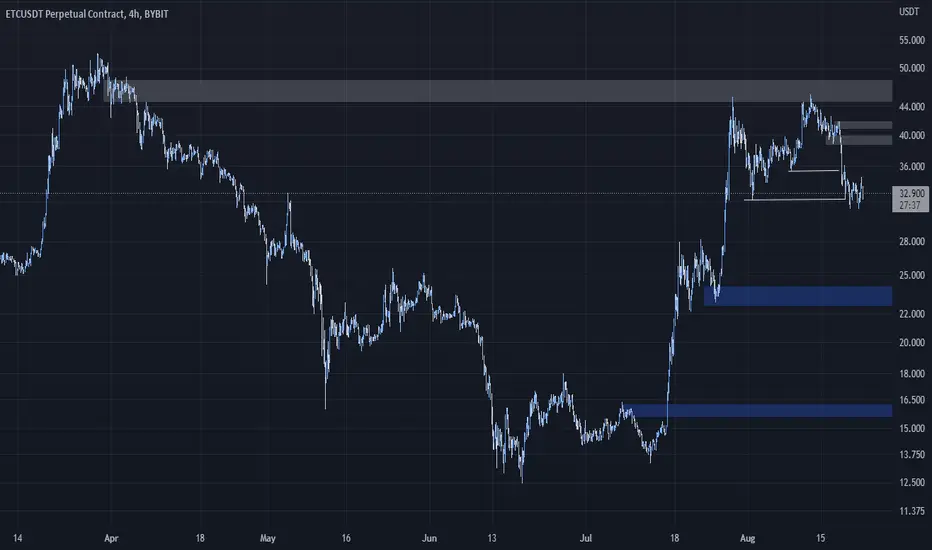
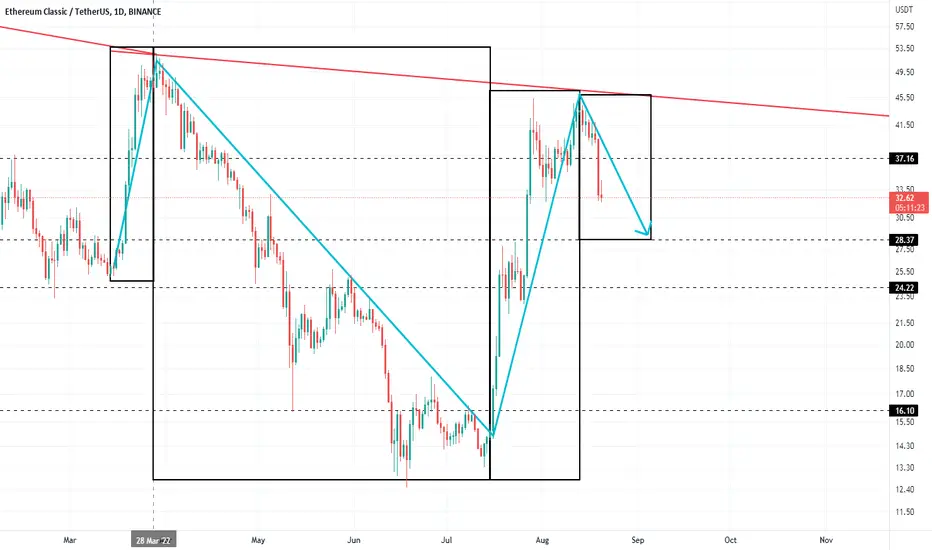
Possible repeat of May 2 - 6 2021 15 Months later?Lots of similarities in the chart this week and back then PA is very identical
✅TS ❕ ETCUSD: went down✅✅ETC formed several peaks, after which the price went down. The trend has changed and now we can expect the movement to continue.✅
🚀 SELL scenario: short to 26.47.🚀
----------------------------------------------------------------------------
Remember, there is no place for luck in trading - only strategy!
Thanks for the likes and comments.

ETC ELLIOT WAVE DONE ??ETC has completed the fifth elliot wave in the 4H time frame after moving of the bearish wave. As you can see in the graphic, it may have a bearish leg to 29-28 dollars.
ETC BET hi every one guess how many percent possebility this move happen to etc share ur idea in comments
ETC is very Bearish. Hi, again guys
I really don't know what to say here. But this one will definitely make some corrections.
I personally use a manual stop on my positions. Good luck.
Regards
ETCThe price fell to the 50 EMA zone. If the RSI stays above the 50 level, the price will bounce up to the downtrend line. Support and resistance levels are indicated
pending breakoutHello all,
It is important to be open to both bull and bear scenario. I will hold for breakout before taking a position

ETC/USDT LONGJust a quick retracement needed. It had a recent downtrend which we need to retest before going lower
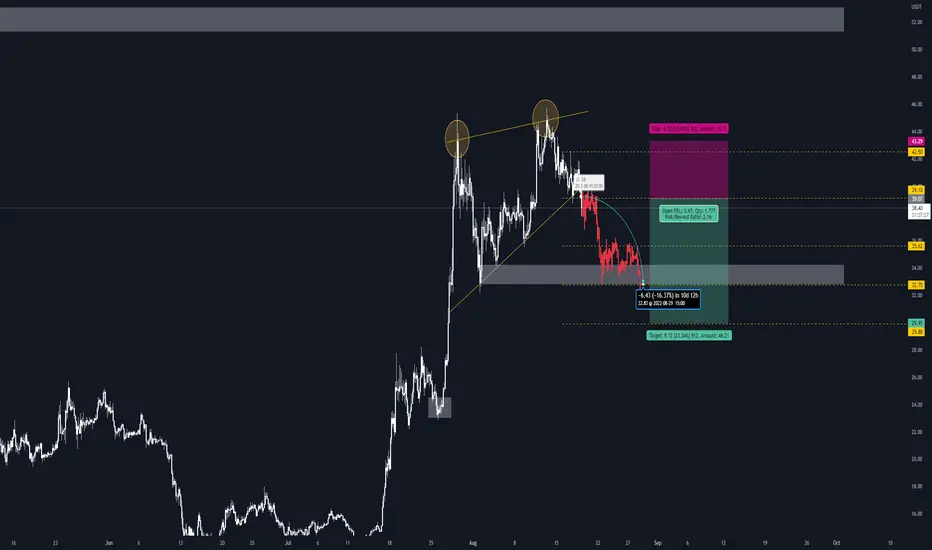
ETC/USDT ShortAfter a recent pump of more than 200%, ETC is in the phase of getting more liquidity at lower prices, in order to start a new wave upwards.
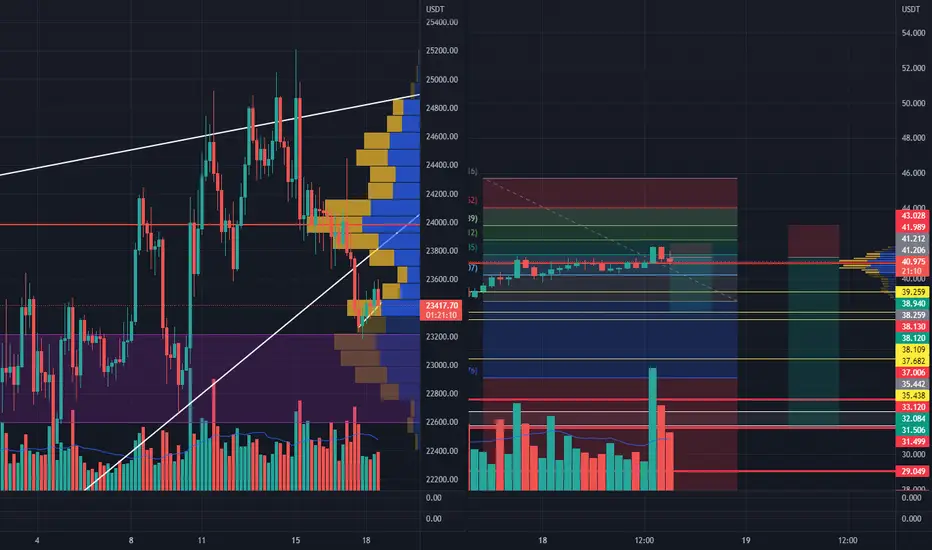
ETC correction ahead?The price moved up aggressively and left a lot of gaps on the way up, there are no imbalanced zones on the upside+clear bearish divergence. BTC is showing some weak movements too. Possible targets are mentioned on the chart.
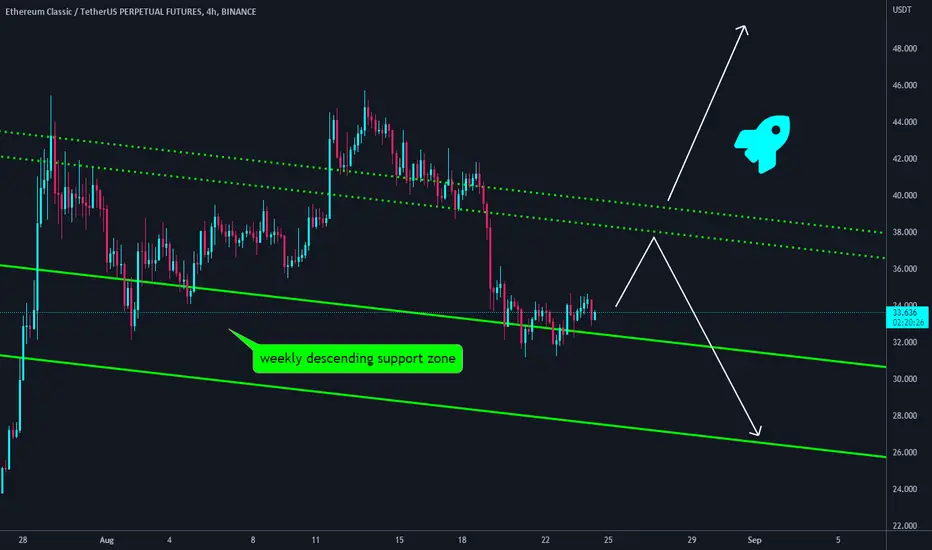
ETC ascending channel#ETC/USDT
#update
$ETC is above the weekly descending support zone.
🐮 also price shaped an ascending channel, that hold above the lower line of this pattern.
so it is high likely that price continue its uptrend to middle line and even upper line of this channel.