Ethereum Classic forecast and signalLearn and Earn!
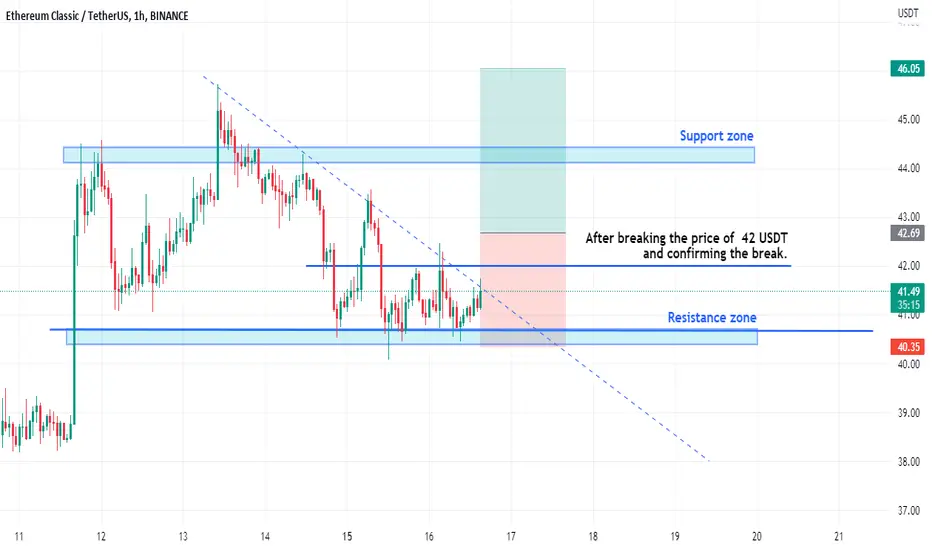
After breaking the price of 42 USDT and confirming the break.
Confirmation of the break of resistance or support in this 1-H chart; that is, the bar (or candle) closed at the top of the resistance or support price, as well as the next candle, growing at least around 5 pip ( in forex usually call it pips ) or units ( 5 pips in cryptocurrency is around: 0.10%) more than the maximum price of the last closed candle.
---------------------------------------------------------
Please pay attention!
First: Trades have a time term , and in this case, it's from now until the next 24 hours. (You can also see it in the diagram)
Second: You can see the entry price in the chart.
So for this one, the trade is activated when the price reaches and crosses $42 (USDT)
Before the price crosses the mentioned place, the trade position is not active.
---------------------------------------------------------
Please write any advice or suggestions.
Dear friends, request any cryptocurrency pair, currencies pair for forex, and any index that you want to be analyzed and ask any questions.
Thanks for your attention
ETCUST trade ideas
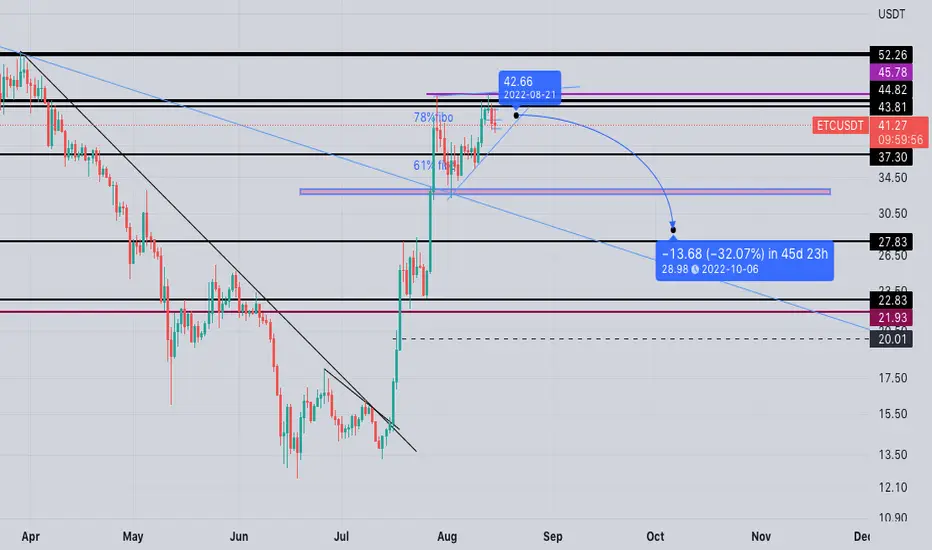
etcusdtETC has moved 78% of the bearish wave an now it has compeleted the 5 elliot wave in 4H time frame.
it can have bearish leg to 28 dollar as you can see in the picture.
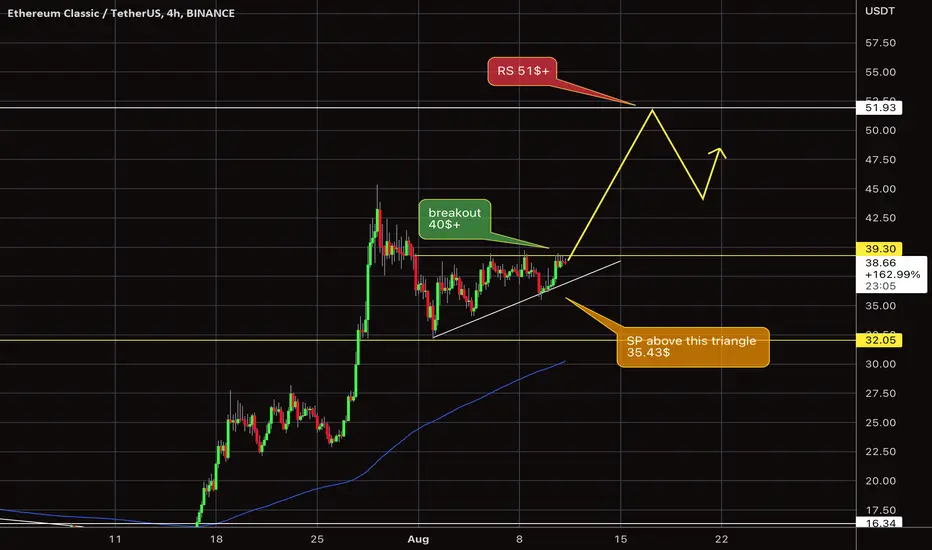
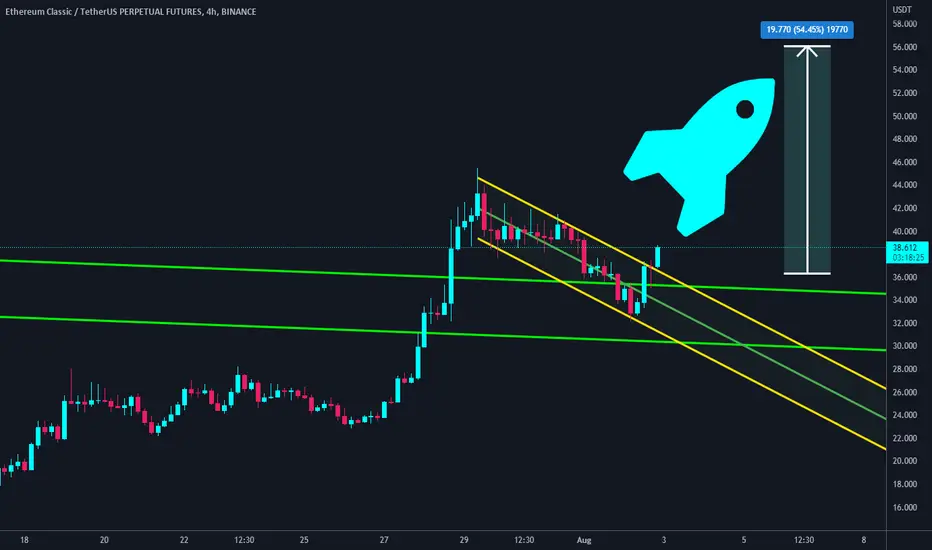
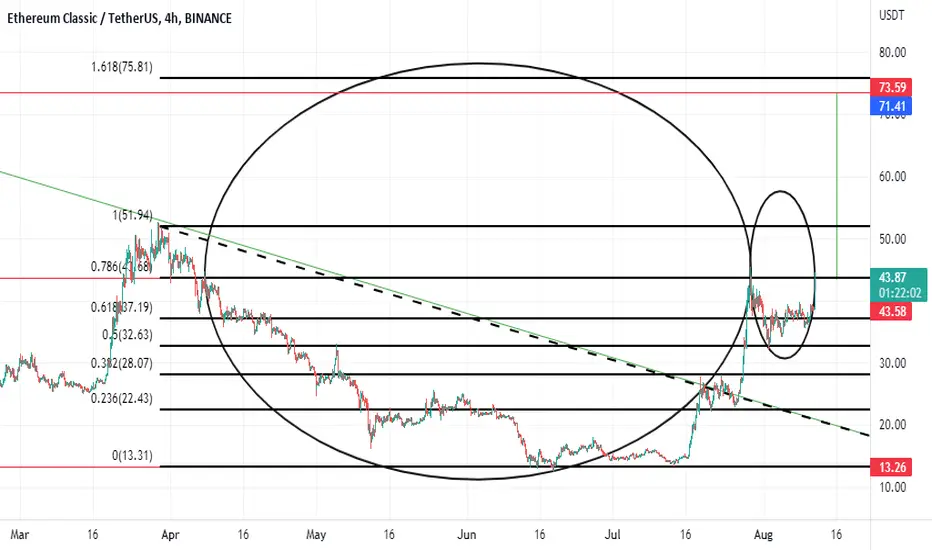
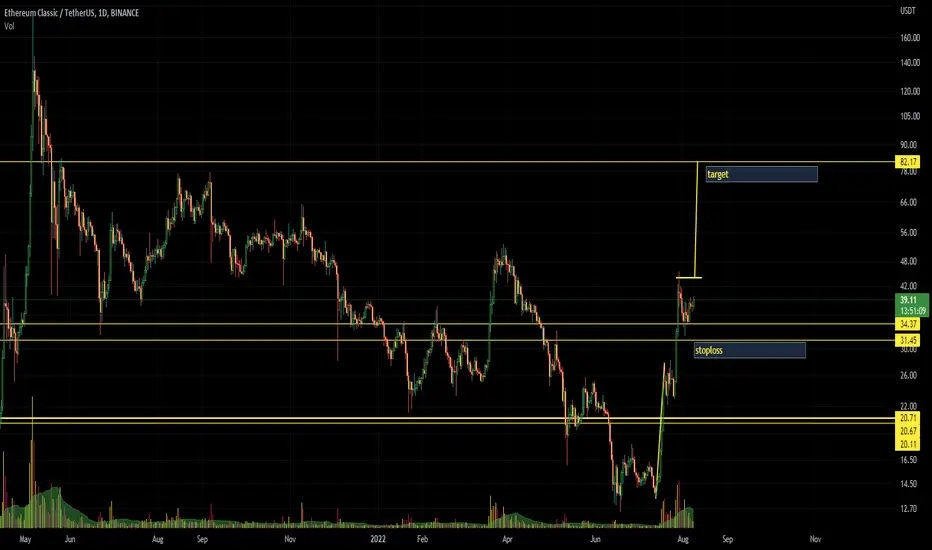
ETC breakout Zone $we about to have another pump if we broke our triangle and hold above the 40$, we going to see a test for our resistant around the 51$, and the 51$ level is the the target where we going to see ETC going in to Bull run if we broke it and hold above it for this year .
Ethereum Classic pulls a Classic ScamHello friends. The good old Scam Top is a classic and powerful pattern. We see them on all time frames and all markets.
You will spot this pattern when you see an extreme move up followed by a retracement down and then a move just slightly above the prior high. That move higher is the "scam" that that snatches liquidity for large traders by taking out retail stop losses. This way they can push prices lower once they have shorted enough.
The Volume Profile helps us to set a target, since it shows there is a good chunk of support which we want to exit before.
Thanks for playing.

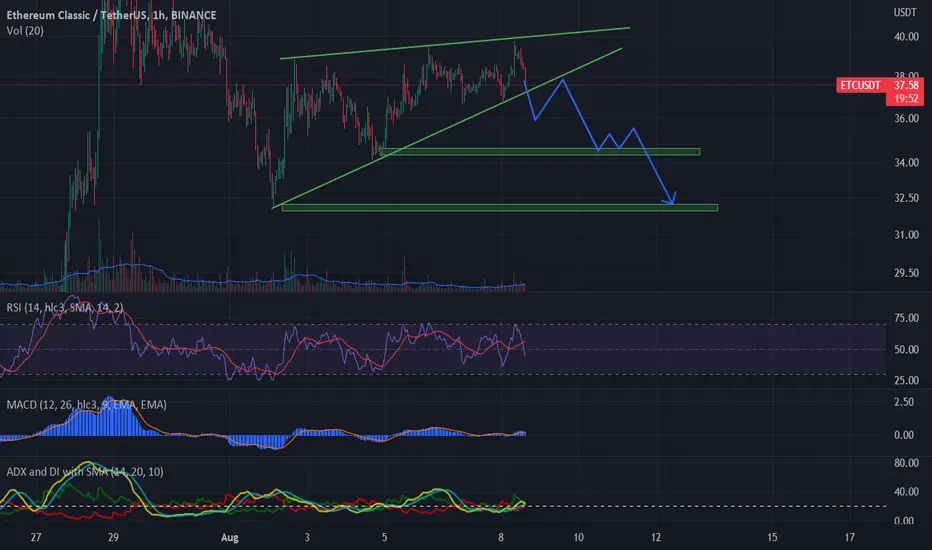
ETC /USDT has a nice short term setupi think that for the next couple of days ETC will move inside a 10% channel.
i will enter a short around 44.30$
and i will have two take profit points at 40,25$ and 41,70$.
now for the bad scenario,its not even bad,i will cut my minimal losses if a 4hour candle closes above 45,3 which is a 2,2% loss.
it's not a sure move,but it is a tiny risk move,so i will use only 2x leverage
this is a short term move and i believe we will soon see it above 50$ and because of that,after my take profit hits i will upload another aide for a ETC LONG
this whole idea is supported by pattern,indicators and genral market conditions.
ETC-USDT +88% profit done ✅ETC-USDT
BUY: 22.87$
SELL:43.16$
PROFIT: 88.7%
DONE
Related words: trend line - support level - price channel
congratulations to our team

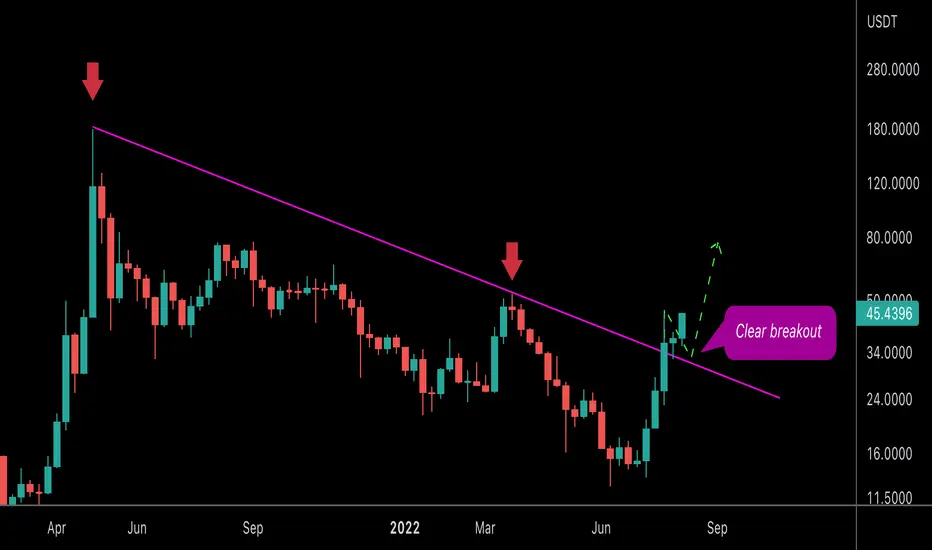
ETC (the monster is coming back ?)ETC / USDT
I made analysis for this coin since 1 week ago
And it seems following my idea ⬇️
Price is already pumped 21% from my last idea
Ignore the noise and fluctuations in small time frames we saw a clear breakout in weekly time frame
The first strong resistance is located at 50$
Best of wishes
$ETCUSDT UPDATE!!!Hi Snipers,
Please refer to the recording for the next price levels and scenarios.
Thanks
MS

ETC to $90 and even MOON#ETC/USDT
#update
$ETC did the pullback to the broken weekly zone and broke out the bullish flag pattern.
🐮 so it will continue its fly to the moon 😎
ETC TopETC was a market leader for a while so it makes sense for it to top out before everything else. Money made from this on the way up will also roll into other projects as well.
Looks like we've done a 5 wave impulse that has ended. The RSI of the 5th wave was higher than the 3rd but not by much. Close enough to call it a 'double top' - same with the price action. I believe this is a B wave up that has retested the highs. If it goes above the highs again then my count may be invalidated as we see an extended 5th. Looks like a safer short than a long here!

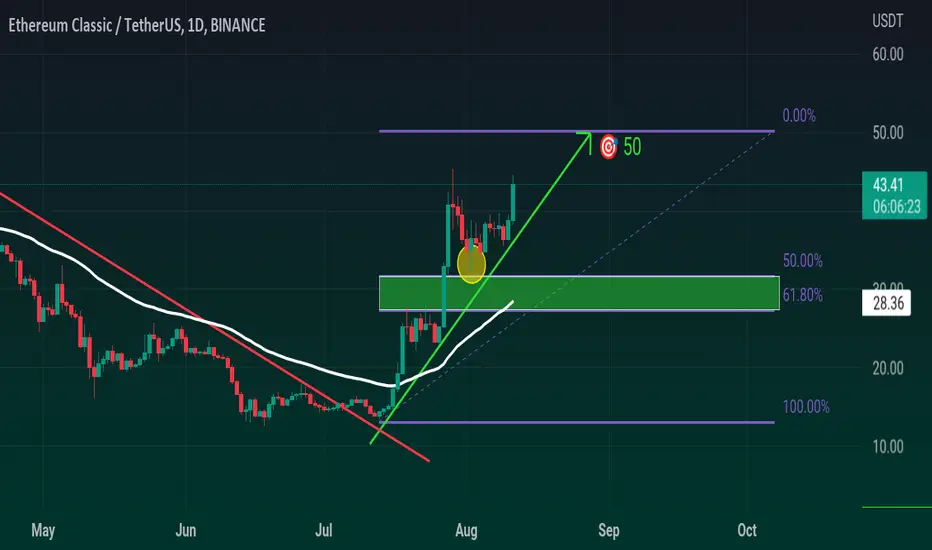
ETC/usdtEtc in continuous move "in uptrend" towards 50$ and maybe more after breaking the last fib level.
Keep watching ETC....
PEPSI Of CRYPTO - Some Like it Classic 🥤Let's get things straight first:
We all know the Coca Cola of Crypto. It starts with 'Bit' ends with 'Coin' 🏛️😼
And then there is Pepsi..sorry, I meant to say Ethereum.
News = Volatility and short term Potential :
Ethereum Classic soars 100% in nine days outperforming ETH as 'the Merge' approaches
Ethereum's transition to proof-of-stake could be a boon for the price of Ethereum Classic.
What is the difference between ETH classic and Ethereum?
Difference Between Ethereum and Ethereum Classic. Ethereum, represented by the ETH, is the new chain that is the original blockchain's offset and takes a second to confirm any transaction. In contrast, the Ethereum Classic represented by ticker ETC is an original chain and not the offset of any original blockchain.
The split revealed philosophical divisions within the Ethereum community. Based on the principle that “Code is Law,” a small number of developers and miners believed that The DAO's investors should suffer the consequences of investing in a flawed project. However, the majority of the Ethereum community decided to roll back the blockchain, effectively creating a bailout for The DAO's investors.
KEY TAKEAWAYS
Ethereum Classic (ETC) is an open-source, decentralized, blockchain-based distributed cryptocurrency platform that runs smart contracts.
Ethereum Classic was originally known as Ethereum. It was conceived by Vitalik Buterin and the Ethereum Foundation and launched in 2015.
Ethereum Classic was created after The DAO hack in 2016.
The dispute caused a split in the Ethereum community, with the majority choosing to reverse the hack. Ethereum Classic is the name of the original, smaller blockchain.
History of Ethereum Classic
Initially, the Ethereum blockchain was established as a single network where transactions were facilitated by using the cryptocurrency ether or ETH. The new network quickly became popular for initial coin offerings, as different teams used the platform to launch their own tokens.
One of the most successful ICOs was The DAO, a decentralized venture fund where investors would vote on assets to invest in. The DAO quickly accumulated more than 11 million ETH, from over 18,000 investors, before unknown hackers discovered a smart contract bug allowing them to withdraw about a third of The DAO's accumulated ether.
1
Due to the scale of the hack, many investors proposed reversing the Ethereum blockchain to rescue the affected investors, while others argued that doing so would set the precedent for future bailouts. After a hastily-arranged poll, 97% of the community voted to restore the lost funds through a hard fork.
2
As a result, the Ethereum blockchain split into two separate networks. The newer network inherited the name Ethereum and uses ETH or ether as its cryptocurrency. The older one, known as Ethereum Classic, uses ETC.
Concerns of Ethereum Classic
Although both Ethereum and Ethereum Classic offer smart contracts and are after the same market, Ethereum has gained in popularity as the more legitimate of the two networks. Also, Ethereum's ETH is second only to Bitcoin as the most valuable cryptocurrency network in the world.
3
One of the chief concerns of Ethereum Classic is the potential limitations when it comes to scalability. Typically, the network can handle 15 transactions per second, but that number is far less than payment networks such as Visa, which handles more than one thousand transactions per second. Although Ethereum Classic has gone through many software upgrades, the scalability of its payment systems remains to be one of its biggest challenges going forward.
4
Also, security is likely to remain an issue with smart contracts, particularly since Ethereum Classic has already experienced a hack and theft of millions of dollars. These concerns could potentially prevent smart contracts via Ethereum Classic from being used in major financial and real estate transactions.
Regulations of the cryptocurrency market continue to develop, which may or may not change how Ethereum Classic—and other networks—operate. For example, the Security and Exchange Commission (SEC) does not consider Ethereum or Bitcoin securities due to their decentralized networks.
5
Without being considered a security, some cryptos may have challenges getting approved for inclusion in various financial products that contain a basket of securities, stocks, and bonds such as exchange traded funds and mutual funds. Going forward, uncertainty remains surrounding the regulatory landscape for Ethereum Classic as well as other, less popular blockchain networks.
Future of Ethereum Classic
The future of Ethereum Classic looks less bright than Ethereum since Ethereum is considered the more legitimate of the two networks, especially with the security concerns of Ethereum Classic.
Investors have lost confidence in ETC over the years due to hacks into the system, and until ETC can redevelop its code and software to prevent future hacks, Ethereum Classic may have challenges ahead. However, it remains to be seen how the smart contracts will be developed within the Ethereum Classic project and whether they can be adopted for widespread use.
How Is Ethereum Classic Different from Ethereum?
Although Ethereum Classic's ETC has value as a speculative digital asset that investors can trade, Ethereum's ETH is considered the more legitimate and widely traded. In early 2021, the Chicago Mercantile Exchange (CME) approved the trading of ether futures. Only Bitcoin and Ether have been approved for such transactions. The futures are derivative contracts on an underlying security with a fixed price and maturity date.
6
Ether futures allow investors to trade ether for speculation but also to hedge an outstanding position in ETH or perhaps other cryptos.
7
We can determine how the investment community views ETC versus ETH by analyzing how much capital or investment dollars are being committed to the two currencies. When comparing the two market capitalizations of the two cryptos, ETH is the clear winner. The market cap of a cryptocurrency is calculated by multiplying the currency's price—based on a fiat currency such as U.S. dollars—by the outstanding coins or tokens in circulation.
ETC has 133.9 million coins in circulation with a market capitalization of $6.1 billion while ETH has approximately 120 million in circulation and a market cap of more than $417 billion. ETC trades at $46.00, while ETH trades for more than $3,475 per coin as of April 2, 2022.
8
Although both networks offer smart contracts, the potential for the aforementioned security concerns surrounding ETC will likely push investors to invest in ETH and adopt Ethereum's smart contracts versus those of Ethereum's Classic.
Goals of Ethereum Classic
Since the split, there have been many upgrades and improvements to the Ethereum Classic project. The goal of the project continues to be working toward becoming a global payment network using smart contracts that can function without centralized governance.
9
As with other cryptocurrencies, Ethereum Classic will likely continue to strive to be a digital store of value, meaning it can be saved and exchanged while retaining its value. The digital store of value for crypto includes its purchasing power that can be quickly turned into cash or used to buy another asset, similar to money.
How do you like your Pepsi?
-Proof or work or Proof of Stake ?
-Classic and forgotten or fond of Vitalik's changes?
Let me know our thoughts.
The FXPROFESSOR

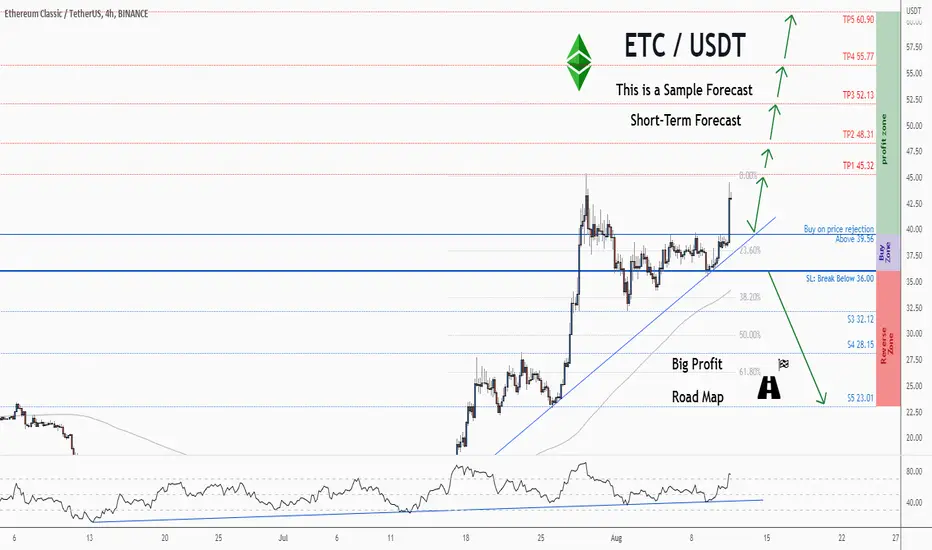
💡Don't miss the great buy opportunity in ETCUSD @eth_classicTrading suggestion:
". There is a possibility of temporary retracement to the suggested support line (39.56).
. if so, traders can set orders based on Price Action and expect to reach short-term targets."
Technical analysis:
. ETCUSD is in an uptrend, and the continuation of the uptrend is expected.
. The price is above the 21-Day WEMA, which acts as a dynamic support.
. The RSI is at 76.
Take Profits:
TP1= @ 45.32
TP2= @ 48.31
TP3= @ 52.13
TP4= @ 55.77
TP5= @ 60.90
SL= Break below S2
❤️ If you find this helpful and want more FREE forecasts in TradingView
. . . . . Please show your support back,
. . . . . . . . Hit the 👍 LIKE button,
. . . . . . . . . . Drop some feedback below in the comment!
❤️ Your support is very much 🙏 appreciated!❤️
💎 Want us to help you become a better Forex / Crypto trader?
Now, It's your turn!
Be sure to leave a comment; let us know how you see this opportunity and forecast.
Trade well, ❤️
ForecastCity English Support Team ❤️
💡Don't miss the great buy opportunity in ETCUSD @eth_classicTrading suggestion:
". There is a possibility of temporary retracement to the suggested support line (39.56).
. if so, traders can set orders based on Price Action and expect to reach short-term targets."
Technical analysis:
. ETCUSD is in an uptrend, and the continuation of the uptrend is expected.
. The price is above the 21-Day WEMA, which acts as a dynamic support.
. The RSI is at 76.
Take Profits:
TP1= @ 45.32
TP2= @ 48.31
TP3= @ 52.13
TP4= @ 55.77
TP5= @ 60.90
SL= Break below S2
❤️ If you find this helpful and want more FREE forecasts in TradingView
. . . . . Please show your support back,
. . . . . . . . Hit the 👍 LIKE button,
. . . . . . . . . . Drop some feedback below in the comment!
❤️ Your support is very much 🙏 appreciated! ❤️
💎 Want us to help you become a better Forex / Crypto trader ?
Now, It's your turn !
Be sure to leave a comment; let us know how you see this opportunity and forecast.
Trade well, ❤️
ForecastCity English Support Team ❤️

ETCThe price is trying to break through the upper boundary of the symmetrical triangle. If successful, the uptrend may continue to $50-60 in case of positive news amid the transition of ETH miners to ETC

ETC/USDT UPDATEThe bowl formation continues.
After the first 51 dollars, it will need to increase to 56 dollars
Insights shown here are for follow-up purposes only.
Not Acceptable as ANY Investment Advice
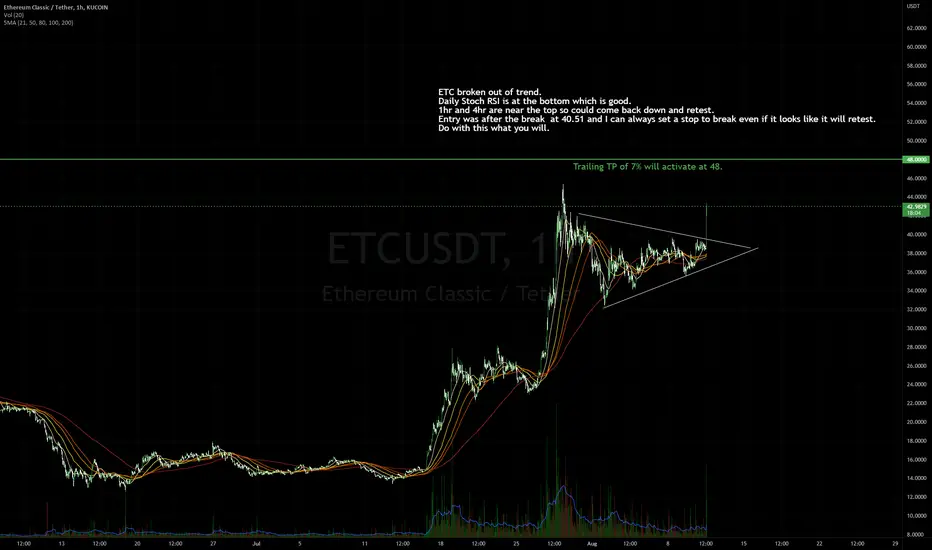
ETC TradeETC broken out of trend.
Daily Stoch RSI is at the bottom which is good.
1hr and 4hr are near the top so could come back down and retest.
Entry was after the break at 40.51 and I can always set a stop to break even if it looks like it will retest.
Do with this what you will.
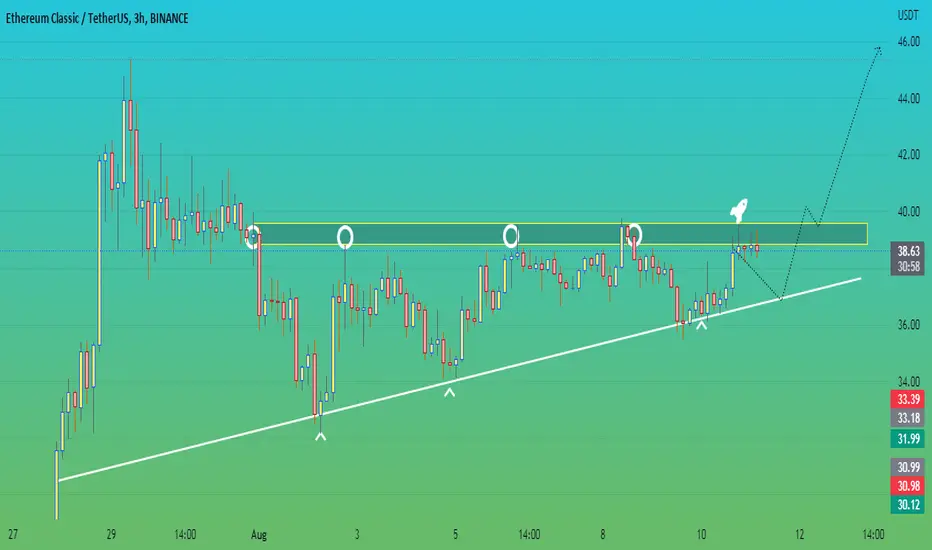
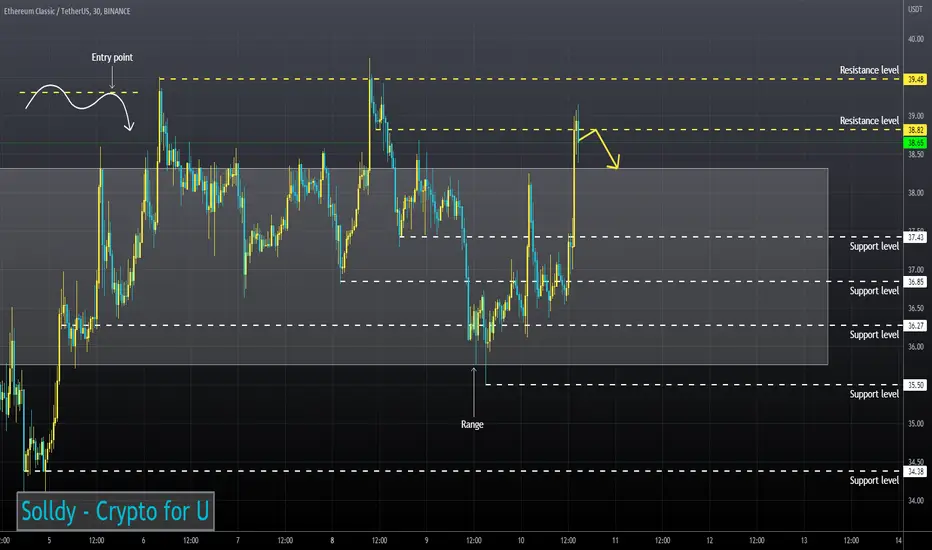
ETCUSD ❕ price above the rangeETC is near the range.
The stock looks overbought by RSI and BB indicators (1H TF)
I expect that the price will continue to decline after fixing under the resistance level.
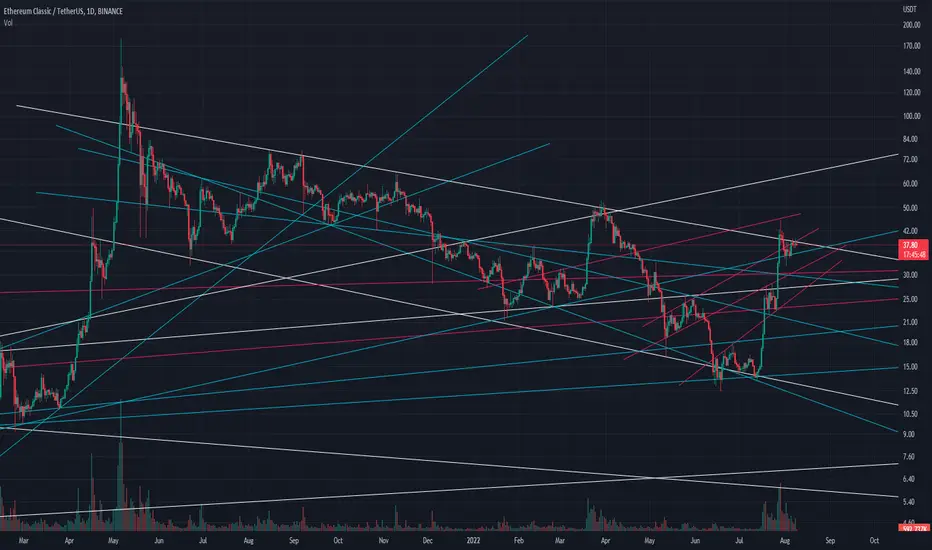
ETC TRend lineA trendline is a line drawn over pivot highs or under pivot lows to show the prevailing direction of price. Trendlines are a visual representation of support and resistance in any time frame. They show direction and speed of price, and also describe patterns during periods of price contraction.
ETC No Shorting please !!!!Etc has not completed its 3rd wave yet on Daily.
Also it has not broken the 0.5 level fib.
Forming bullish flag on daily..
ETCThe previous high matches the current high, if it is correct you can go down to $7
The yellow line in 4 hours will be bearish if broken
But it is not clear yet
Good luck
