ETH.D (Ethereum Dominance) Weekly TF 2025
Summary:
Ethereum Dominance (ETH.D) has likely bottomed after retracing to its 78.6% Fibonacci level (~6.59%) and is showing early signs of a structural reversal. With institutional inflows, growing staking adoption, and key upcoming Ethereum upgrades, ETH.D may reclaim significant market dominance over the next 12–18 months. Our chart anticipates a bounce-pullback-rebound structure, aiming for 3 target zones: TP1 (23.5%), TP2 (30.8%), and TP3 (39%).
Contextual Market Alignment:
This ETH.D bullish bias aligns strongly with our broader market outlook:
TOTAL Market Cap Analysis → Bullish breakout structure, indicating overall crypto expansion.
TOTAL2 (Altcoin Market Cap Ex-BTC) → Bullish retracement completion and extension targets active.
BTC.D (Bitcoin Dominance) → Bearish confluence zone, suggesting Bitcoin may underperform versus ETH and altcoins, freeing up dominance space for ETH.D to rise.
Chart Context:
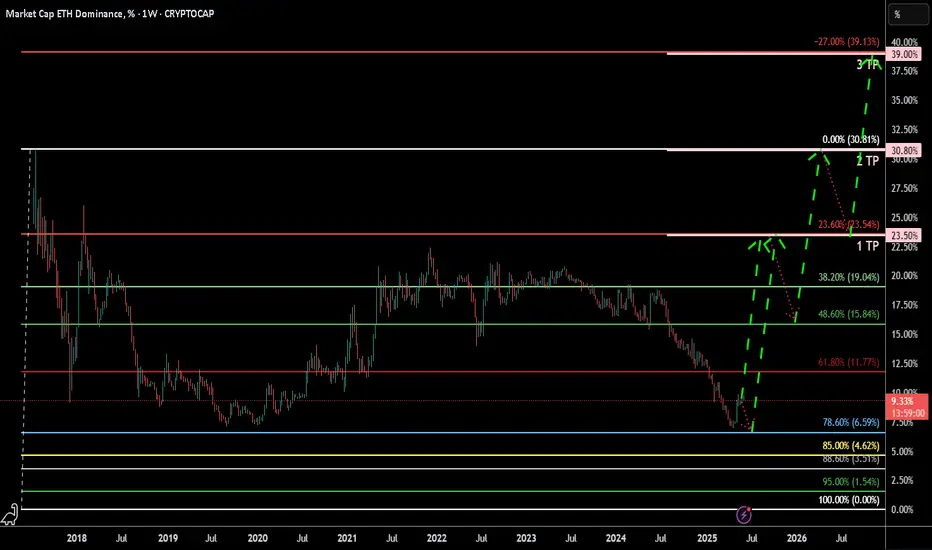
This weekly ETH.D chart uses a Fibonacci retracement from the top (~30.81%) to bottom (0%) to identify potential reversal zones. The dominance hit a key support area at the 78.6% Fib retracement (6.59%), showing a reaction that may develop into a reversal. The roadmap includes:
Rebound toward TP1 (23.54% = 23.5%)
Minor correction or consolidation
Breakout continuation toward TP2 (0.0% = 30.8%)
Extension leg targeting TP3 (–27% = 39%)
Key Technical Observations:
Support Levels:
78.60% = 6.59% (bottom support)
88.60%=3.5%
Possible Resistances:
61.80% = 11.77%
48.60% = 15.84%
38.20% = 19.04%
Resistance & TPs:
TP1: 23.54% (23.6% Fib)
TP2: 30.81% (Full retrace = 0%)
TP3: 39.13% (–27% extension)
Current level: ~9.36%
Clear bullish structure with a “bounce–pullback–rebound” sequence
Indicators:
Fibonacci retracements from ~30.81% to 0%
Structural pattern: rounded bottom / double bottom
Hidden bullish divergence forming on weekly timeframe
Fundamental Context:
Institutional Inflows & ETF Dynamics:
Since July 2024’s launch of spot Ether ETFs, inflows have been strong with a 15-day streak totaling approximately $837 million (~25% of total net inflows).
Recently, the SEC approved options trading on spot ETH ETFs (e.g., BlackRock, Grayscale), deepening liquidity and offering hedging mechanisms.
BlackRock is now pushing to add staking functionality allowing yield generation within an ETF wrapper. If approved, this could markedly increase demand.
Staking Growth & On-Chain Supply Dynamics:
27% of ETH is already staked, and ETF inflows could lift that by >10%.
A staking ETF would institutionalize ETH staking: more capital locked, less circulating supply → supply constraints could support dominance and valuation.
Ethereum Backbone in DeFi & RWA:
Ethereum still leads the Real-World Asset (RWA) space: over 50% market share and ~$5–6 billion in assets tokenized on-chain.
Its core infrastructure underlies the majority of DeFi, smart contracts, and stablecoins, reinforcing ETH.D’s structural resilience.
Network Upgrades & Tech Progress:
The Pectra upgrade (mid-2025) is on the horizon, introducing EIP-7251/7702, improving validator flexibility and network usability.
Combined with recent Dencun improvements, Ethereum is becoming cheaper and more efficient, boosting adoption in L2 ecosystems.
Price action & on-chain indicators:
ETH price has surged ~46% in the past 30 days, driven by ETF demand; some analyst forecasts target $3,000–5,000 year-end.
The withdrawal of ~$1.2 billion ETH from exchanges suggests increasing long-term holdings and less selling pressure.
Integrating with Your Technical Setup:
Level: 78.6%–61.8% bounce zones (6–11%)
Fundamental Support: Institutional re-entry via ETFs often begins with accumulation near support.
Level: TP1 at 23.6% (23.5%)
Fundamental Support: Could coincide with ETF inflows + early vesting of staking narratives.
Level: TP2 (~30.8%)
Fundamental Support: Full retrace driven by mass ETF adoption, options trading, and upgrade momentum.
Level: TP3 >39% (–27% ext.)
Fundamental Support: If staking ETF and yield-bearing structures go live, ETH.D could reach new dominance highs.
Summary of Fundamental Catalysts:
Spot ETH ETF inflows (~$800 M), with options exposure adding liquidity.
Upcoming staking ETF (BlackRock, Grayscale) with >10% locked-up supply implications.
Ethereum remains the DeFi and RWA backbone, sustaining structural demand.
Protocol upgrades (Pectra, Dencun) enhance scalability and adoption.
On-chain withdrawal trends show growing holder conviction.
Narrative / Bias & Strategy Implication:
ETH.D has likely completed its correction and is primed for a staged bullish reversal, mirroring prior cycles. The chart forecasts a rally toward TP1, where some short-term profit-taking and rotation to alts may occur (Alts season). Following that, a retrace may set up the next impulsive move to reclaim lost dominance and eventually challenge prior highs.
Time Horizon: Mid-2025 to late 2026
ETH.D trade ideas
Has the alt season started?Hello friends.
One of the signs of the start of the alt season is the Ethereum Dominance Index, which if it grows, we expect an alt season.
Now what can be seen in the chart is that Ethereum Dominance has started its growth, which means that the growth of altcoins has increased compared to Bitcoin, so we can give more weight to altcoins in the investment portfolio.
Now we can expect that after a certain amount of growth of this index, a correction will begin to start the upward trend.
Make your last purchases in the correction, don't say you didn't say so. (This will be a memory)
I hope you have used this analysis well.
Follow us on Pim to see more analyses.

ETH is backETH says: Hey you there! I am still alive.
ETH.D bounced off a multi-year top. The altseason is inevitable. Fasten your seat belts ...
Ethereum Dominance Possible Doing Like ThisDoing sweep low under 7% and maybe ETH around 1100 and then accumulation phase before back to the range and testing another resist

Super bullish ETH now. ETH.D, ETHBTC, ETHUSD all bottom signalsMy forecast for ETH Dominance. I believe it will come back with vengeance relative to BTC. CRYPTOCAP:ETH.D BINANCE:ETHBTC BINANCE:ETHUSD COINBASE:ETHUSD BITSTAMP:BTCUSD
Ether dominance projectionThis is another indicator for the altseason that everyone is expecting.
Once this starts lifting to the upside we can say that an altseason is brewing .Until then we can only watch and accumulate alts at these lower prices.

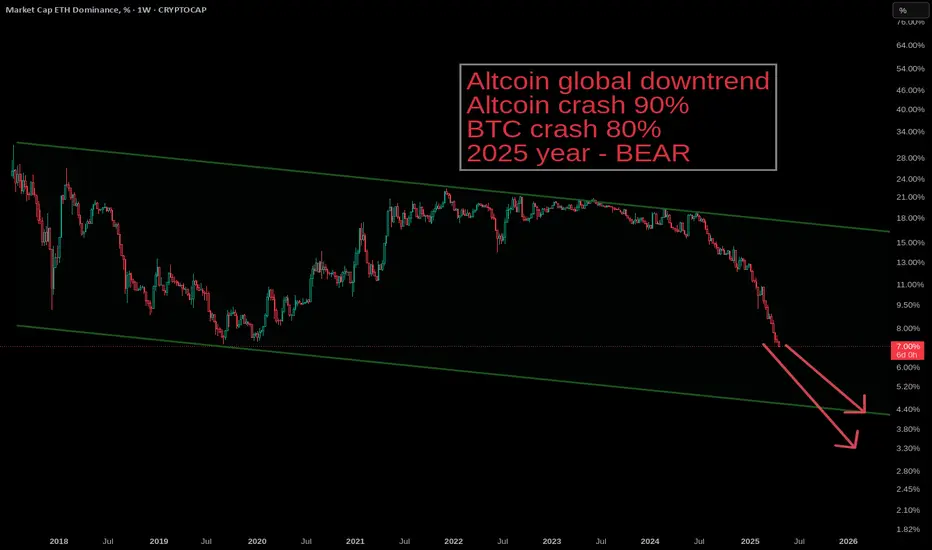
I WARN EVERYONEAltcoin Crash Started March 2024. The Road Down Is Open, Altcoins May Suffer and Fall Another 90%. Expect 2025 to Be Bearish. Harmonic patterns may see ETH dominance fall by 3-4%. Be careful.
My ideas are confirmed -
1.
2.
3.
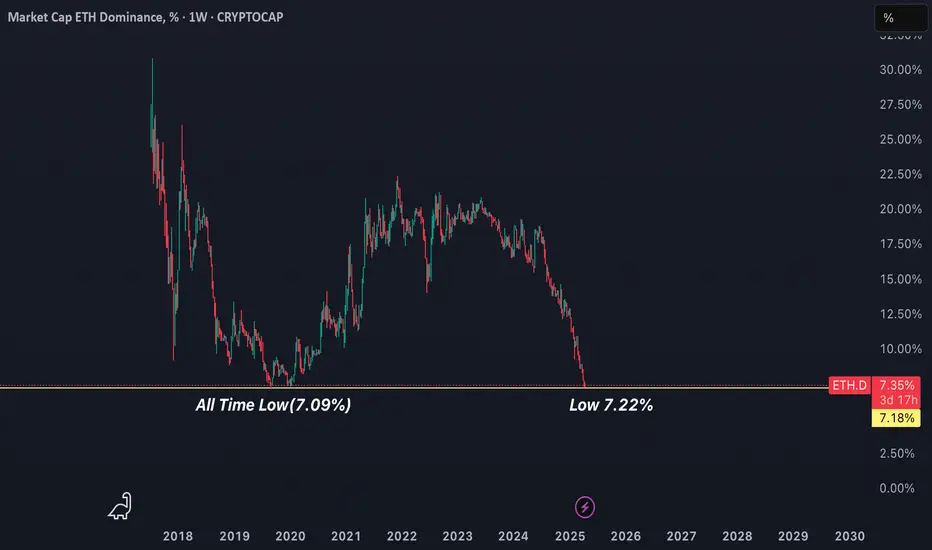
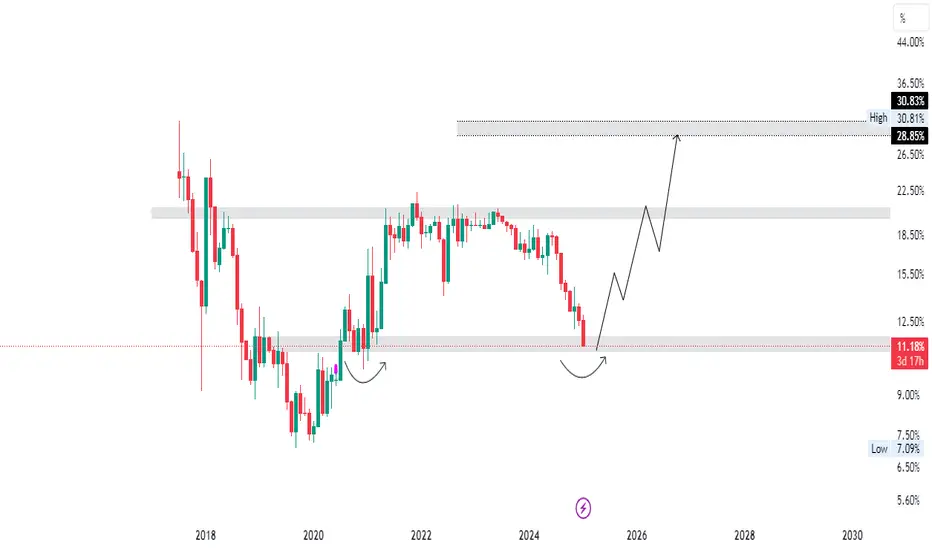
ETH Dominance#ETH is approaching its All time low dominance of 7.09%.
Eth is declining every day as compared to #btc.
Will history repeat itself by reversing from this zone?
Or
#Ethereum will be doomed!
C
Share your views???
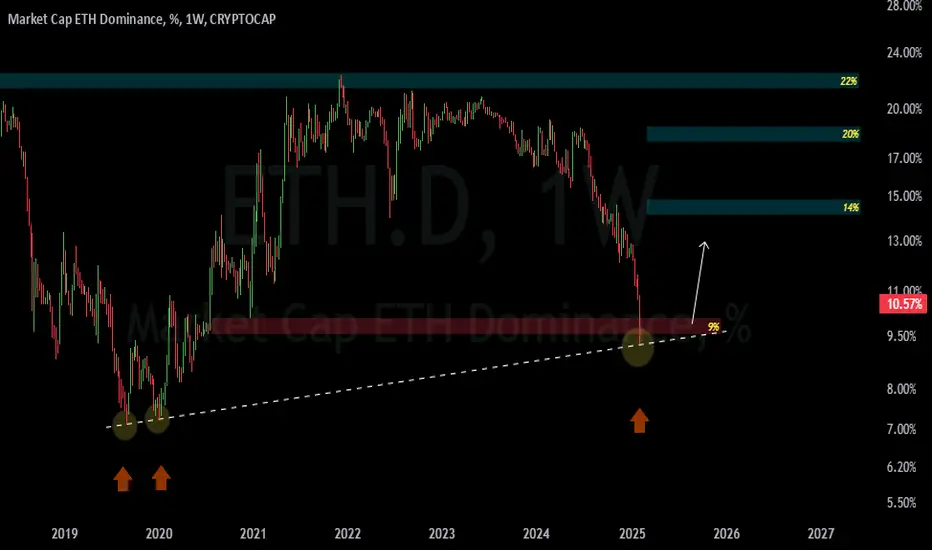
ETH.D potential major bounce incoming!!Expect a reversal on ETH.D here very soon. We have hit major support levels. Sentiment has not been this low for years. BTC and Total Alts also showing strength. Keep an eye on the ETH.D chart.

ETH.D at bottom!This is the buy zone and there would be fluctuations at the bottom.
you can see probable pathway clearly.
THERE WILL BE A PROLONGED ALT SEASON.

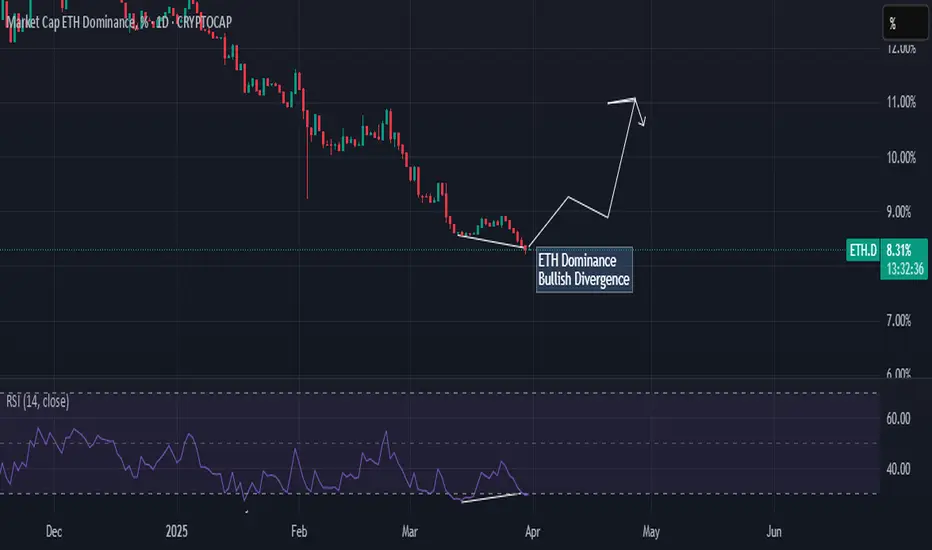
ETH.DOMINANCE Bullish divergenceIn ETH.DOMINANCE chart show clear bullish divergence on daily timeframe which means ETHUSD and ALTCOINS in bullish momentum in coming days. Stay focus on bullish side and ready for uptrend.
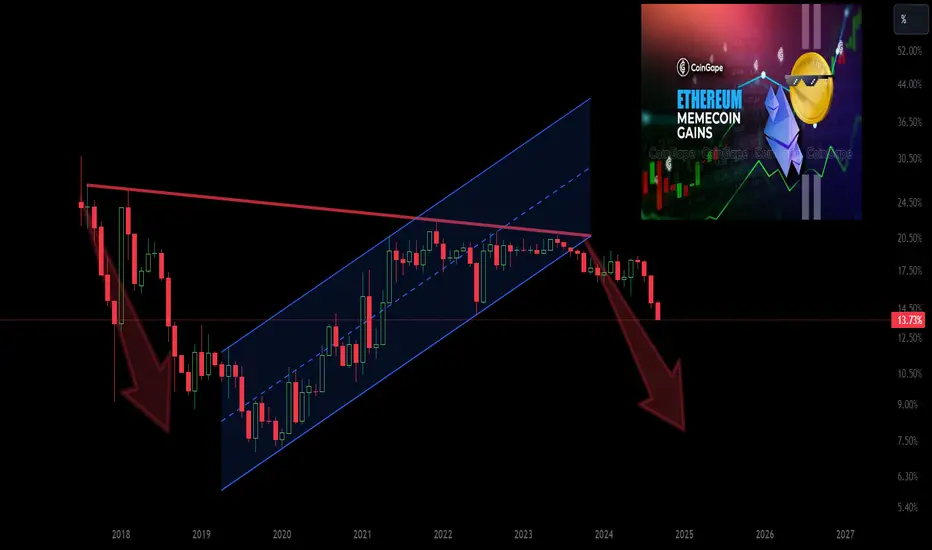
ETH.DInterest in the Ethereum network continues to decline.
Recently, the network has mainly been used for gambling with meme coins.
I see no meaningful use for humanity.
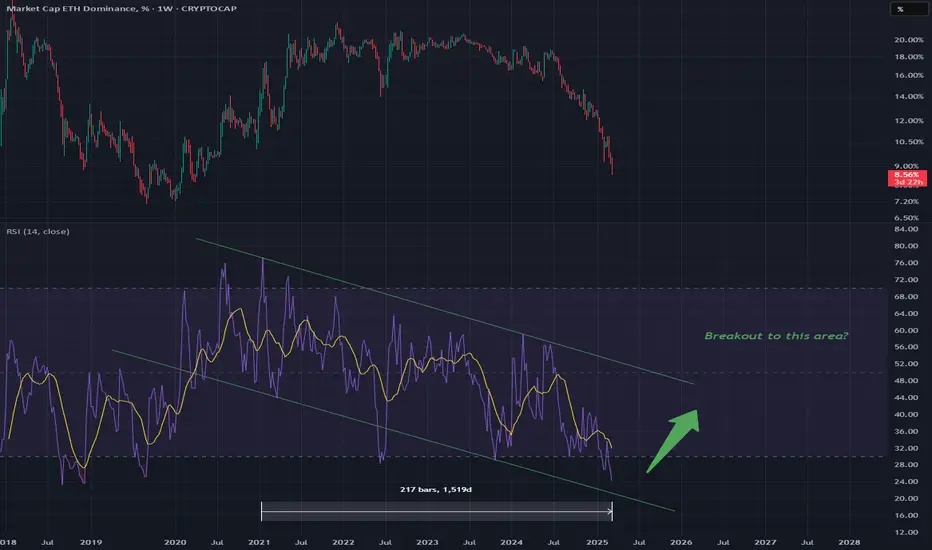
ETH Dominance Very Dominant Downtrend (RSI)The RSI on ETH.D shows a large channel with a strong bearish favor
Currently RSI is in oversold area
I expect on this Weekly chart RSI to reverse and possible one day even get out of this extremely bearish state
Weekly
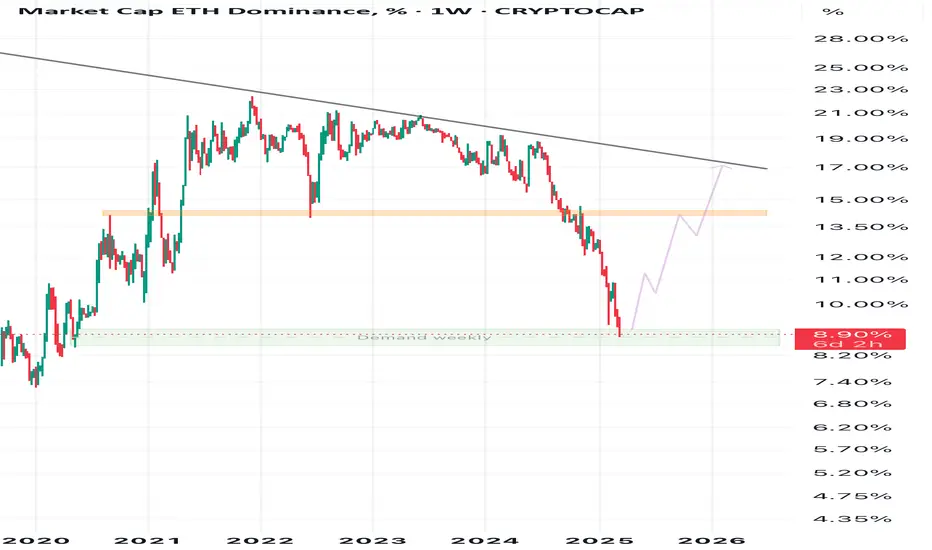
Eth.dEthereum dominance is in weekly demand, the market may turn in favor of Ethereum altcoins at any moment, be patient.

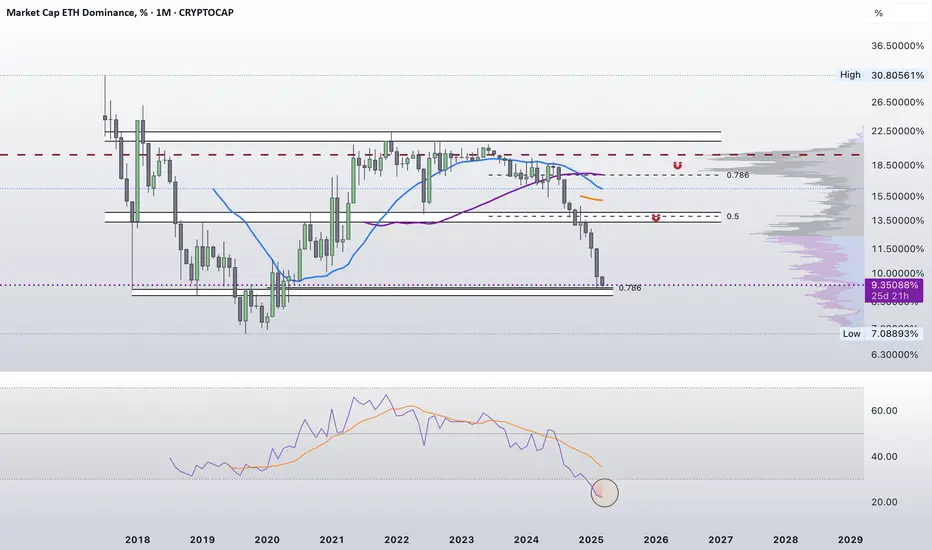
The Value of Looking at Volume in Ethereum DominanceIt seems like it's time for a long-term bull run in Ethereum dominance.

Make Etherium Great Again (MEGA)ETH dominance has reached its absolute bottom. So, guys, Etherium is about to start a massive rebound. If not now then never
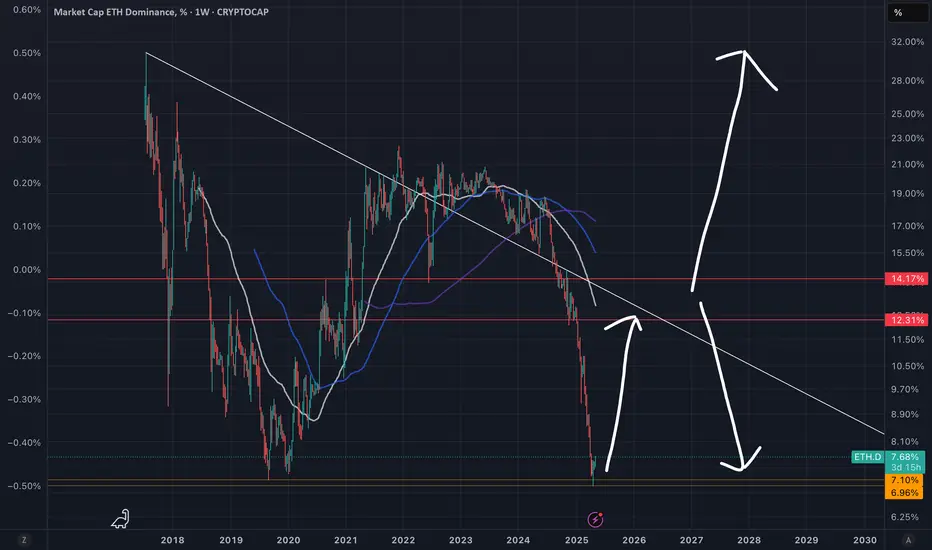
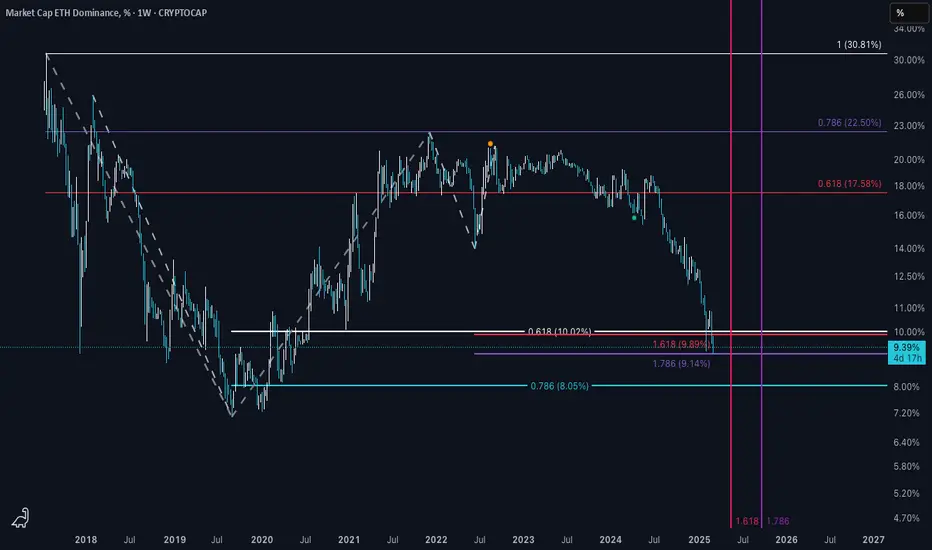
Approaching the Crossroads ETH.D is in the 1:0.618 GW zone.
Currently being held up by the 1.786; If this support structure collapses, there may be a high probability that the 1:0.786 overshoot will be the next stop.
When ETH.D starts taking off and BTC.D starts collapsing, this is the start signal for alt coin season.
The trend based fib time tool suggests this reversal may happen between May and September. This is quite a large time gap so I'm favoring somewhere in the middle. It could also reverse at a sooner time, but patience is key.
Considering the time left in this market cycle, it could be some wicked waves up. But we may be right in the middle of market cycle transformation. Meaning extended/more complex corrections and extended bull run phase. Time will tell if the average 4 year market cycle is something in the past.
- Not Financial Advice -
ETH big pump comingas you can see ETH.D hit the bottom so i think we are so close to altseason
Always do your research
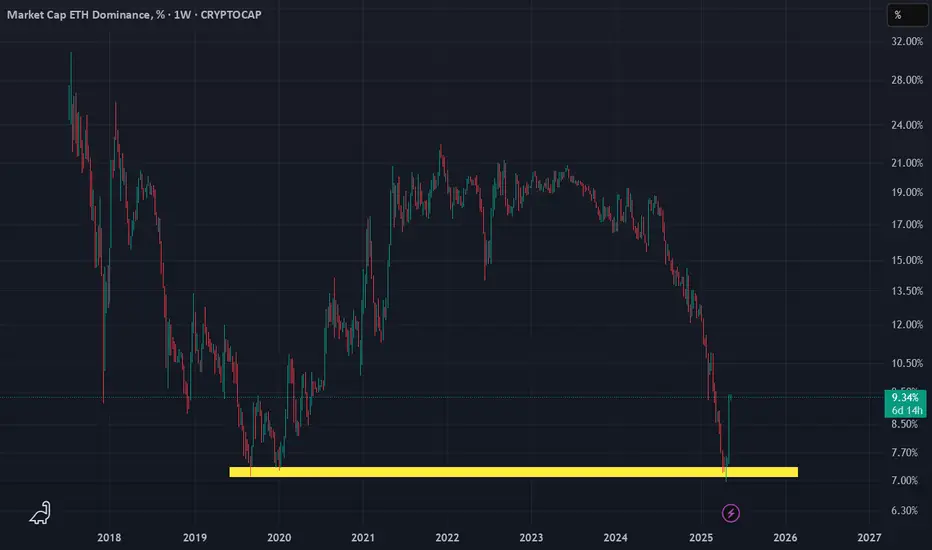
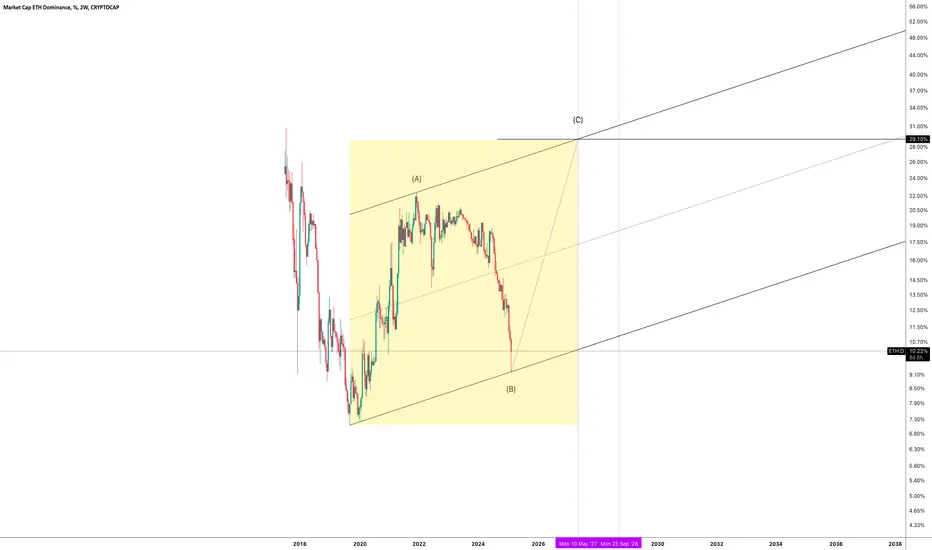
Ethereum DominanceYou all know that the market is made of numbers and algorithms and if you believe it then you never let you emotions decide for you.
I am talking just about this yellow box and I do not care for any thing else and it the way Elliott or Technical work for me. I expect a huge rally for Eth. till to May 2027 or Sep. 2028.
Time will talk about this scenario.
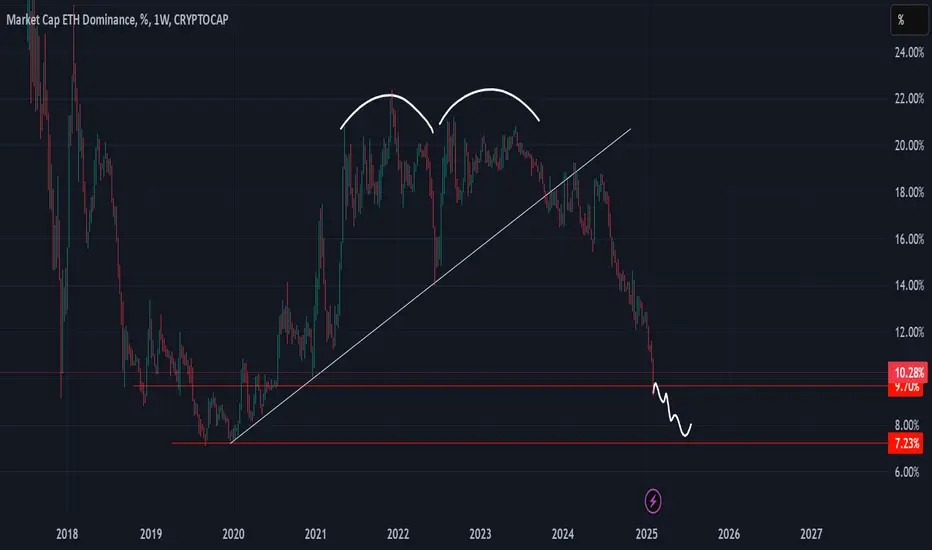
ETH Dominance Double Top FormationIf dominance of ETH can't handle 10% we will see dominance around 7% because double top pattern on monthly - weekly timeframe
But if not break we will see some consolidation here and waiting for other news
Will we see a reflection from here !?CRYPTOCAP:ETH.D
I think it has reached enough levels and we may see a reflection from here .
waiting ...
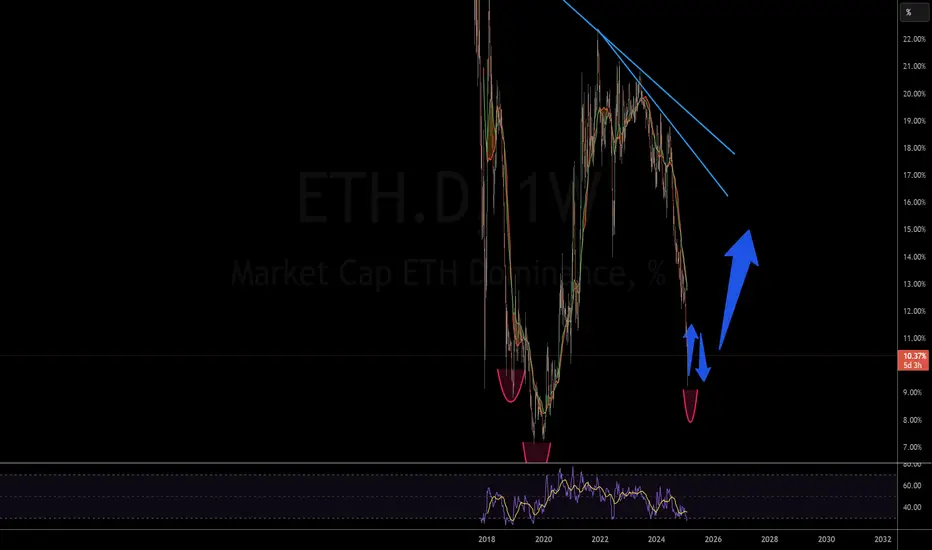
eth dominance poorly drawn but maybe 1 last double bottom?eth btc perhaps double bottom structure, then rally to the downward sloping trend-line for alt season/end of cycle.