Ethereum & BNB on life Support
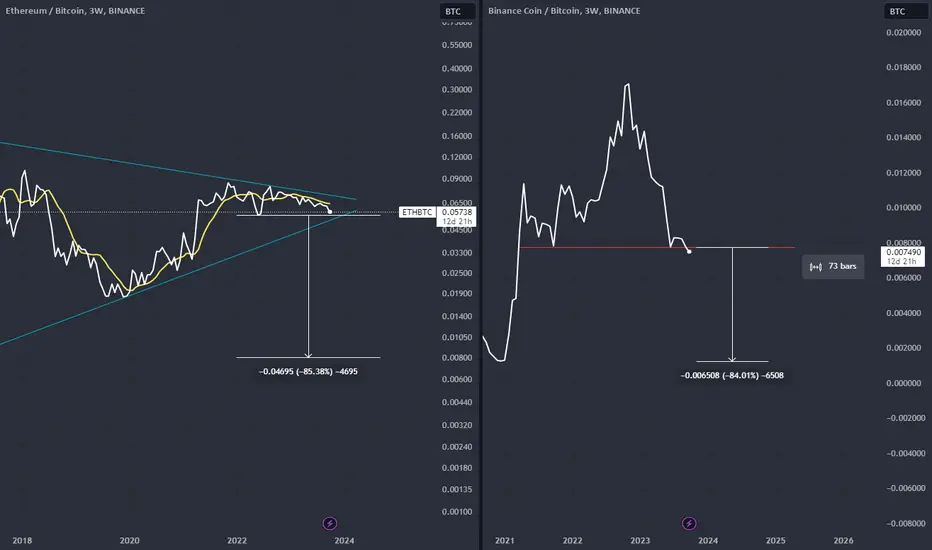
I have posted a chart back in May when I was seeing Ethereum & Binance Chain deteriorate, it looks like the final supports are being tested meaning once these are gone the foundation is completely gone.
The Ethereum supply has become inflationary due to the incentive to "Stake" Ethereum so the question is always true. Where does the Yield come from?. (New users staking Ethereum) meaning it takes no energy to create new Ethereum meaning the more its staked the more inflationary the more it becomes a house of cards before collapse.
BNB? Binance owns 70%+ of the supply its dead.
Ethereum ETF's? Yeah there's a reason they are getting little to NO volume smart money is not buying this Ethereum ecosystem either. My guess? is its there to SHORT Ethereum not Long it.
If I'm wrong in the future on Ethereum I will accept the loss. But my mind is set that Proof of Stake DOES not work. Its recreating central banking at hyperspeed.
ETHBTC.P trade ideas
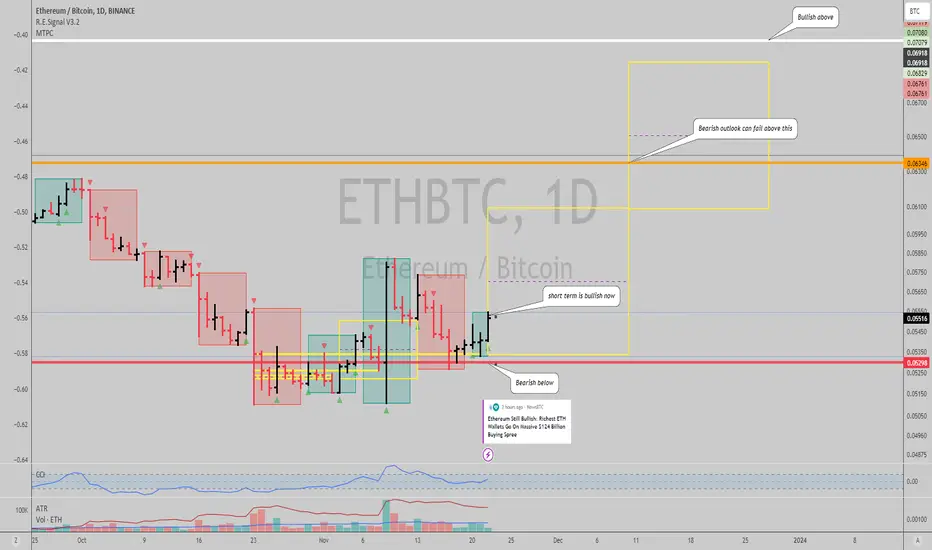
$ETHBTC: Daily trend turning up?Interesting setup forming in Ethereum, BITSTAMP:ETHBTC had been bearish for a while since the monthly trend turned down in it...
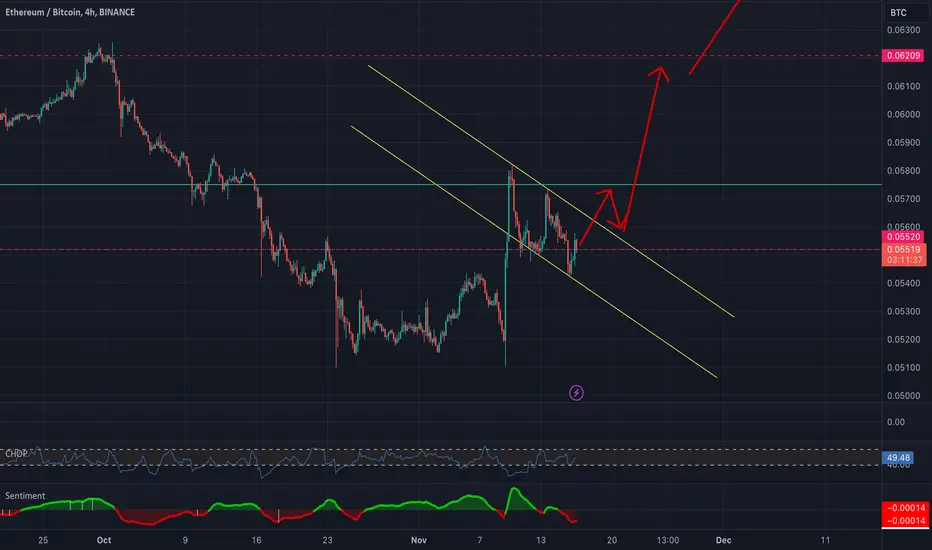
Makes you wonder if the trend will reverse after this bottom pattern formed. We already had one big push with the ETF news, and the chart suggests a 2nd bullish swing is forming (short/mid term).
I do hold some exposure to it, but my largest crypto position is in BTC. I haven't had more ETH than BTC in a long time, probably not worth taking that risk in general, but reassuring for the % allocation I invested in it though.
Best of luck if you use this etup to buy Ethereum.
Cheers,
Ivan Labrie.
is $ETHBTC gonna make a double bottom?Ethereum BITSTAMP:ETHBTC is ready for another leg up and i think could make a double bottom patterns, and if it happens, Ethereum is most likely to out perform Bitcoin, which means alts season is about to begin.
this not a financial advice, please do your own research.

ETH.BTC Bullish DivergenceGood day Everyone,
I think according to this ETH.BTC chart we can see some bullish price action on alt coins, we also have a 4 hour bullish divergence as well as a 4 hours breakout from a downtrend with confirmations. The next few days i expect it to revisit .055-.058 for a retest.
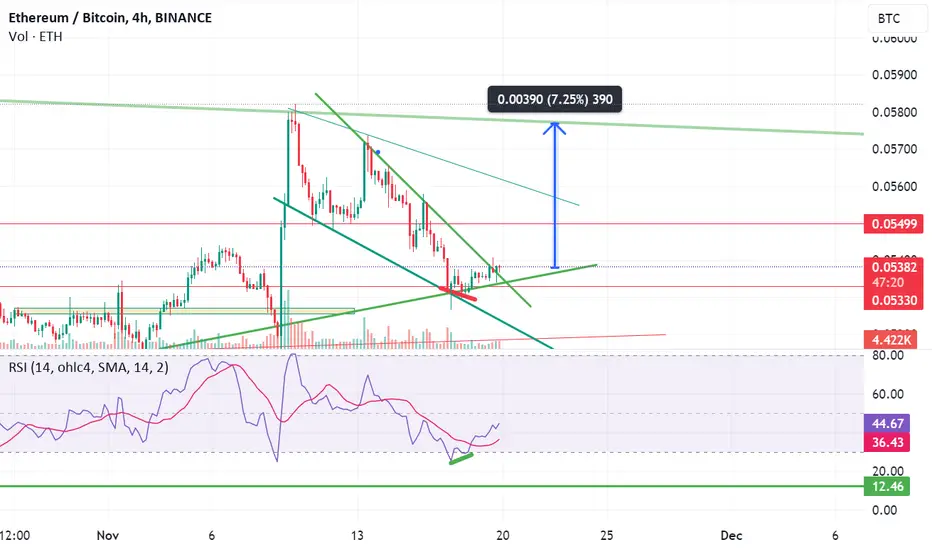
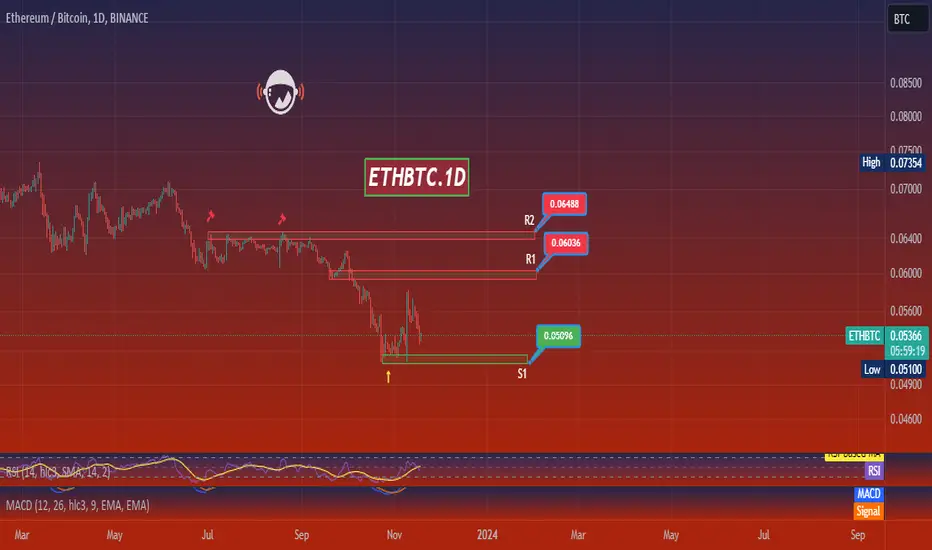
ETHBTC.1DBased on the given market data, we can see that the ETH (Ethereum) is currently trading at 0.05368 against BTC (Bitcoin).
From a technical analysis perspective, the 4-hour Relative Strength Index (RSI) stands at 38.41, indicating that the asset is approaching the oversold territory. The Moving Average Convergence Divergence (MACD) on the 4-hour chart is at -0.000055, suggesting a bearish momentum.
The Bollinger Bands (BB) on the 4-hour chart is at 0.05577, with ETH trading below the middle band, indicating a bearish trend. The first, second, and third support levels on the 4-hour chart are at 0.052, 0.051, and 0.050, respectively, while the resistance levels are at 0.055, 0.057, and 0.058, respectively.
On the daily chart, the RSI stands at 45.34, which is a neutral position. The MACD on the daily chart is at -0.00008, suggesting a bearish momentum. The Bollinger Bands on the daily chart is at 0.057, with ETH trading below the middle band, indicating a bearish trend. The support levels are at 0.051, 0.049, and 0.048, while the resistance levels are at 0.060, 0.064, and 0.067.
The 7-day RSI is at 31.49, suggesting the asset is oversold and that a price increase may be imminent. The MACD on the 7-day chart is at -0.00317, suggesting a bearish trend. The Bollinger Bands on the 7-day chart is at 0.05234, with ETH trading below the middle band, indicating a bearish trend.
In conclusion, the market data suggests a bearish trend for Ethereum in the short term, but the oversold condition on the 7-day RSI could mean a potential price reversal. As always, it's crucial to consider other market factors and your risk tolerance before making investment decisions.
ETH/BTC long ideaAfter we have seen an aggressive push in the last days, and a corrective wave down, the pairing looks like hugeh upside potential agains BTC
The most mysterious Bart of cryptoI will watch ETH/BTC on this thread.
I love this chart. But I don't have a strong opinion yet. But honestly I'm *slightly* bullish about this Bart :D Just because of the overconfidence of Bitcoin maxis lately.

ETHBTC potentially ripe for a bullish reversalif i had to guess i'd say the daily ETHBTC chart looks ripe for a (triple tap) reversal on the weekly. tracking this idea on the daily.
blue and red zone mark the weekly range (zoom out and look left).
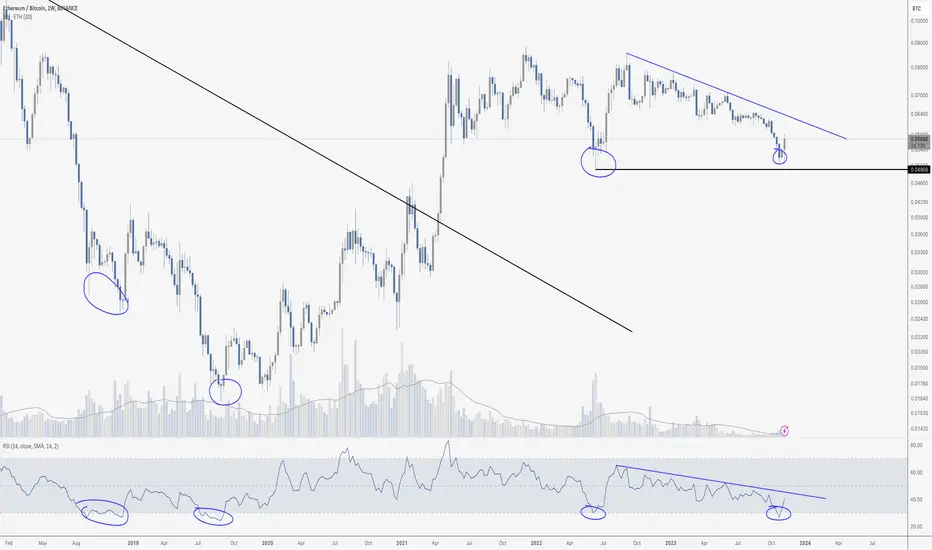
ETH WEEKLY WAS OVERSOLDDo you remember the weekly chart that I have shared multiple times? This shows that ETH was oversold on RSI for only the 4th time EVER against Bitcoin, while we had unreasonable fear, uncertainty and doubt.
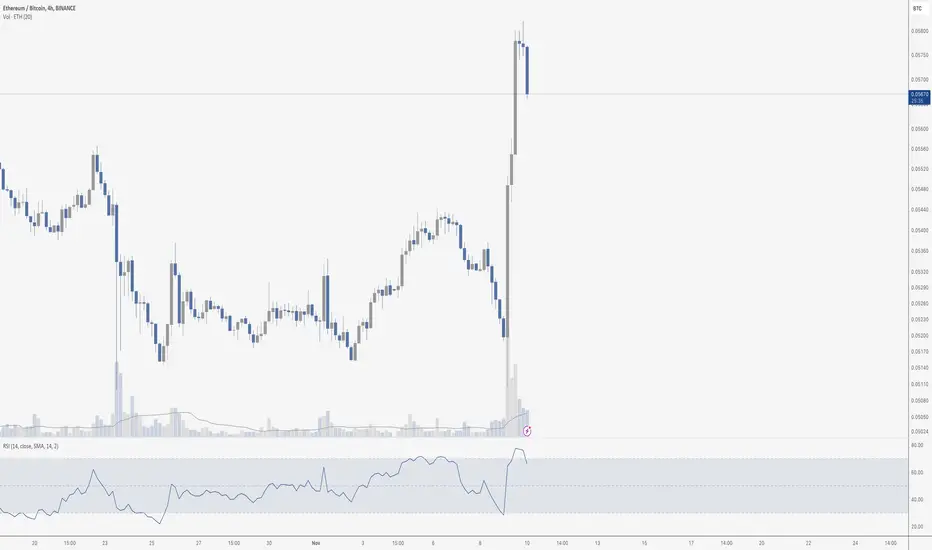
ETH/BTC Skyrockets!The above shows what happened right after the ETH Spot ETF news was announced. We had insane volume and a spike in under an hour, with Ethereum finally bouncing on the Bitcoin pair. It is naturally dropping now as traders absorb the news, but I think that we are finally seeing the reversal that I have been anticipating for so long.
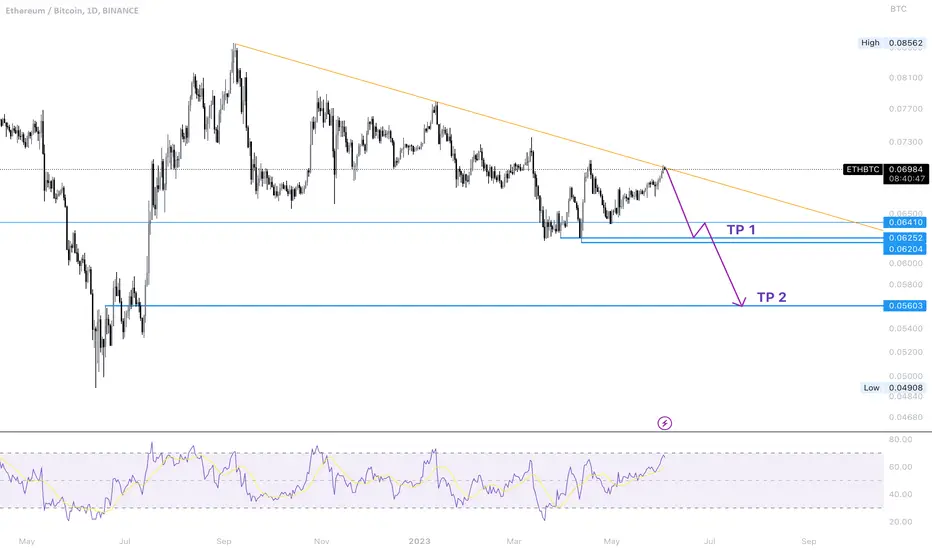
ETH/BTC Catch up time?ETH/BTC chart broken down into some simple key areas. We've recently had a double bottom as ETH has lost strength against Bitcoin, however for me it is clear that if the breaker block is flipped after such a strong reaction from the double bottom ETH is on its way to reclaiming strength against BTC.
The next level of major resistance would be 0.0625 area. After BTC's huge move recently and other L1's like SOLANA and INJECTIVE etc ETH has had a lagging response in comparison.
With profits from BTC filtering down the next obvious place would be Ethereum before some sort of mini alt-season if that's possible at this stage. Coupled with the news that Blackrock have just registered an Ethereum trust in Delaware ETH looks very strong currently.

ETH/BTC - Wicked right to the trendline from previous postAfter seeing ETH/BTC fall right back to 0.051 at the same trendline we have seen many touchpoint of support. Right as we touch that trendline the news comes out of BlackRock's ETH ETF. Amazing how that works.
It looks like we are at the beginning of the Ethereum bull runI am an Ethereum buyer in this price range BINANCE:ETHBTC
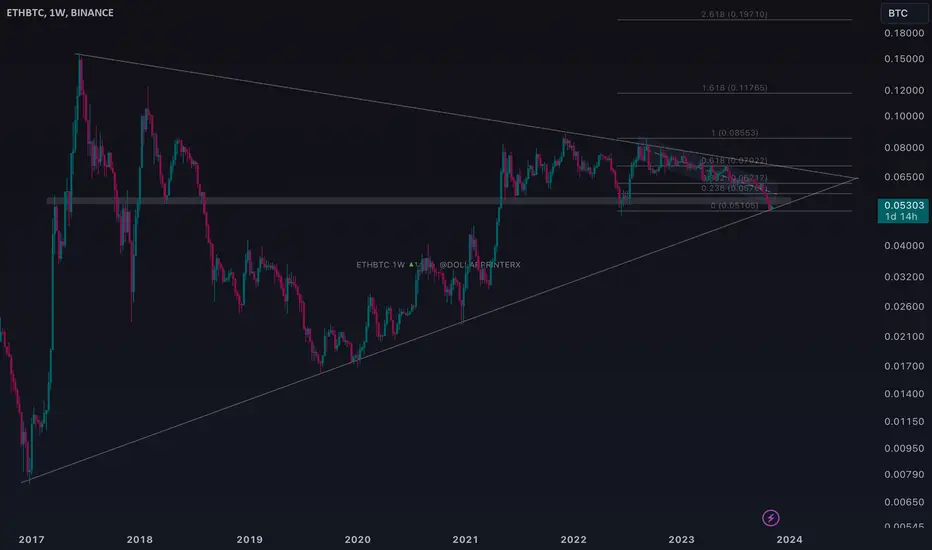
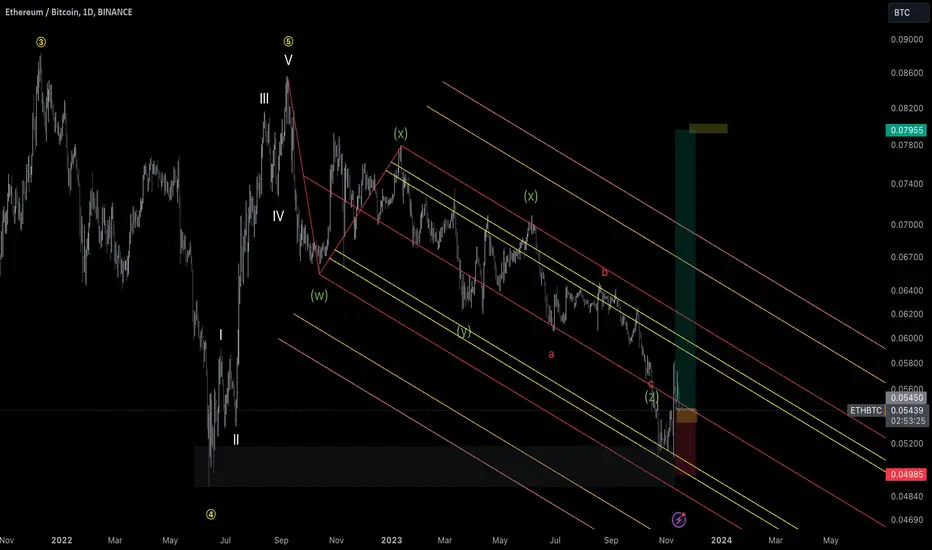
When is the best time to buy Ethereum?The Ethereum to Bitcoin price ratio chart indicates that Ethereum's price remains influenced by the fluctuations in Bitcoin's price.
The pattern displayed on this chart suggests that Ethereum is likely to endure buying pressure from Bitcoin in the market.
However, the ideal range to anticipate a more substantial movement for Ethereum against Bitcoin would be around the parity level of 0.0490-0.0456.
Furthermore, the market is expected to facilitate more substantial bullish movements for Ethereum by providing additional support for Ethereum.

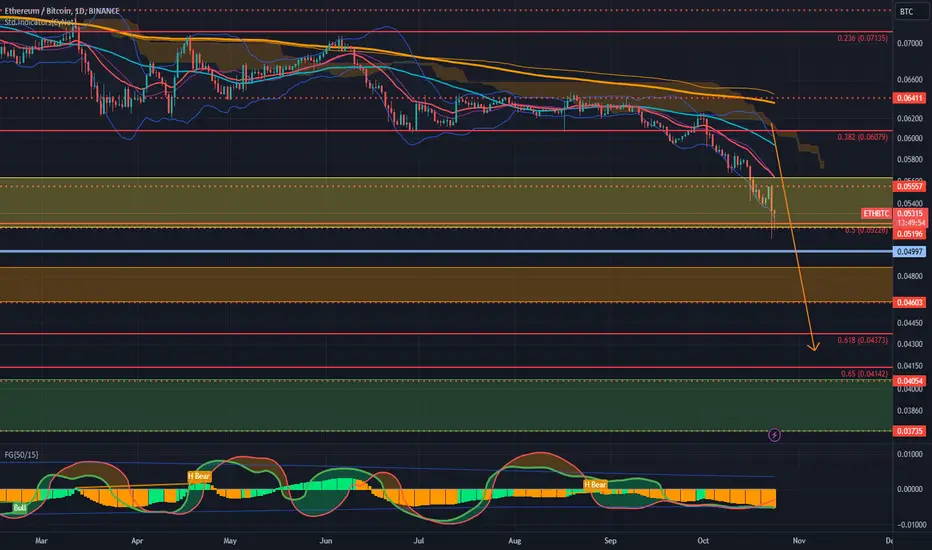
ETH/BTC first accumulation zone reached.Starting to DCAing in a little at this level from BTC.
Will start DCAing harder once the second, and a lot more within the golden pocket, and especially the third accumulation zone is reached.
ETH vs BTC have the potential to fall even lower. But long term, I am bullish, hence looking for opportunity to accumulate ETH now that the first phase of the Bull Market seem to have commenced with BTC pumping first.
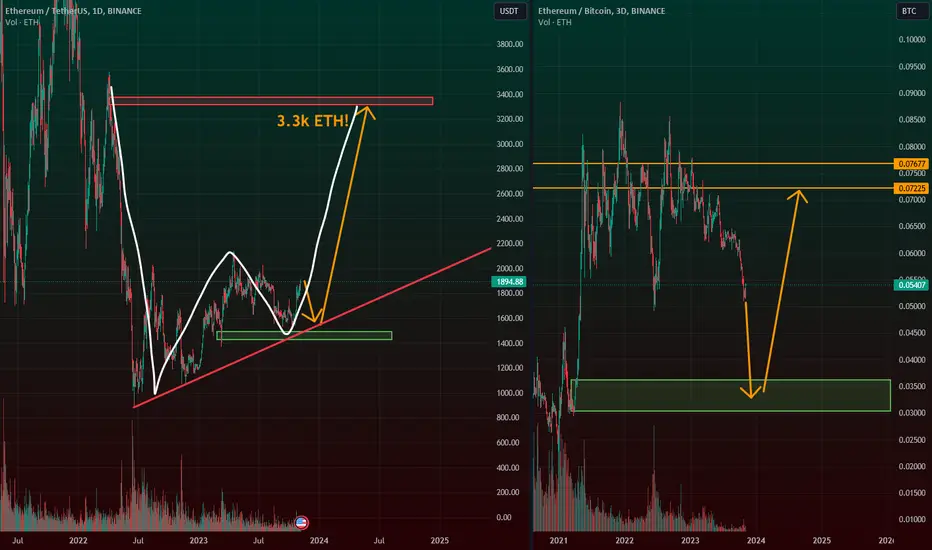
ETH $3.3k after dipI believe after hitting support we will finally test our Supply zone at $3.3k all shorters will be eliminated. ETH/BTC is due for 1 hell of a bounce/rally
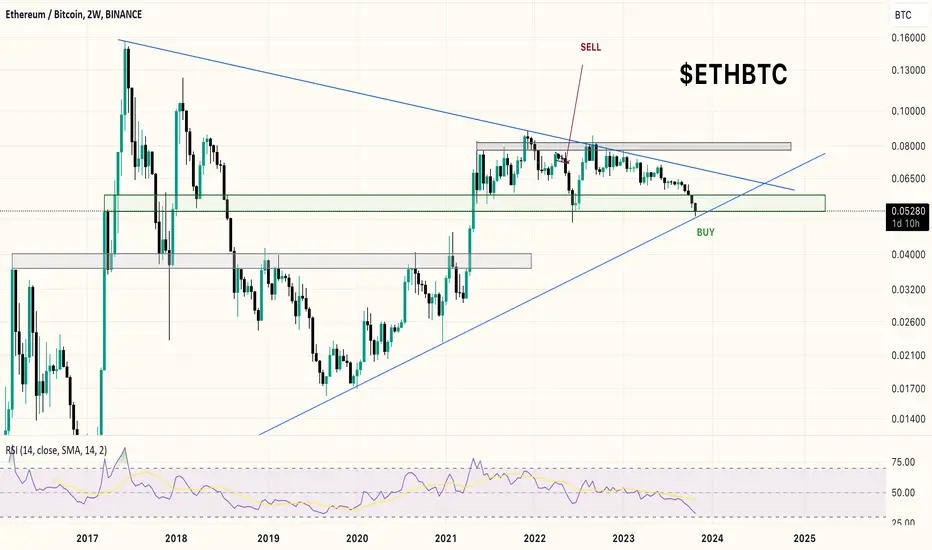
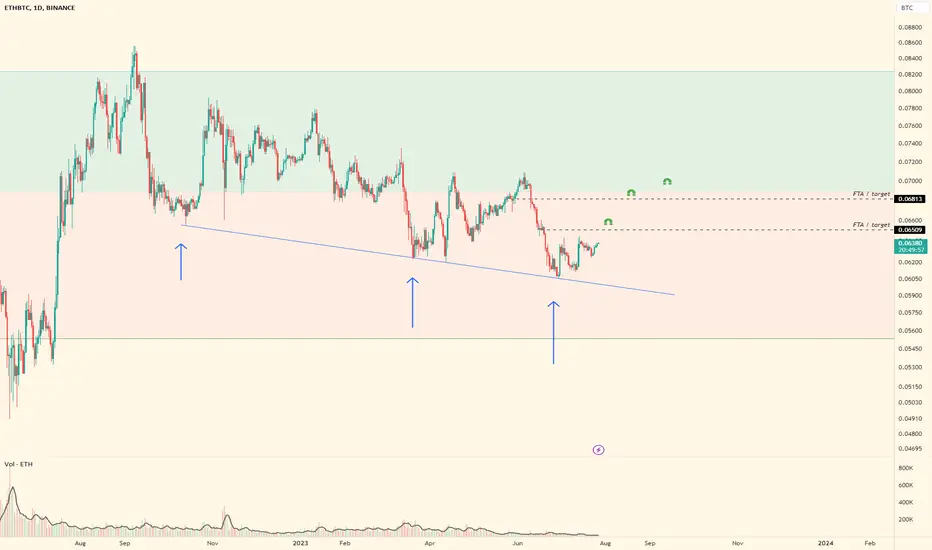
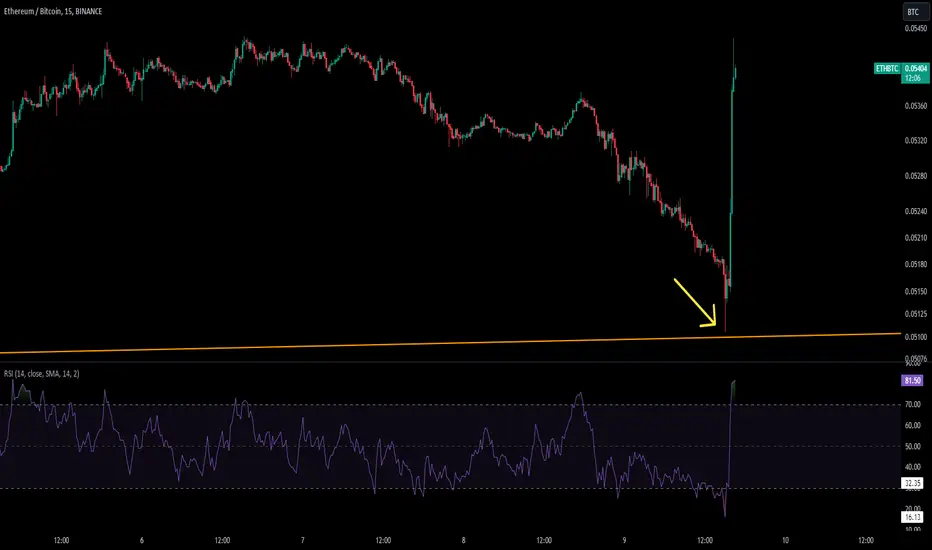
Ethereum / Bitcoin Trying to Find a SupportEthereum's current pullback presents an intriguing scenario.
The BITSTAMP:ETHBTC price seems to be seeking support in the range where it retraced during the mid-summer of 2022.
Currently hovering around 0.05, this level stands as a crucial support zone.
If Ethereum maintains above this mark, a potential climb to 0.058 and beyond becomes feasible.
On the flip side, dropping below 0.05 might extend the downtrend. The next moves are uncertain, so stay tuned and observe the market dynamics closely.

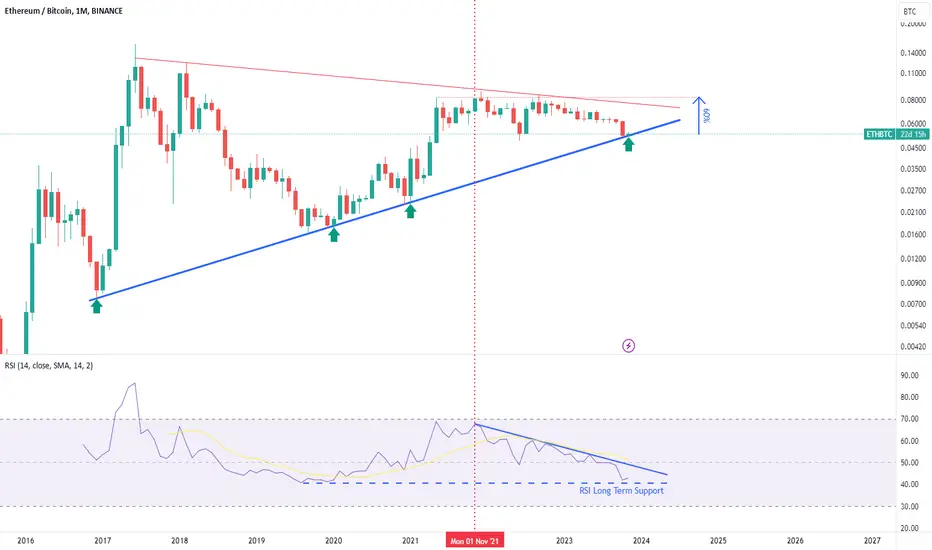
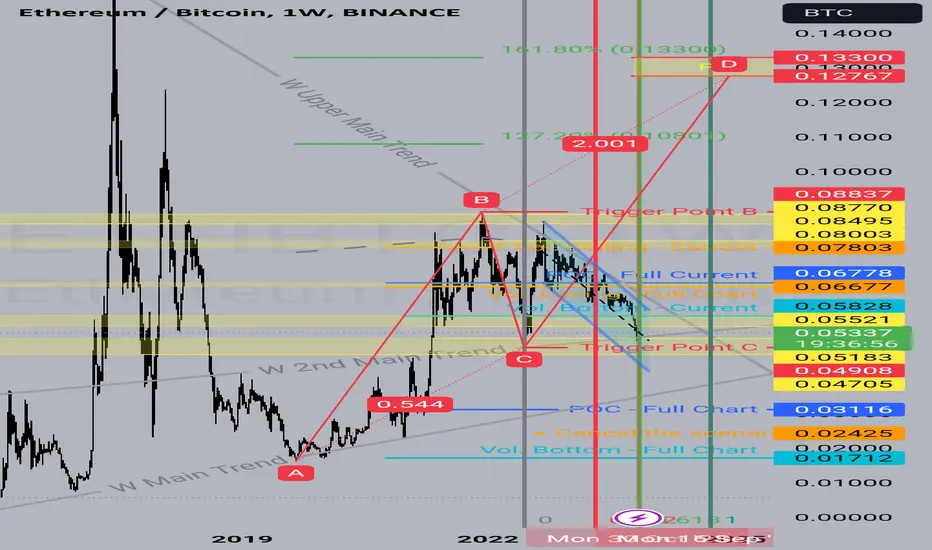
ETH/BTC on weekly chart looks nice I believe eth/btc is looking solid now and trying to breakout the main trend since it is at the upper level of the trend
Also, we have a bullish harmonic ABCD that has higher targets.
All the best insha Allah!
ETH to Massively Outperform BTC in the NEAR Future!all the signs are there:
- SEQ 9 weekly on tom-de-mark
- oversold on weekly RSI and lowest on 2 weekly MRI
- Trendline (multi-year)
- Demand zone
- Support zone
- Range low