ETHBTC.P trade ideas
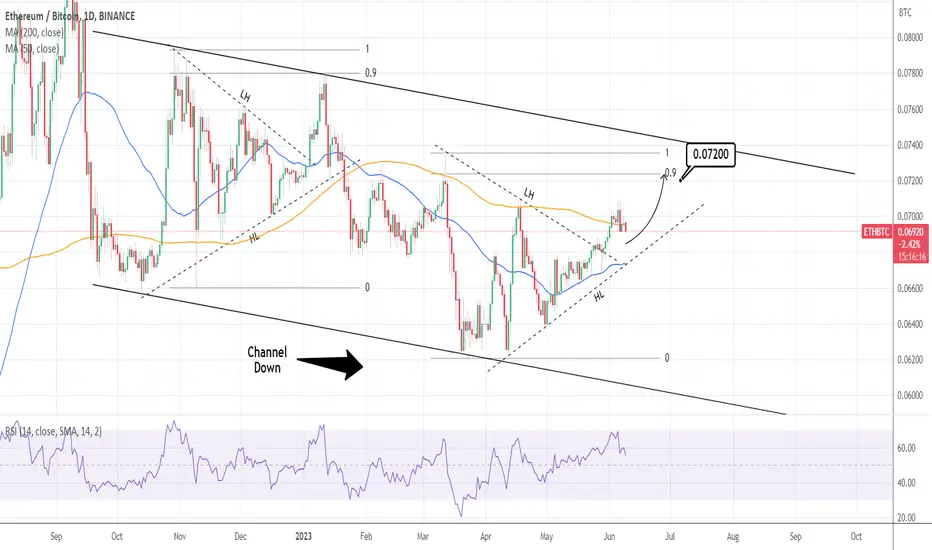
ETHBTC: targeting the top of the Channel Down.ETHBTC is consolidating right now on neutral 1D technicals (RSI = 55.810, MACD = 0.001, ADX = 53.149) supported by the HL trendline. A bounce on the 1D MA50 would be ideal for a new buy, but if it breaks the trend turns bearish. Until it does, we are bullish, targeting the 0.9 Fibonacci (TP = 0.07200) as it happend on January 2023. But of those where the bullish waves inside a long term Channel Down.
## If you like our free content follow our profile to get more daily ideas. ##
## Comments and likes are greatly appreciated. ##
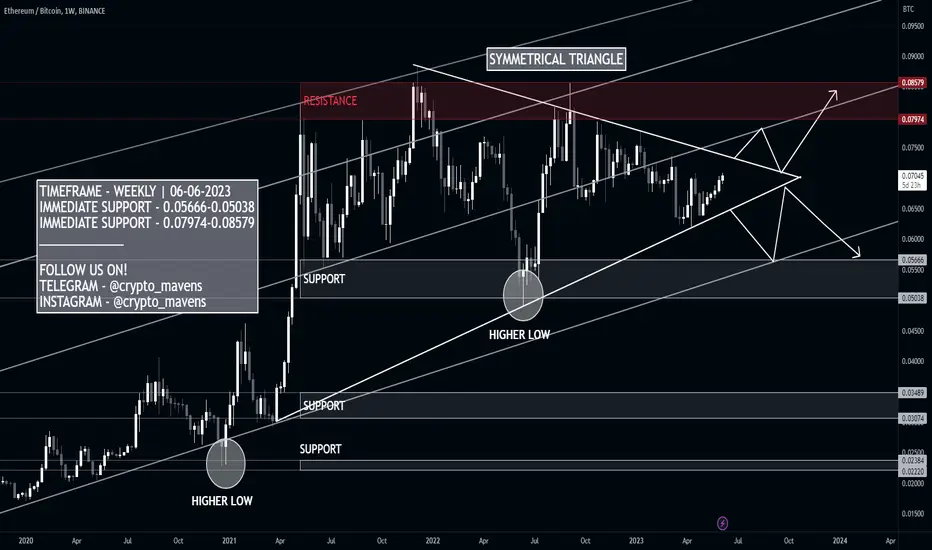
ETHBTC showing upside to come to 0.08 due to W and TriangleW Formation has formed on the ETH/BTC pair.
There is also an Ascending Triangle, with higher lows and same highs.
We are near the neckline where the price is quite likely to break up and out of.
We have other signs like
7>21 MA
Price>200 MA
RSI>50
Target is for the ETH/BTC to head to 0.08
For those that don't know how it works...
HOW ETH/BTC works
ETHBTC is a trading pair similar to Forex pairs.
With crypto, it represents the exchange rate between Ethereum (ETH) and Bitcoin (BTC).
And as always with trading pairs, there is a primary and secondary coin.
The primary (Ethereum) is how much 1 unit of ETH can be exchanged for a certain amount of Bitcoin.
ETH/BTC
1 / X No. bitcoins.
Right now, the current ETH/BTC exchange rate is 0.06.
This means, 1 ETH is worth 0.06 BTC.
Or conversely, we can see how much 1 BTC is worth in ETH.
To do that we divide the two.
BTC/ETH = 1/0.06 = 16.66 Ethereum per Bitcoin.
ETHBTC works based on the principles of supply and demand in the cryptocurrency market.
The exchange rate is determined by the ongoing buying and selling activity of traders on the exchange platform.
When there is more demand for Ethereum relative to Bitcoin, the ETHBTC price tends to rise.
Conversely, if there is more demand for Bitcoin relative to Ethereum, the ETHBTC price tends to fall.
Right now we can expect the ETH/BTC to go up, which means Ethereum will mostly likely strengthen in the near future compared to Bitcoin.
Hence I expect the price to go to ETH / BTC = 1: 0.08.

BTCETH Fractal What I have noted are three distinct peaks with curved resistance lines and two inclined support lines.
The period in-between was the sideways market and the big fractals are the bull and bear markets.
Both saw distinct peaks in ETH against BTC but the first one showed a more volatile ETH break the lower trendline into a deviation before continuing trend whereas the second fractal saw a stronger ETH that held the line through the fractal pattern.
I see the first fractal also lost the critical support at almost exactly the same satoshi value as the complete fractal.
First fractal saw ETH trapped in the curved resistance and fell a massive 52% before finally breaking the resistance.
BUT
The second fractal has seen ETH hold the trendline and break out from the resistance to the upside with a 10% increase already.
I hope you find this useful, but I think all of the new ETH wallets and holders is beginning to tell a story.

ETH Keep an eye on the indicated trendline, which is a key support for this local uptrend. If the trendline is broken, the price may decline towards the zone of the 200 EMAs.
eth/btc I see in next months some dangerous moves will happen in crypto market. BINANCE:ETHBTC is going up. and all whales are taking all Ethereum in exchanges. I Think all market will going up , but bitcoin will gonna down , and we will see almost a Flipping in market. But no one can take bitcoins place in world. that will hard for bitcoin. but bitcoin have to be success.
Sigificant double breakout in ETH/BTC. Will likely outperform.Narrative is overly bearish ETH due to position in market cycle. ETH is a different asset compared to 2018 however, with substantially better supply dynamics than Bitcoin, increasing average returns for ETH over BTC.
The charts reflect this. A signicant double breakout on the charts recently suggests ETH is starting to breakout of its downtrend against BTC which could signal more significant outperformance to come, particularly when the crypto market is less bearish.
Long ETH/BTC.

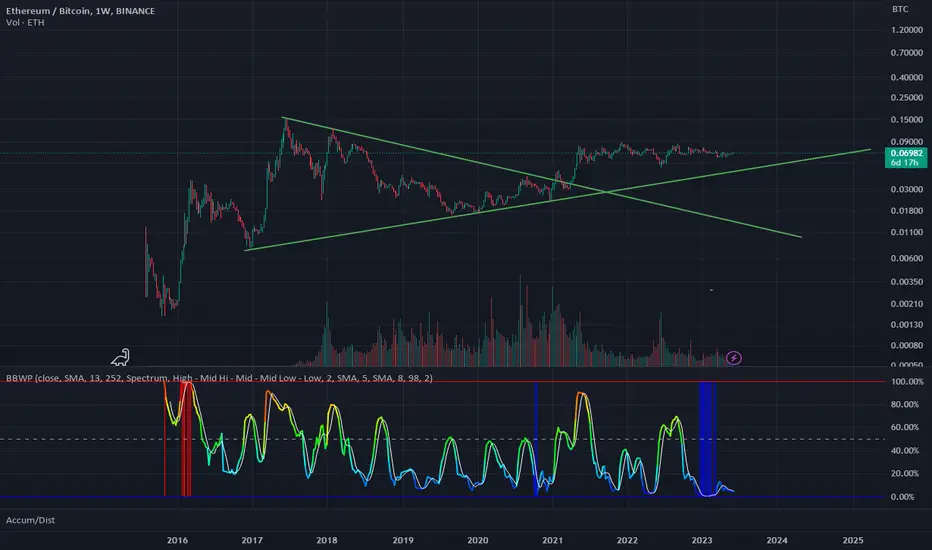
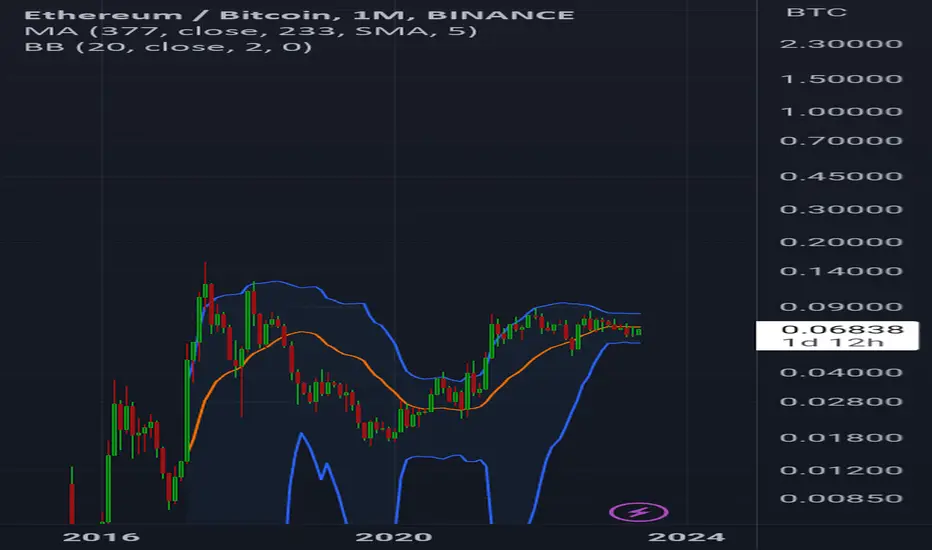
The end of Bitfuck and the beginning of the glorious Eth Reich!ETH/BTC volatility is at extreme lows on the weekly chart, it has been crabbing for a 2 years in a range. When it does break out I suspect it will move massively regardless of direction.
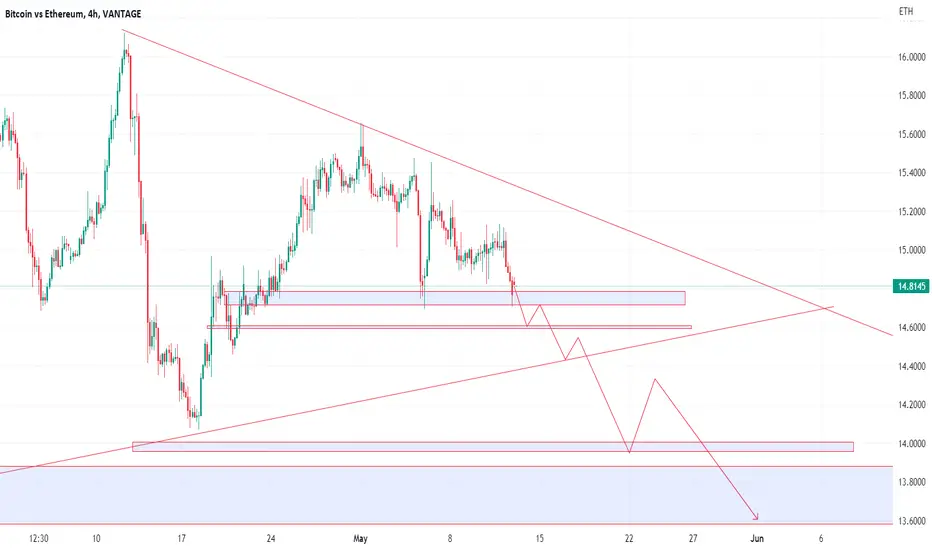
ETH/BTC looking shakyETH/BTC is not looking too good.
Bitcoin rose today to take out liquidity, and Ethereum failed to move higher.
Keeping an eye on this chart for now, as a continued drop would mean good shorts for ETH.
A rise above here would mean we target $2027 for ETH next.
ETHBTC - Altseason is starting?My expectation is that the alt season has started but it won't last long. Growth will be but not for all coins.
My recommendations:
Do not buy old projects 2018-2020
Give preference to new projects 2021-2023
Place take profit with a ladder
When the price ETH\BTC reaches 0.75-0.77, reduce the positions to 80%
The information provided here is for informational purposes only and should not be considered as financial or investment advice.
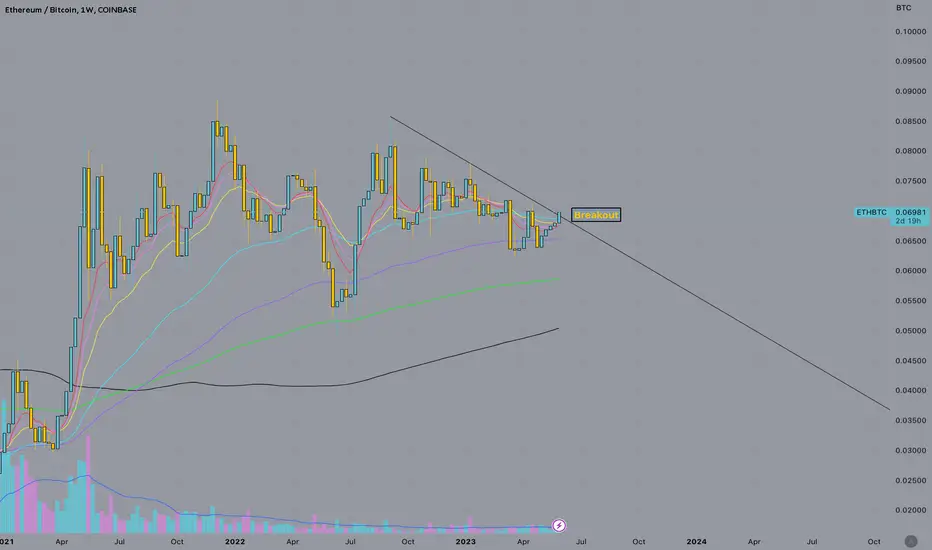
ETH/BTC most important chart in cryptokeeping it simple this is a weekly breakout on eth btc. with this ratio breaking out expect to see alts outperform bitcoin and volatility with a bias to the upside return to the market.
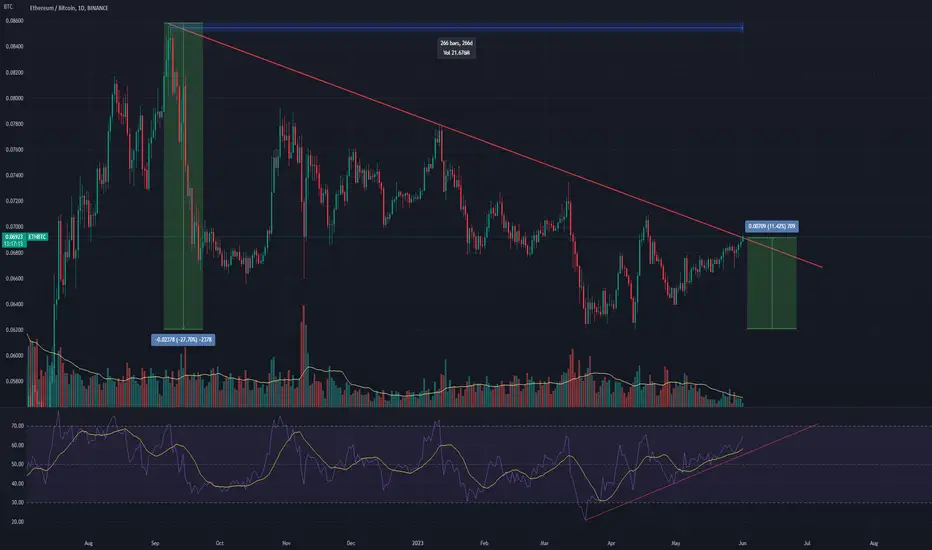
Is the altcoin super party just around the corner?Is the altcoin super party just around the corner?
In the daily time frame, the 266-day downward trend line in the Ethereum to Bitcoin chart! After correction, about 28% is breaking!
According to the RSI indicator and its growing trend, as well as the 12% price growth from the floor, we can conclude that we are extremely close to the altcoins boom (even in the next few days).
Don't forget capital management and compliance with risk to reward.
Good luck and profitable.
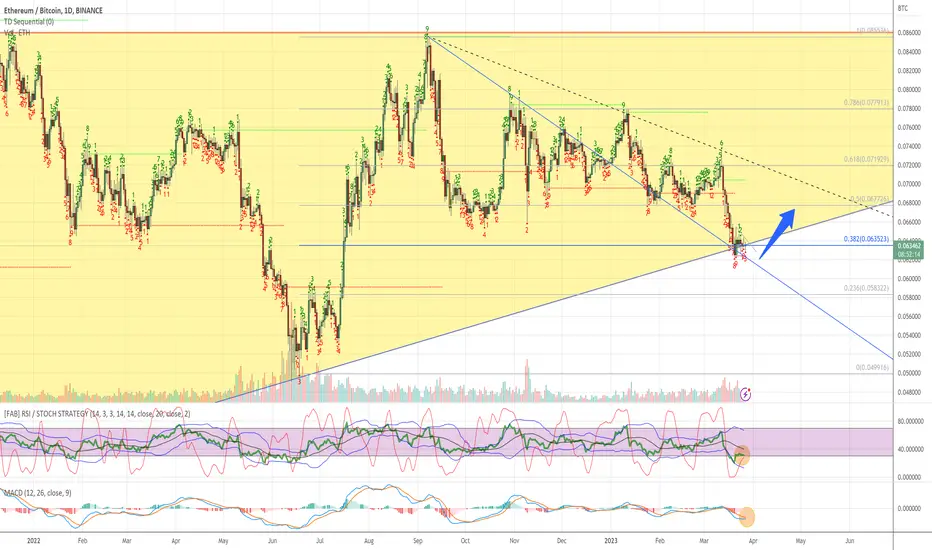
ETHBTC Potential bullish break-out of the 9 month Falling Wedge.The ETHBTC pair has been trading within a long-term Falling Wedge pattern since September 2022 and currently it is testing its top. This is also where the 1W MA50 (blue trend-line) is, so we can potentially have a double bullish break-out.
The 1W RSI has already broken above its 9-month Channel Down, issuing the first signal. If the price does break and close above the top of the Falling Wedge, we will target every Resistance level all the way to the 0.08560 High and buy on every pull-back. As you see the Fibonacci retracement levels match well with those Resistance levels, which are basically the Lower Highs of the Falling Wedge.
If the price fails to close above the Falling Wedge, then a potential rejection can pull it all the way down to the 0.06200 Low.
-------------------------------------------------------------------------------
** Please LIKE 👍, FOLLOW ✅, SHARE 🙌 and COMMENT ✍ if you enjoy this idea! Also share your ideas and charts in the comments section below! **
-------------------------------------------------------------------------------
💸💸💸💸💸💸
👇 👇 👇 👇 👇 👇

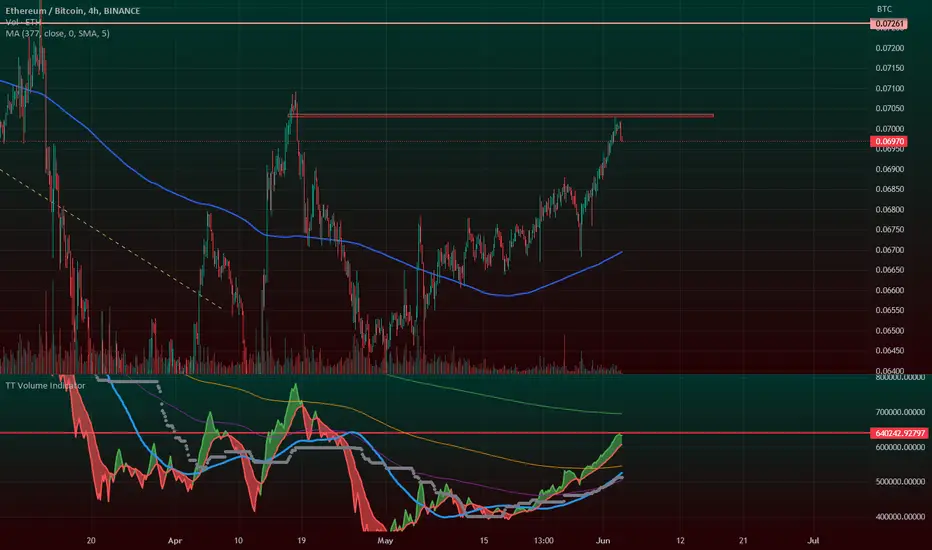
Possible long scalp on ETHBTCPossible (low margin) Long from here.
Target 0,0675.
Pretty tricky and risky, not suitable for beginners.
Don't blame me if it fails, DYOR.
Any opportunity is worth considering.
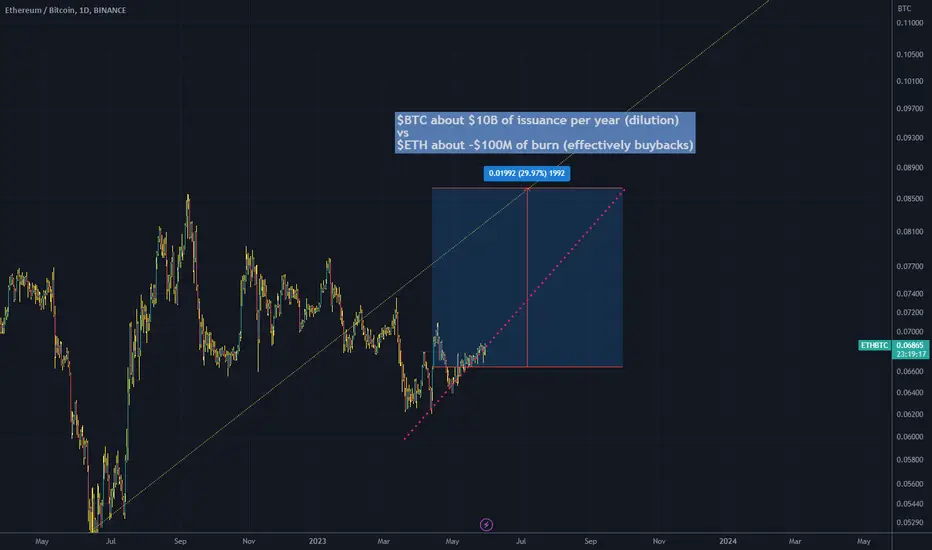
ETH/BTC breakout by SeptContinuing on the current trend, ETH will continue to grind higher against BTC.
This is simple math:
Bitcoin issues nearly $10 BILLION per year to pay miners.
Ether burns (effectively buys back) $100M/yr by contrast
Long ETH is the idea to $2350 minimum.
Sauce:
ETH inverse head and shoulder vs BTCExtremely bullish possibility here for the entire market, as when eth rises against btc it means we are bullish.
If this pattern is successful we can begin looking at that flippening everyone used to talk about.
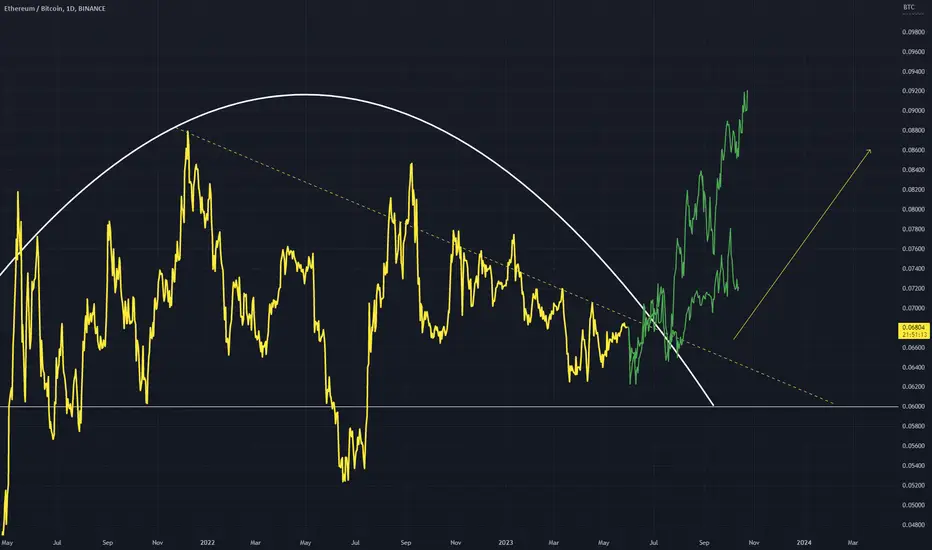
ETHBTC - Rounded TopETHBTC is beginning to look like a rounded top, which can act bullishly once completed.
Once the yellow dashed line breaks price is free to move up.
I have shown price moving up with the bars pattern tool in green.
Daily timeframe
ETHBTC.1DHello dear friends,
*Mars Signals Team wishes you high profits*
This is a daily time frame analysis for ETHBTC.1D
We are in the daily time frame. As you can see, the price is oscillating at the resistance line. If it fails to stabilize above the resistance line, it has the possibility of falling to the first support line and we have shown you the supports. If it can stabilize above the resistance line, we have the possibility to increase to the second resistance line.
Warning: This is just a suggestion and we do not guarantee profits. We advise you to analyze the chart before opening any positions.
Take care

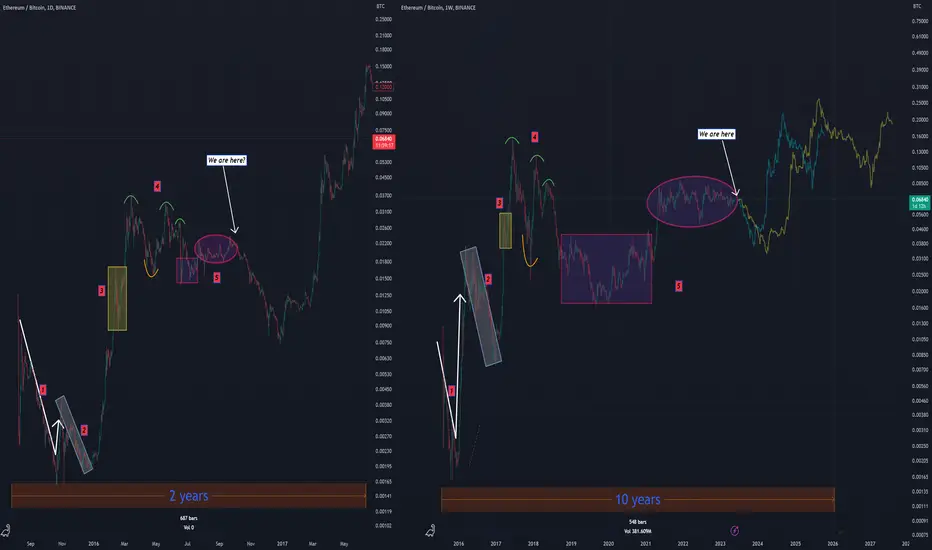
Ethereum – Set to repeat bull 2017 in 2024-2025Chart on the left is ETHBTC zoomed in to the first 2 to 3 years after inception.
Chart on the right is ETHBTC fully zoomed out, from inception to now, about 8 years.
There are remarkable similarities in both time frames of the same chart, as noted below:
1. A sharp decline, followed by an immediate price pump.
2. The rotated rectangle shows a drop in price.
3. Straight up, with a slight correction on the way.
4. This phase is hard to believe it is a different time frame, as the price levels are an exact mimicry of each other. There are 3 lower highs after both cycle tops. The bottom pattern formation is also the same in both charts.
5. A slow & steady rise with the price action in both time frames showing notable similarities.
If the ETHBTC chart on the right were to follow a similar route of ETHBTC on the left, then it is possible that ETHBTC will go lower for the next 6 to 12 months. It is important to remember that this will likely be because Bitcoin will be steadily going higher towards the last ATH, hence ETHUSD will be mostly sideways.
Once BTCUSD breaks $66K, around then ETHBTC will start its rally, which looks like has a final target of 0.3.
The blue and green faded projections at the end outline possible pathways for ETHBTC, depending on how slow/how fast the cycle plays out.
Disclaimer: Keep in mind that market predictions are about as reliable as a weather forecast in outer space. Use this analysis as a conversation starter, not as financial advice. Investing in cryptocurrencies carries risks, so do your homework and make informed decisions. Remember, no crystal balls here—just a pinch of insight and a dash of caution
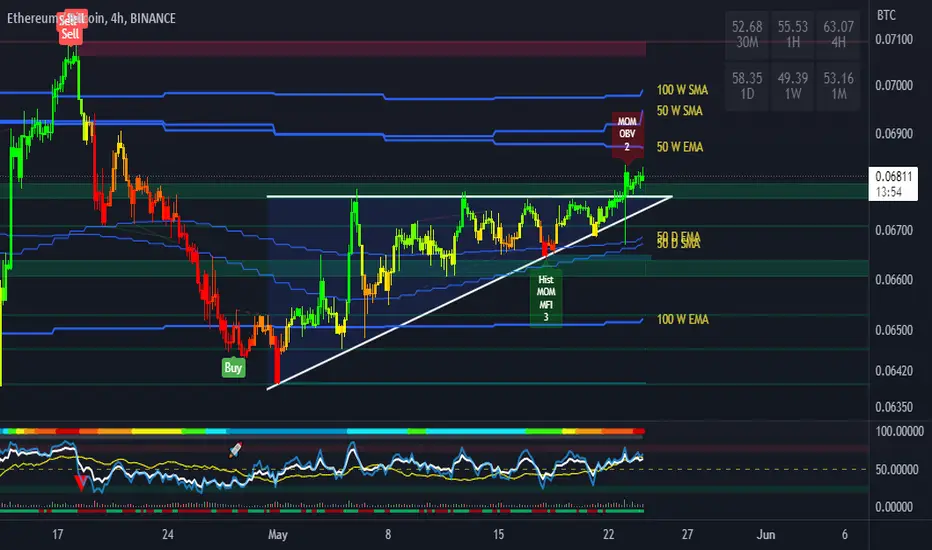
ETH The price has broken above the upper boundary of the triangle and is heading towards the weekly 50 MAs and 100 SMA. The heat map of my oscillator has turned red, indicating an overbought zone signal. A retest of the support level or a correction may be possible in the near future.
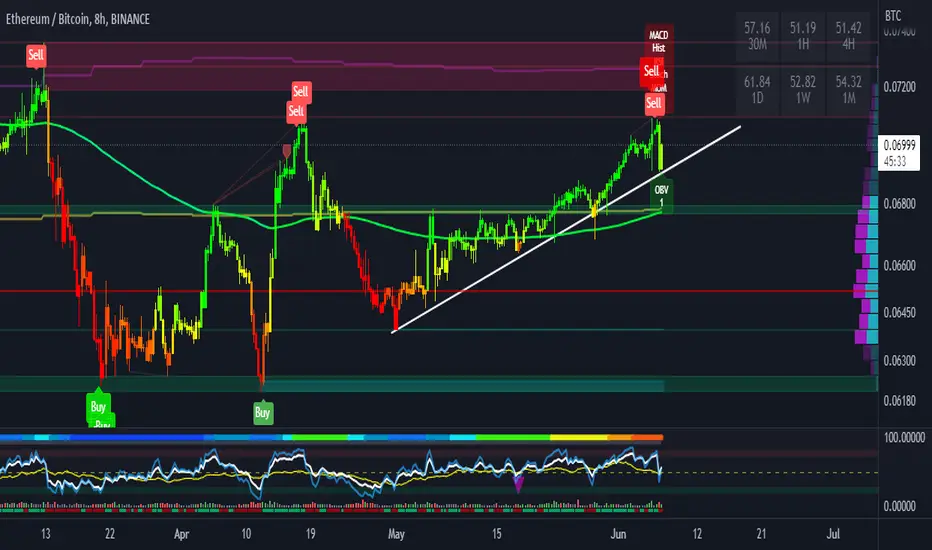
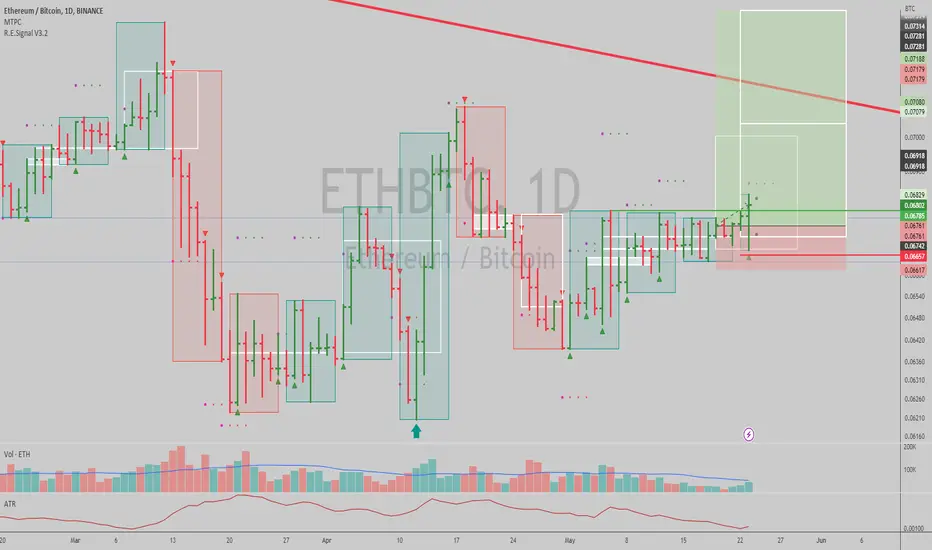
$ETHBTC: Uptrend starting...Notice the ramping of volumes for the last 4 days, higher and higher, with larger daily ranges...with a nice scam wick to shake people out before a real move starts. (volume near average levels for the last month, which is rather solid)
The catalyst of Hong Kong allowing people to buy crypto might help take both Ethereum and Bitcoin out of their consolidations and back into trending up.
Both charts are bullish vs the dollar as of today, which makes it an ideal long entry if you're not invested. But since the ratio of Ethereum vs Bitcoin shows a buy signal, we can safely allocate some capital to Ethereum as well as BTC to ride the next leg up.
I'd suggest staking it if you're investing in this for extended periods of time.
Additionally, you can look into selling calls OTM each month, against your holdings over at Deribit, but that poses extra risks.
As for the immediate setup at hand, the short term upside is substantial, shown by the white boxes on chart here. The entry I suggested to my clients can be seen in the chart as well, we bot both Bitcoin and Ethereum earlier today, vs USD, but also had a leveraged pair trade long in ETH vs BTC that we had entered a few days ago lower.
We've secured gains in that one to not be levered in our crypto accounts, but it could be held if you're playing the relative strength move here. (heck you can enter margin longs in ETHBTC today, as long as sizing is sane)
Best of luck!
Cheers,
Ivan Labrie.
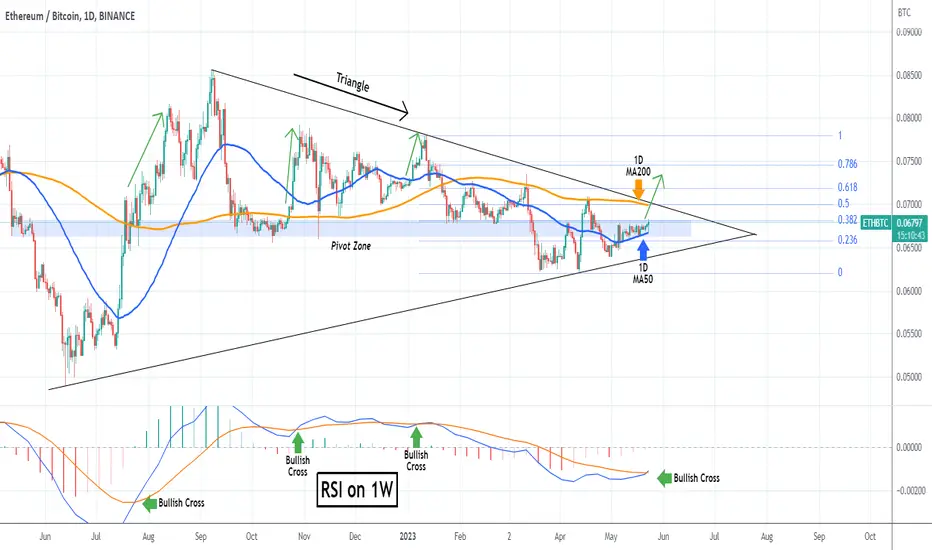
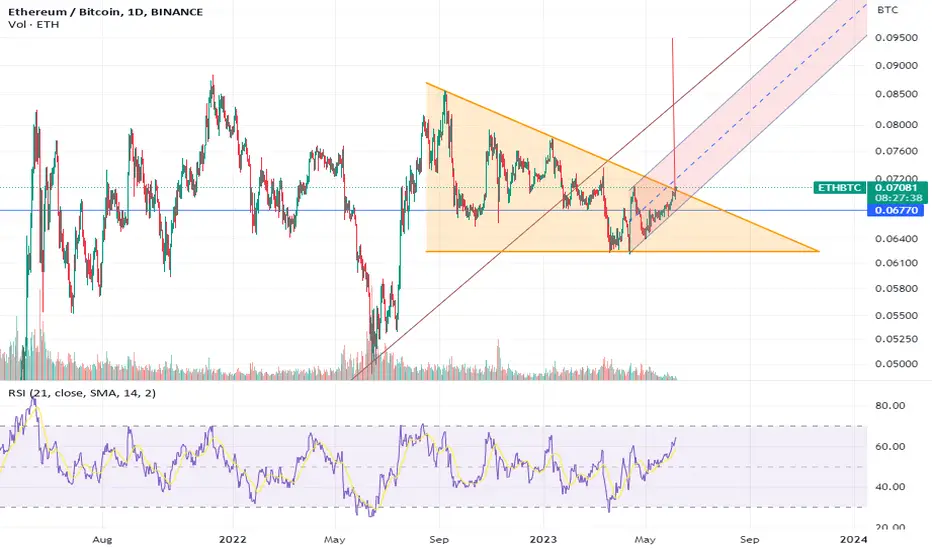
ETHBTC Bullish Cross completed on 1W. Rally ahead.The ETHBTC pair has been trading inside a Triangle pattern for almost a year (since the June 13 2022 Low). For the past 3 weeks the 1D MA50 (blue trend-line) has been supporting while the 1D MA200 (orange trend-line) has been the Resistance since January 21 as the price has failed to close a 1D candle above it (having 3 clear rejections on it).
The key difference here is the formation of a Bullish Cross on the 1W MACD. In the past 12 months, this has always been a Buy Signal. We are buying and targeting the 1D MA200, and if it closes a 1D candle above the 1D MA200, we will extend buying towards the 0.618 Fibonacci level.
-------------------------------------------------------------------------------
** Please LIKE 👍, FOLLOW ✅, SHARE 🙌 and COMMENT ✍ if you enjoy this idea! Also share your ideas and charts in the comments section below! **
-------------------------------------------------------------------------------
💸💸💸💸💸💸
👇 👇 👇 👇 👇 👇