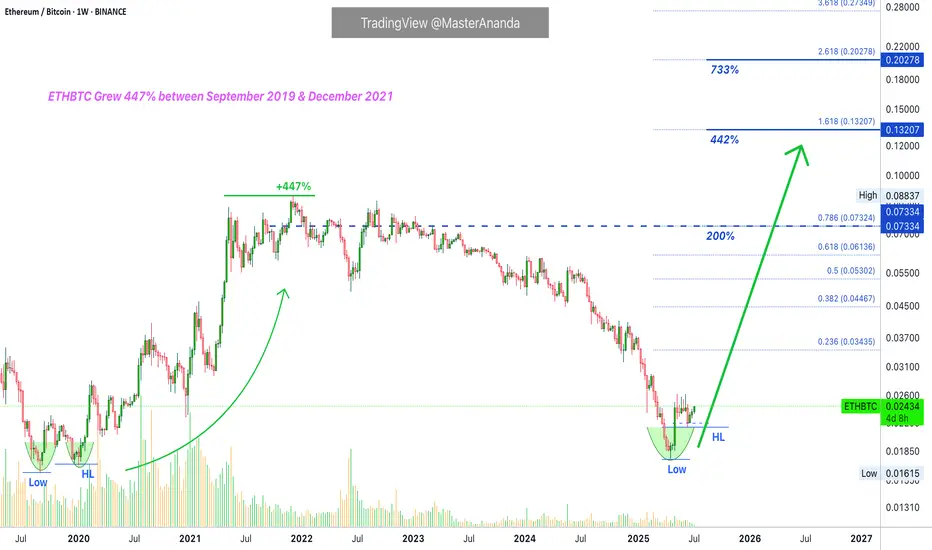
ETHBTC Opportunity Buy: Major 2025 AltcoinSeason & Bull MarketThis is the big one and the good one. ETHBTC was bearish since December 2021 but this cycle finally came to an end in April this year. After the initial bullish breakout and higher low we can clearly see some bullish action developing; three consecutive weeks green. The bullish bias is now confirmed
Related coins
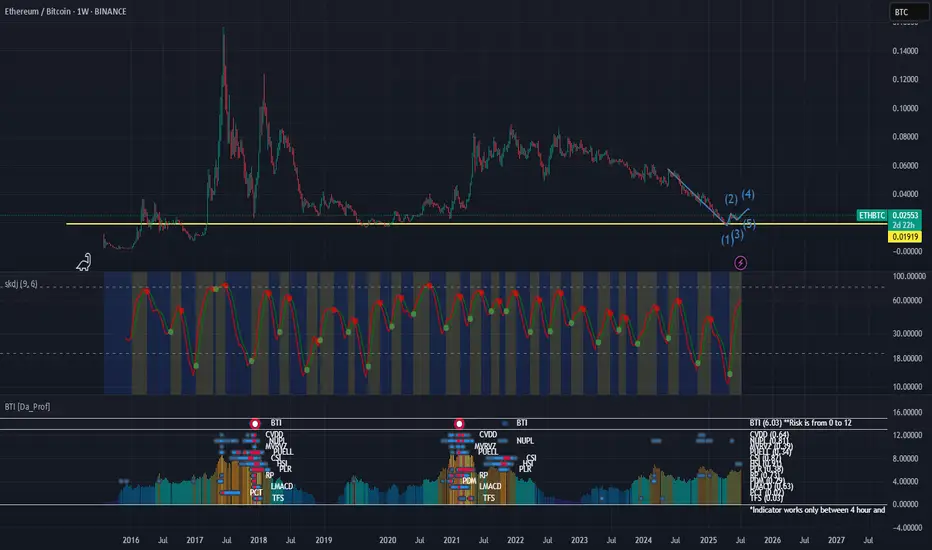
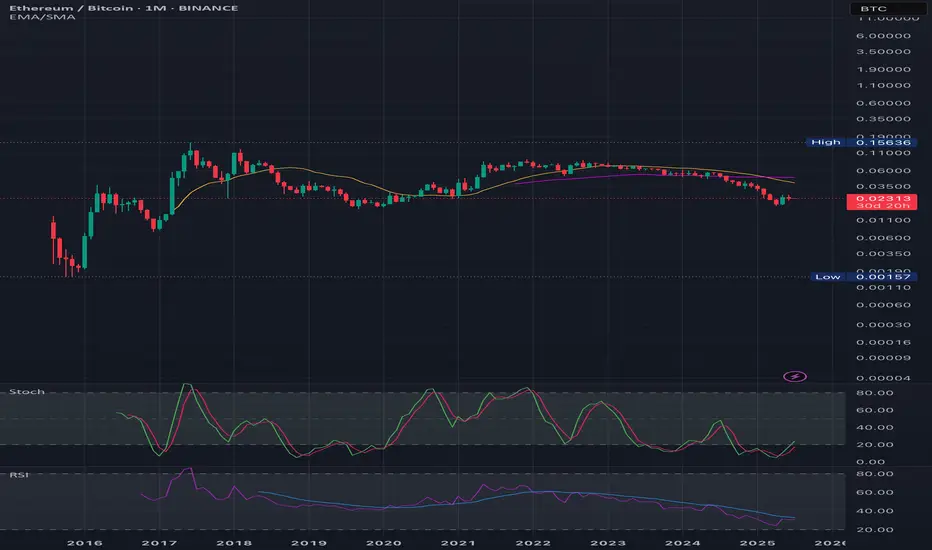
ETH/BTC Reclaiming Macro Bottom — Altcoin Momentum Incoming?ETH/BTC tagged its 2019 cycle low back in April 2025 — a key macro support level that’s held up for nearly six years. Since then, it’s printed a clean rebound followed by a textbook retest. Now it's threatening to break out of the pullback structure formed over the past few months. If this breakout
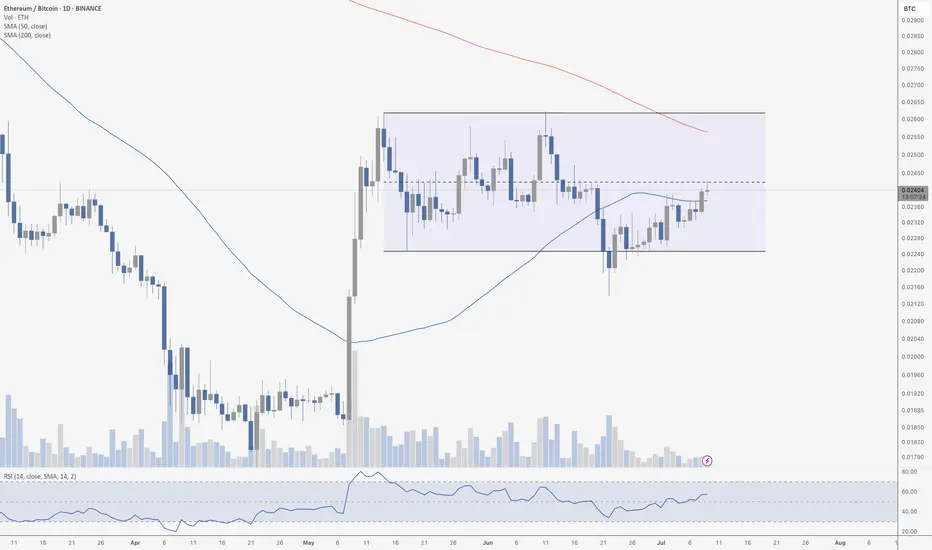
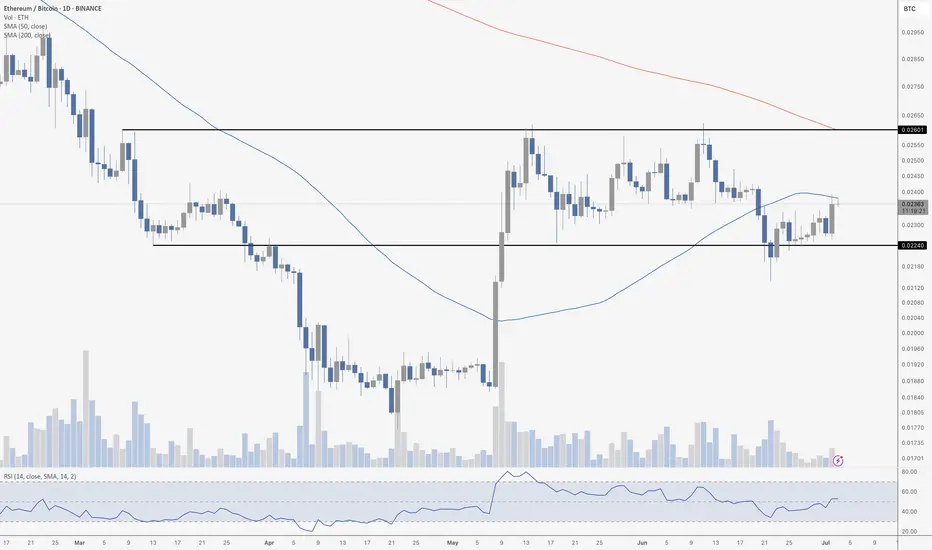
ETH Flips 50 MA Against BTCThe ETH/BTC daily chart shows a prolonged consolidation phase following the explosive breakout in early May. Since then, price has been range-bound between approximately 0.022 and 0.026. We're currently sitting near the EQ (equilibrium) of the range – around 0.0240 – which often acts as a temporary
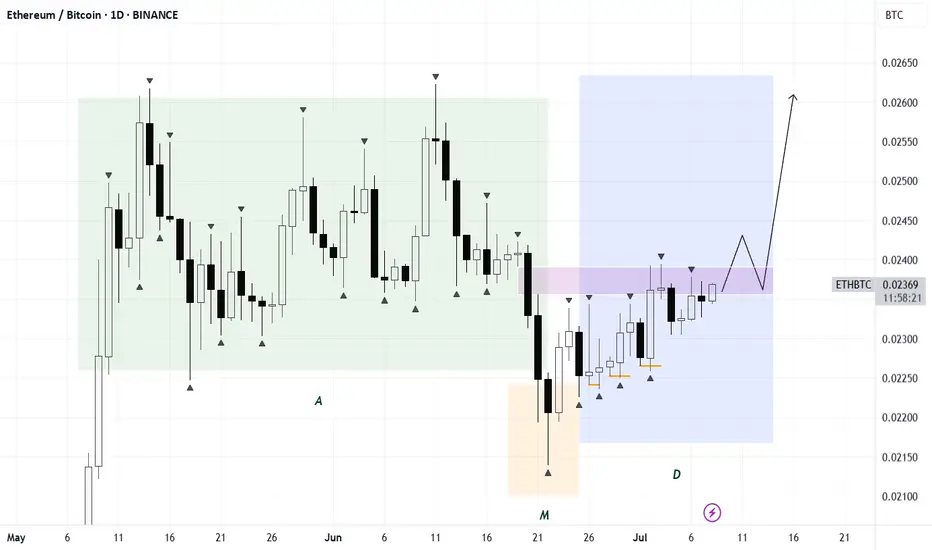
ETH/BTCPrice is following an AMD structure with a liquidity sweep to the downside. For full confirmation of the setup, a daily FVG inversion is required.
Watching closely — confirmation will unlock further directional bias.
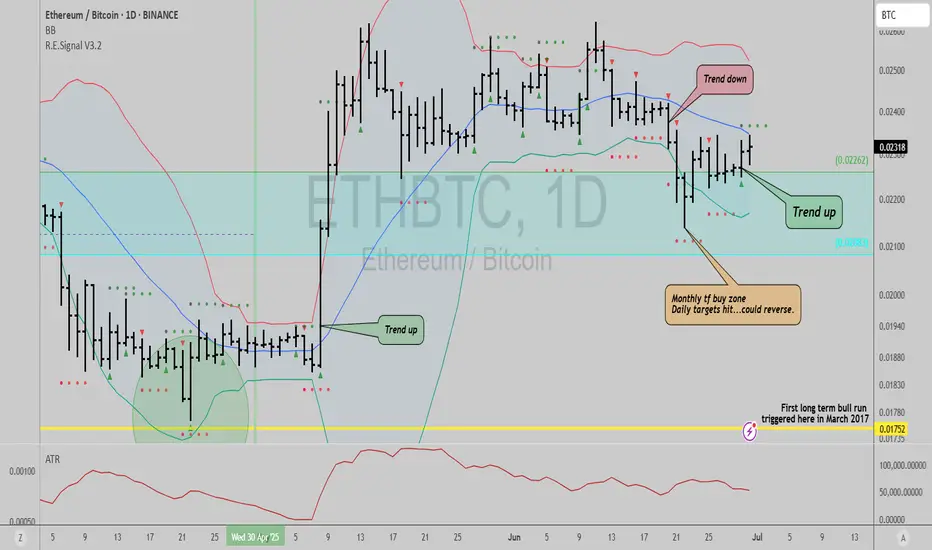
ETH/BTC At 50 MA ResistanceEthereum is battling the daily 50 MA on the ETH/BTC chart, a key area of resistance. If it beaks above, we could see a nice altcoin rally and Ethereum outperforming. If it gets rejected… more of the same.
ETHBTCTick tock
This is the most unlooked at chart in crypto because there is nothing bullish about it but eths fundamentals are insanely bullish
I'm a huge eth bull and hate looking at this chart
It will run it back at some point but its clearly not in a rush and lesser understood on the institutional
Ethereum’s quarterly returns have finally outpaced Bitcoin's !🥶 After a painfully long #altcoins winter, the #ETH/#BTC chart — having recently hit its lowest point in the past 5 years — has finally shown CRYPTOCAP:ETH outperforming CRYPTOCAP:BTC by the end of Q2 2025.
We saw a similar scenario in 2021, when that same bottom was reached a bit earlier, foll
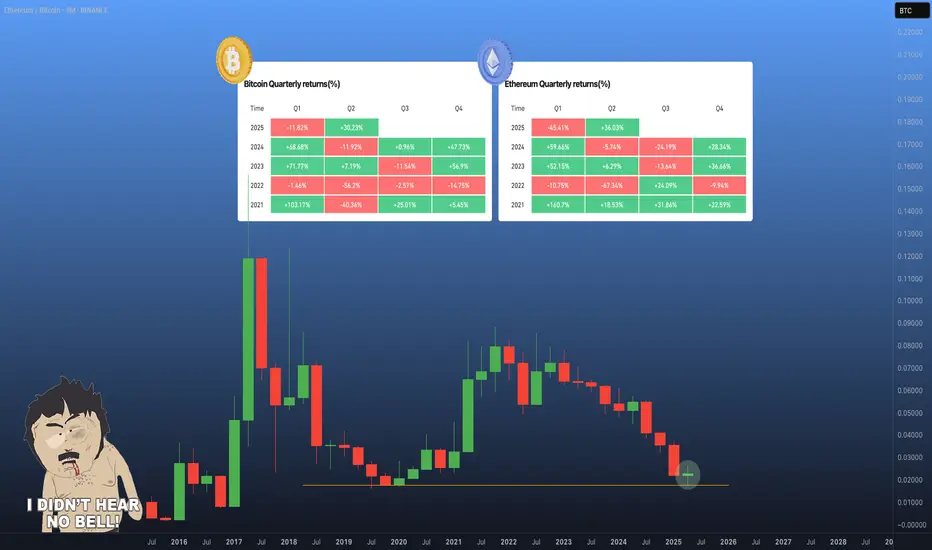
A major turning point
✅ Observations from the Chart
1. Long-Term Support Zones:
• Three key areas are circled (around 2016–2017, 2019, and 2024–2025).
• All three touch similar levels, around 0.022–0.024 BTC/ETH, indicating a strong historical support zone.
2. Previous Rebounds from This Level:
• Each time price hi
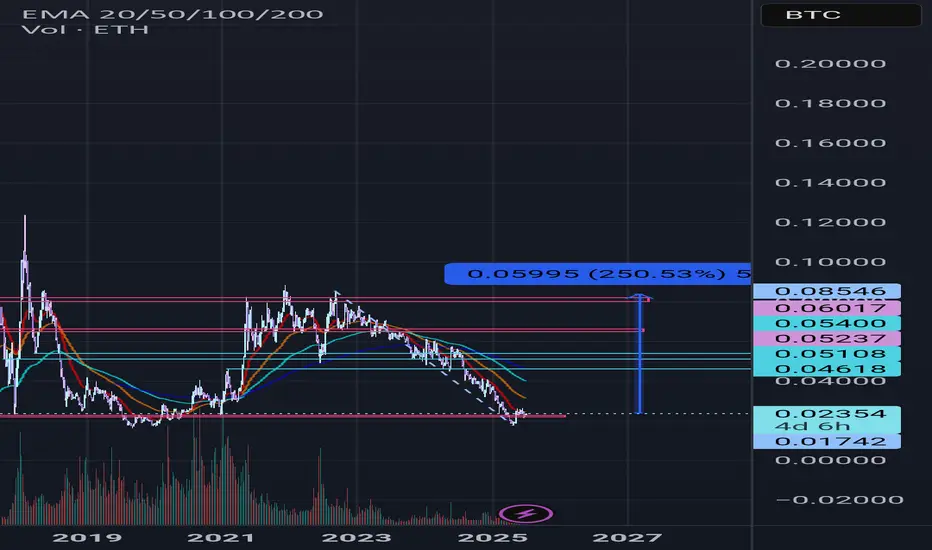
ETH 400% increase Potential Ethereum (ETH) vs. Bitcoin (BTC) Analysis: 400% Upside Potential
Ethereum is showing a massive bullish setup against Bitcoin (ETH/BTC pair), with a potential **400% growth** from current levels. This rally could unfold in **two phases**, each offering around **200% gains**, driven by strong fundam

$ETHBTC: Correction is over?Ethereum vs Bitcoin shows that the strong surge that kicked off during May might not be a one off...
If you take a look at monthly BITSTAMP:ETHUSD and BITSTAMP:BTCUSD , both charts show a bullish trend that is active until EOY at least (maybe even during the first half of the whole of 2026 depen
See all ideas
Summarizing what the indicators are suggesting.
Oscillators
Neutral
SellBuy
Strong sellStrong buy
Strong sellSellNeutralBuyStrong buy
Oscillators
Neutral
SellBuy
Strong sellStrong buy
Strong sellSellNeutralBuyStrong buy
Summary
Neutral
SellBuy
Strong sellStrong buy
Strong sellSellNeutralBuyStrong buy
Summary
Neutral
SellBuy
Strong sellStrong buy
Strong sellSellNeutralBuyStrong buy
Summary
Neutral
SellBuy
Strong sellStrong buy
Strong sellSellNeutralBuyStrong buy
Moving Averages
Neutral
SellBuy
Strong sellStrong buy
Strong sellSellNeutralBuyStrong buy
Moving Averages
Neutral
SellBuy
Strong sellStrong buy
Strong sellSellNeutralBuyStrong buy
Displays a symbol's price movements over previous years to identify recurring trends.