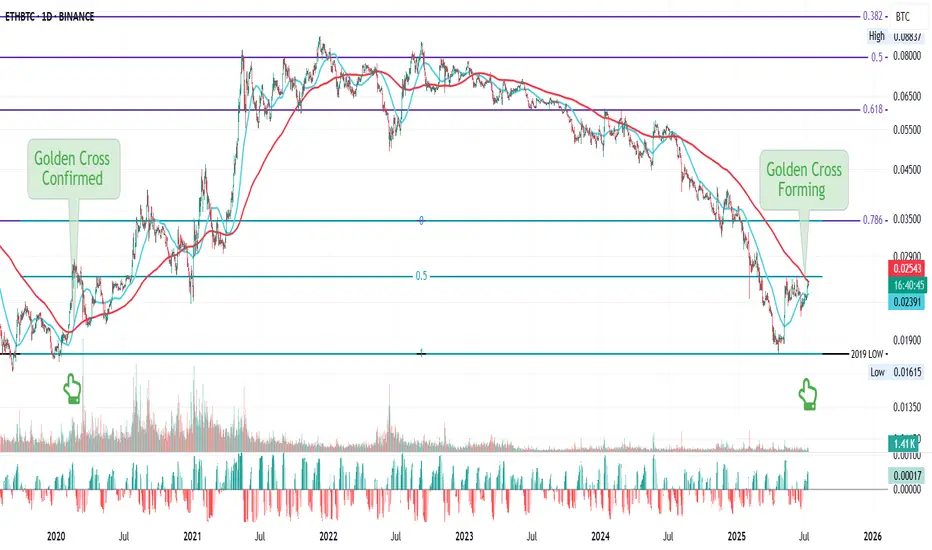
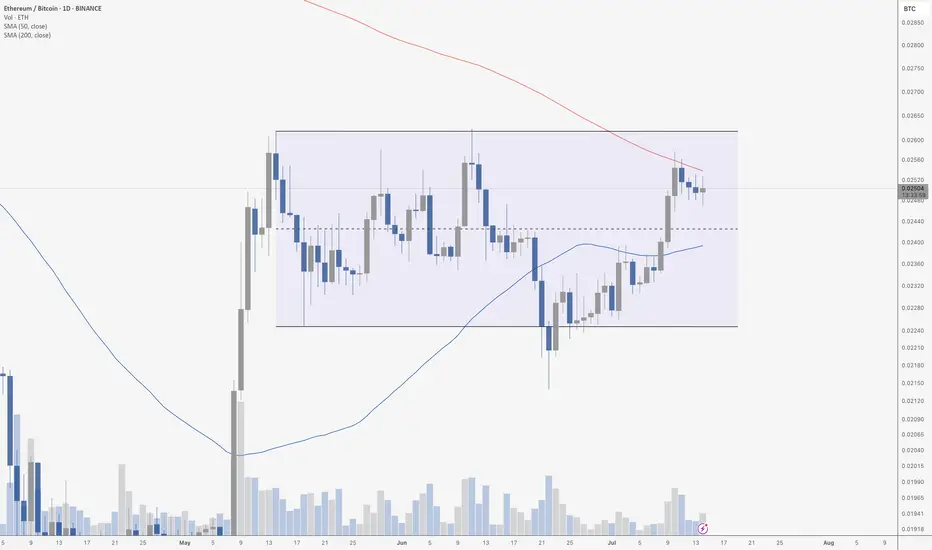
ETH/BTC: Golden Cross Reloaded?This is ETH/BTC on the daily chart.
A major event is about to unfold: the golden cross, where the 50MA crosses above the 200MA.
The last time this happened was in early 2020, around the same price zone, right after a bounce off the 2019 low double bottom and a rejection from the 0.5 Fib level, whic
Related coins
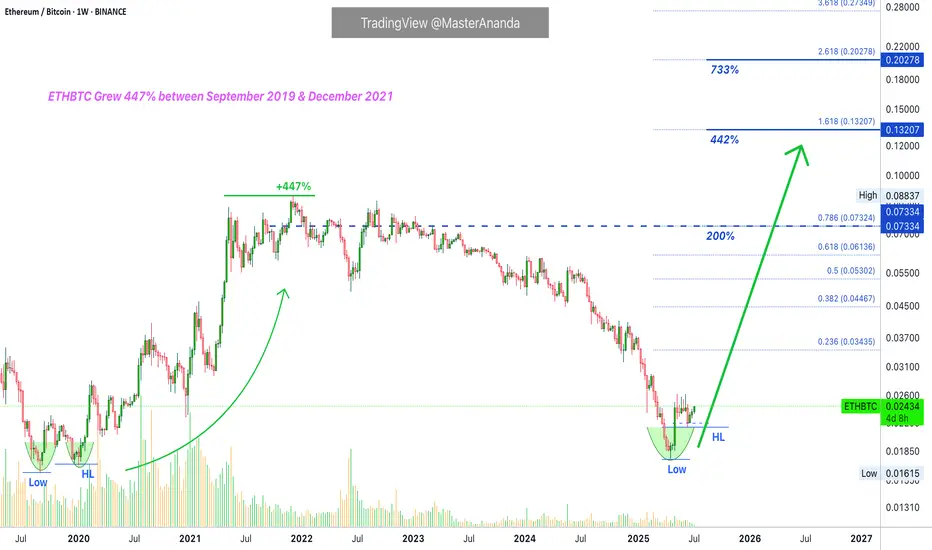
ETHBTC Opportunity Buy: Major 2025 AltcoinSeason & Bull MarketThis is the big one and the good one. ETHBTC was bearish since December 2021 but this cycle finally came to an end in April this year. After the initial bullish breakout and higher low we can clearly see some bullish action developing; three consecutive weeks green. The bullish bias is now confirmed
ETH VS BTC, Ethereum will outperform this summer!The bitcoin price set a new all-time high earlier this week at 123,000 US dollars, confirming that the bullish cycle linked to the spring 2024 halving is far from over. This current bullish cycle is set to end in autumn 2025, if the market continues to repeat past cycles - bitcoin's famous 4-year cy
ETH/BTC Reclaiming Macro Bottom — Altcoin Momentum Incoming?ETH/BTC tagged its 2019 cycle low back in April 2025 — a key macro support level that’s held up for nearly six years. Since then, it’s printed a clean rebound followed by a textbook retest. Now it's threatening to break out of the pullback structure formed over the past few months. If this breakout
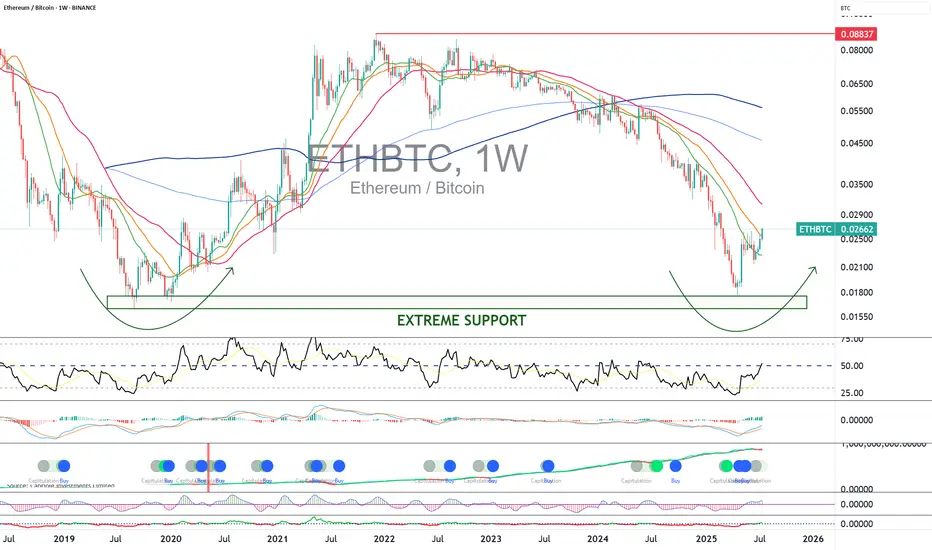
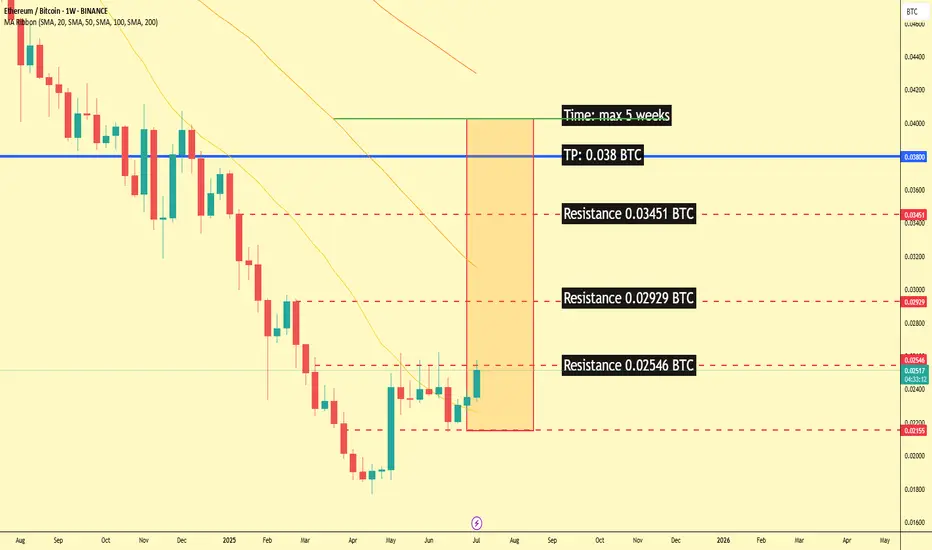
ETH/BTC Poised for a Breakout: A Technical and Fundamental ViewA confluence of technical signals on the weekly ETH/BTC chart, coupled with significant fundamental developments for both Ethereum and Bitcoin, suggests a potential upward move for the pairing in the coming weeks.
Technical Analysis (TA)
The weekly chart for ETH/BTC on Binance reveals a potential
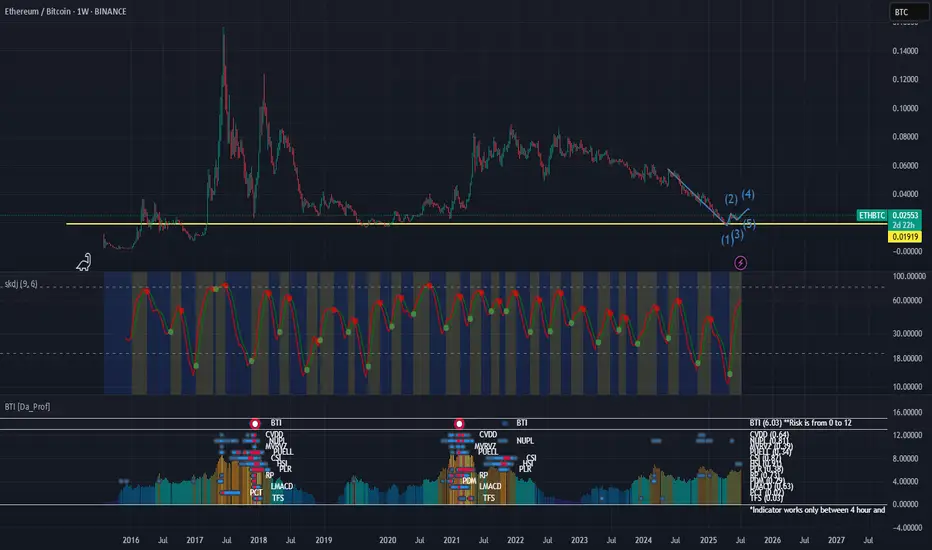
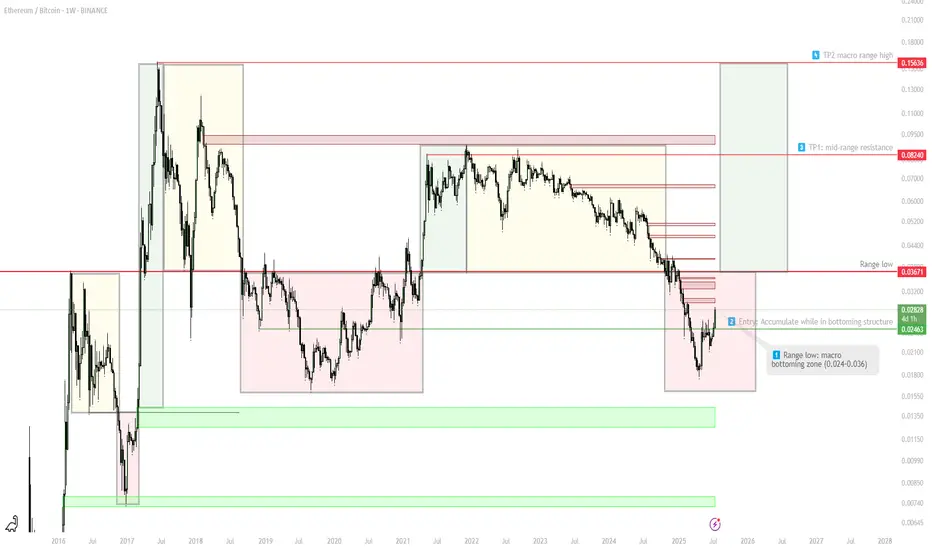
ETHBTC — Macro Range Bottoming Play1. Macro bottom in 0.024–0.036 zone
2. Accumulate while price holds above range low
3. TP1: 0.0824 (mid-range resistance)
4. TP2: 0.156 (macro range high)
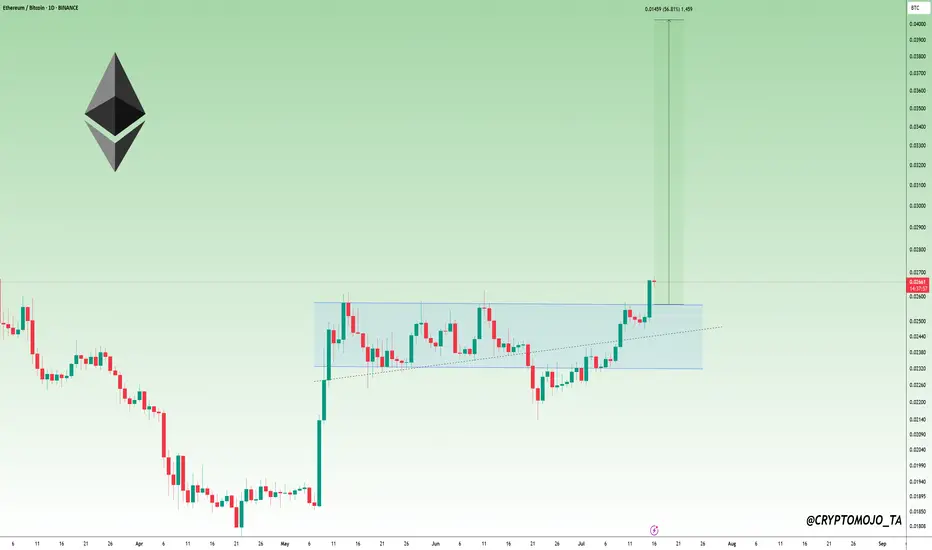
$ETH Breakout Alert!🚀 CRYPTOCAP:ETH Breakout Alert!
Ethereum has finally broken above $ 0.02583, a strong resistance level that had stopped it for months.
ETH is starting to look stronger than BTC.
Next targets:
🔹 0.02985 – near-term resistance
🔹 0.03281 – major targethad
🔹 0.0415 – full breakout target (around +5
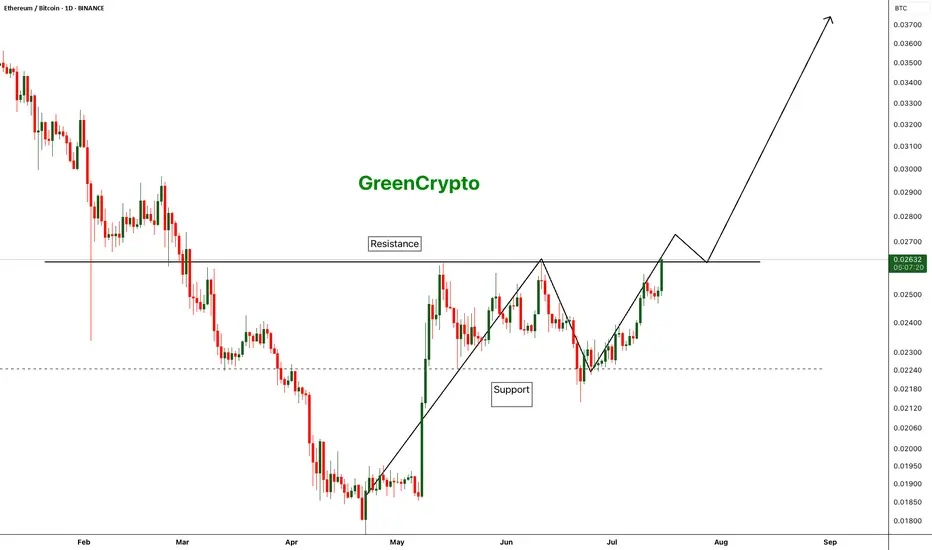
ETH/BTC - Finally Trend is reversing - After a long time we are finally seeing a change in the trend of ETH/BTC pair.
- Compared to BTC, ETH was underperforming for last couple of years and we are seeing some strength in ETH
- If this trend continue we can finally see some new ATH on ETH
Entry: 0.02633
StopLoss: 0.02125
TP1: 0.0282
Never underestimate Ethereum (Ethereum Season)After a 3 Year Bitcoin Season an Ethereum Season could be coming, not to be confused with an ordinary Altcoin-Season.

ETH/BTC AT 200 MA RESISTANCEQuick update on ETH/BTC. As discussed, ETH is finding strong resistance at the daily 200 MA, riding it down for 5 days. On the ETH/USD chart, the 50 and 200 MAs are in the rearview. A break above the 200 MA on the daily chart vs. BTC could signal a major move in altcoins.
See all ideas
Summarizing what the indicators are suggesting.
Oscillators
Neutral
SellBuy
Strong sellStrong buy
Strong sellSellNeutralBuyStrong buy
Oscillators
Neutral
SellBuy
Strong sellStrong buy
Strong sellSellNeutralBuyStrong buy
Summary
Neutral
SellBuy
Strong sellStrong buy
Strong sellSellNeutralBuyStrong buy
Summary
Neutral
SellBuy
Strong sellStrong buy
Strong sellSellNeutralBuyStrong buy
Summary
Neutral
SellBuy
Strong sellStrong buy
Strong sellSellNeutralBuyStrong buy
Moving Averages
Neutral
SellBuy
Strong sellStrong buy
Strong sellSellNeutralBuyStrong buy
Moving Averages
Neutral
SellBuy
Strong sellStrong buy
Strong sellSellNeutralBuyStrong buy
Displays a symbol's price movements over previous years to identify recurring trends.