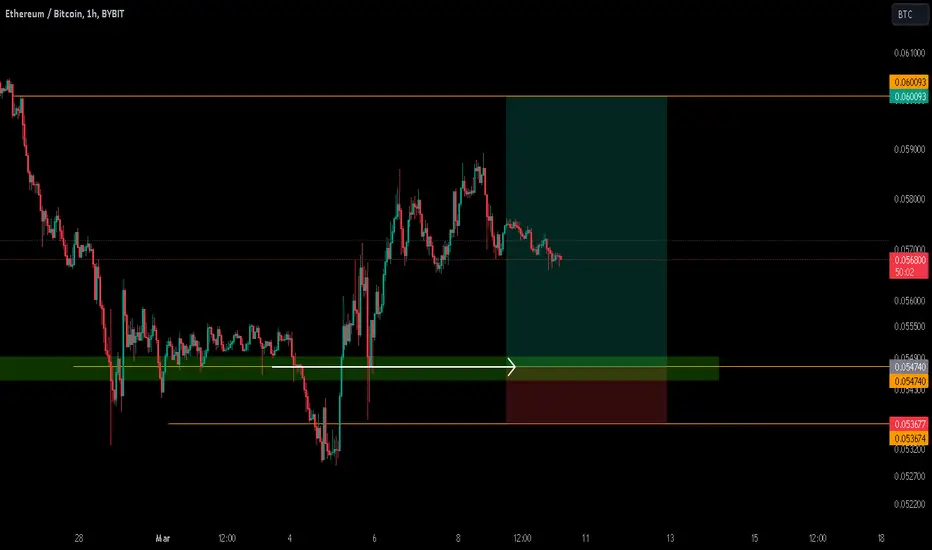
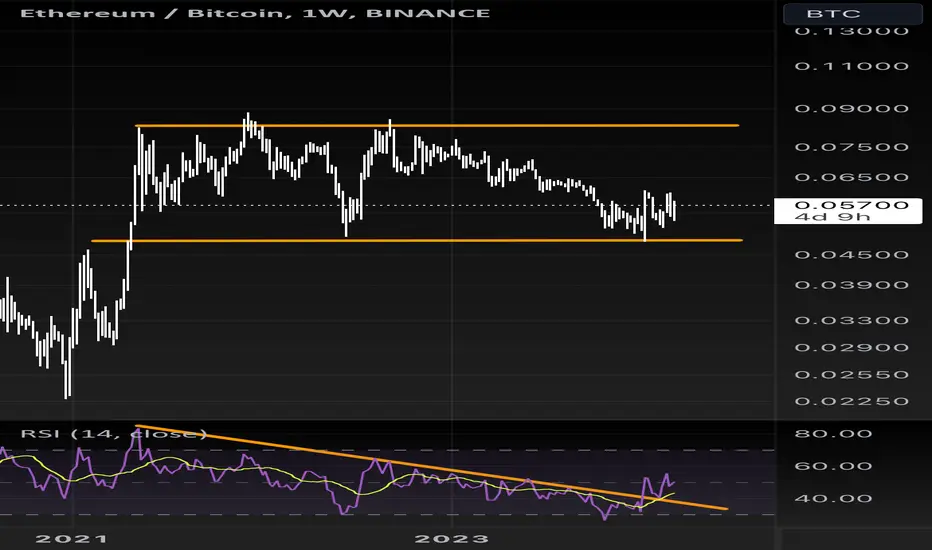
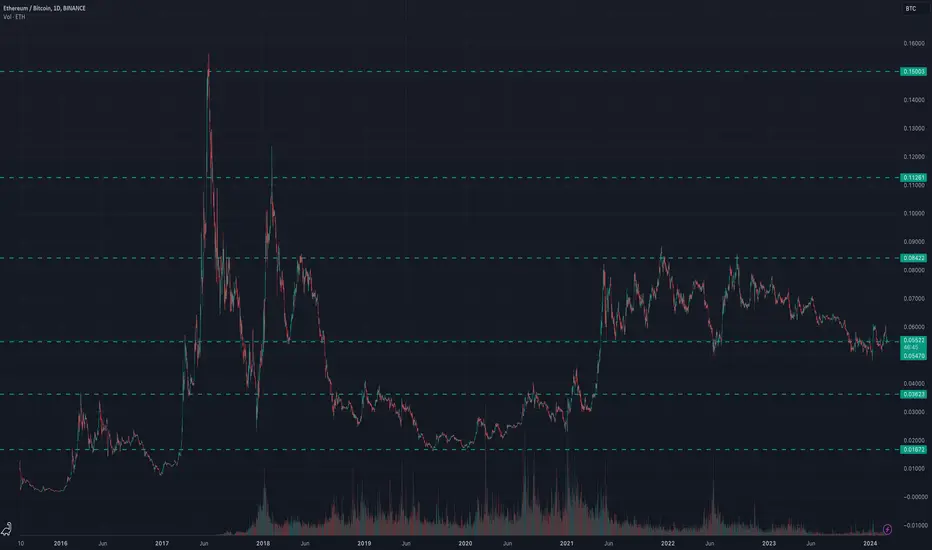
ETH vs Bitcoin ! support level holding !Ethereum is testing again this resistance level with bitcoin
If this support breaks : its bad for ETH -and and worse for altcoins! (we all know that)
However if we are really in a bull market.. well-this support should hold..
But also it may break briefly to scare the bulls... and weak hands !
My bullish targets are on this chart (as always)
ETHBTC trade ideas
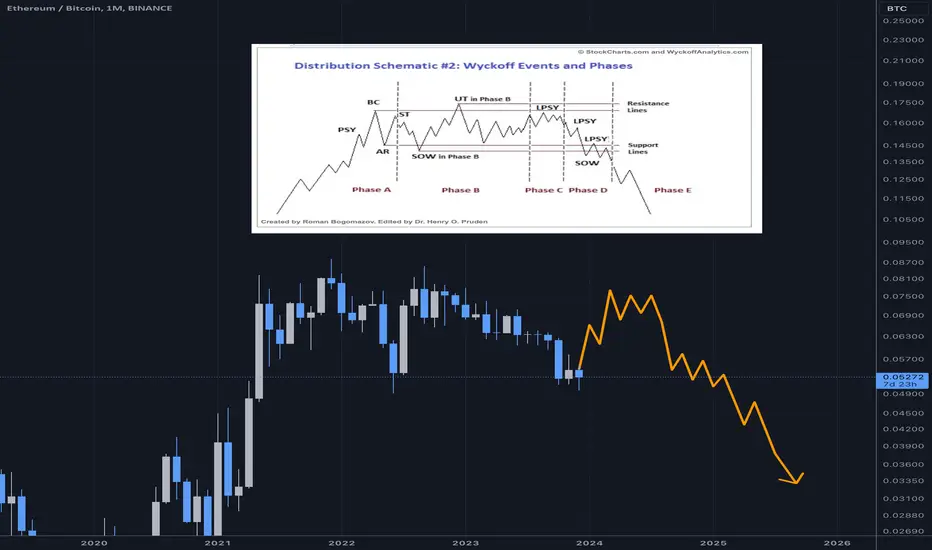
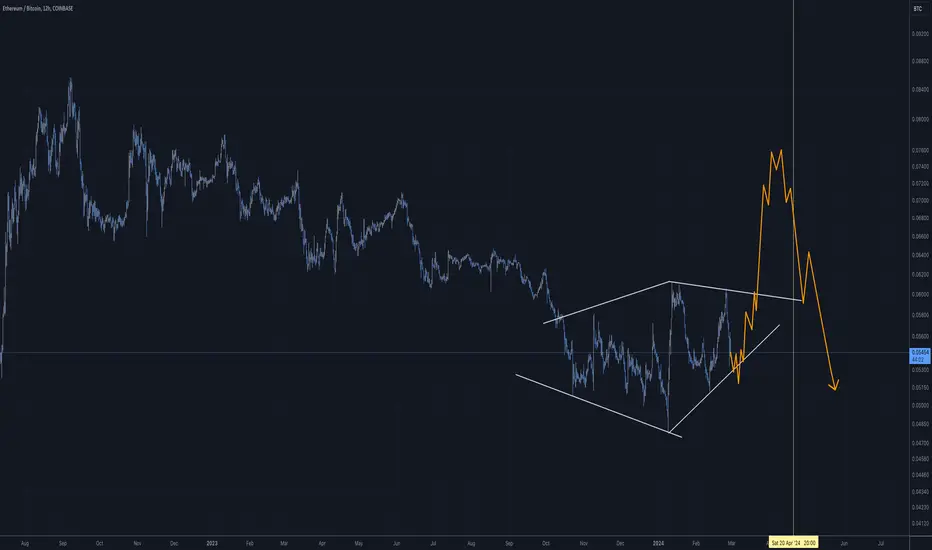
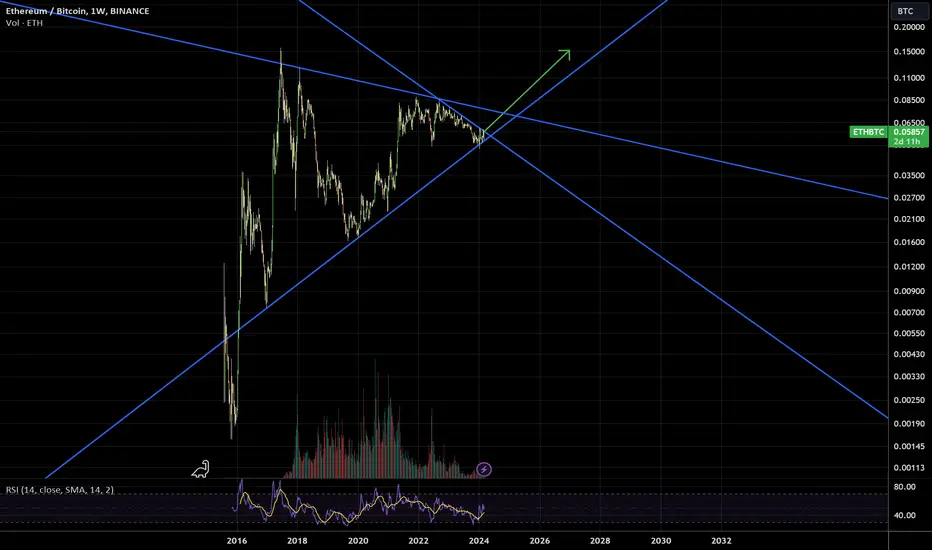
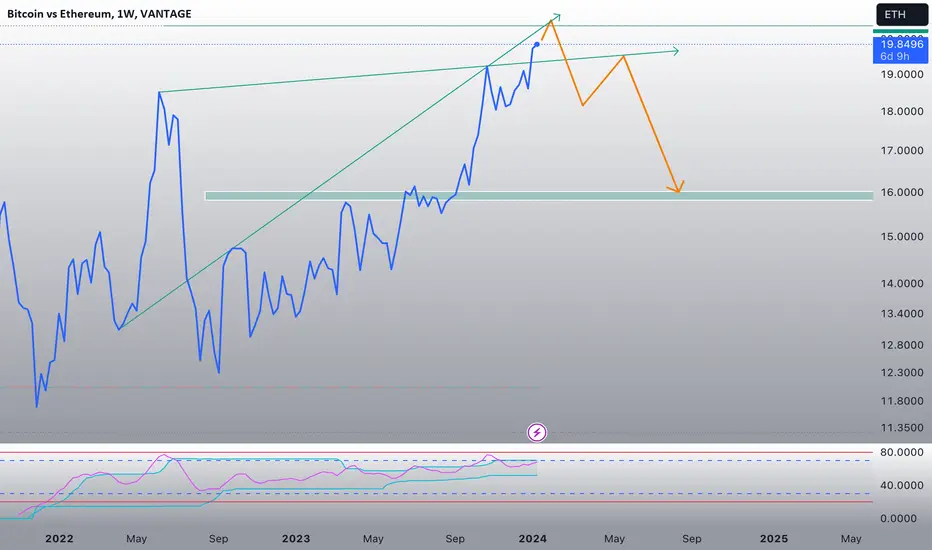
Ethereum domain map 2 This is now the general direction of the Bitcoin Ether chart, and when it reaches the shaded area below, it will head again to test the historical top in the shaded area above.
Note: This is a weekly chart, which means it will take some time to fall to the shaded area below, and the average time to rise again to test the shaded area above.
If this chart and dozens of other successful analyzes on my page helped you, please like and comment
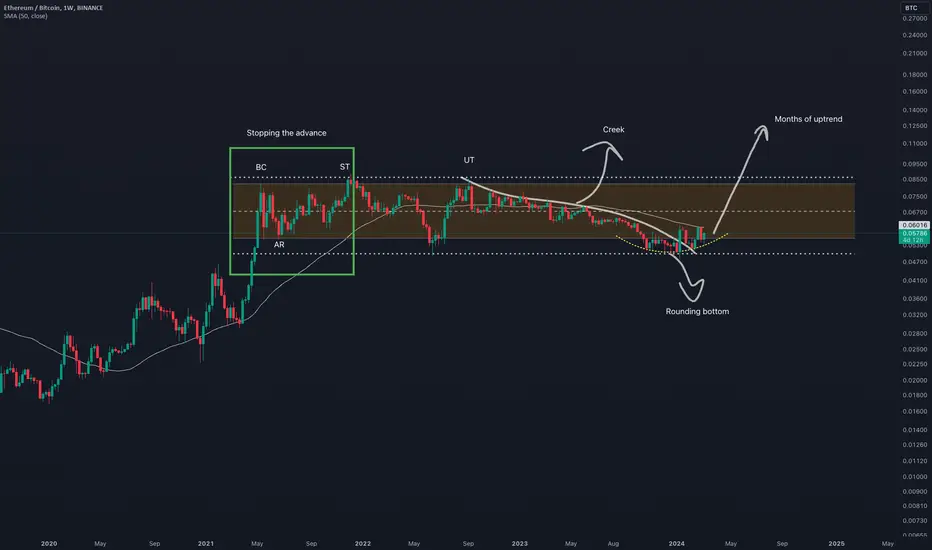
ETHBTC Distribution Schematic #2hase A: Phase A in a distribution TR marks the stopping of the prior uptrend. Up to this point, demand has been dominant and the first significant evidence of supply entering the market is provided by preliminary supply (PSY) and the buying climax (BC). These events are usually followed by an automatic reaction (AR) and a secondary test (ST) of the BC, often upon diminished volume. However, the uptrend may also terminate without climactic action, instead demonstrating exhaustion of demand with decreasing spread and volume; less upward progress is made on each rally before significant supply emerges.
In a redistribution TR within a larger downtrend, Phase A may look more like the start of an accumulation TR (e.g., with climactic price and volume action to the downside). However, Phases B through E of a re-distribution TR can be analyzed in a similar manner to the distribution TR at the market top.
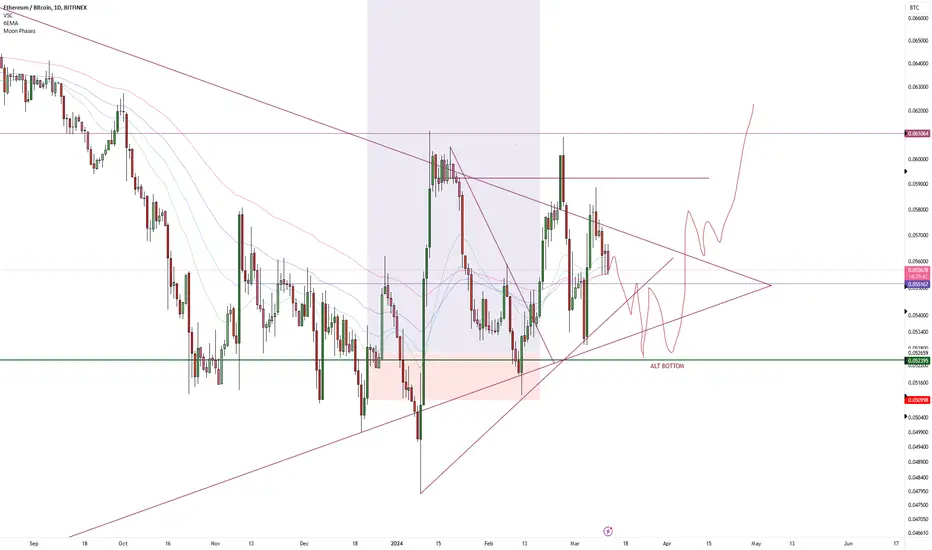
ETH BTC diamond bottom and wykoff schematic 2I'm bullish on ETHBTC for the next 2 months.
ETH spot ETF narrative.
The Bitcoin spot ETF was a "Buy the News" event; maybe the ETH Spot ETF will also be a "Buy the News" event.
I like 0.075 ETHBTC.
Sell if the ETJ flipping narrative comes into play.
ETHBTC last chanceETHBTC is at a critical point imo. Looking for a strong bounce around here.
Remember, real fun begins when ETH starts to lead.
📈Ethereum overtake Bitcoin after Dencun update!📉BINANCE:ETHUSDT
COINBASE:ETHUSD
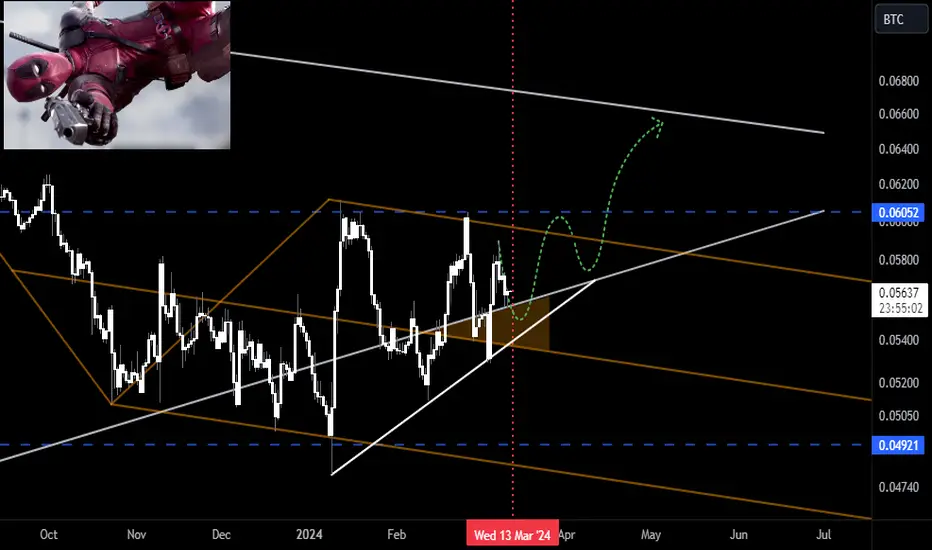
Ethereum can start an upward scenario on the eve of its update.
The condition for the occurrence of this bullish scenario is the stabilization of the price in the yellow range.
after that, the bullish scenario can continue up to the level of 0.06 and after stabilizing above specified level, it can go up to the channel.
✌💥If you are satisfied with my analytical content, please share my ideas💥✌
✍🐱👤Otherwise, make sure you leave comments and let me know what you think.🐱👤✍
🍾Thank you for your support. I hope you will gain profit by following my analyses.🍾
ETHBTC is Clearwe will see higher price as soon as possible and the best decision to trade is right now on power full weekly trend line.
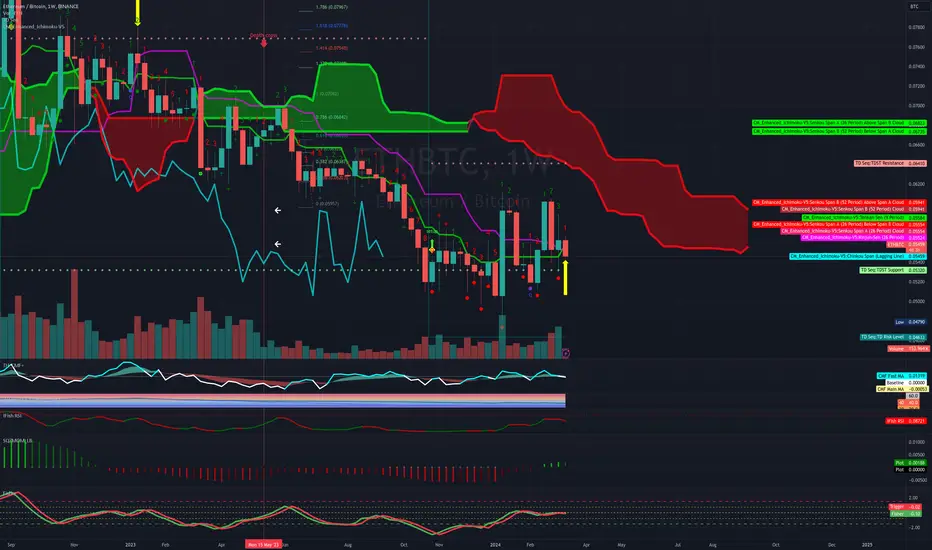
ETHBTC - 14th March 2024 Ichimoku Weekly ChartETHBTC - 14th March 2024 Ichimoku Weekly Chart
Welcome Pirates!
We have just got a TK Cross on the weekly ETHBTC Ichimoku.
Fisher is heading North.
Sqz Momentum green but waning.
IFish curling down
VZO PZO has bottomed out.
Moneyflow is at the zero line and heading south.
So I dare say there will be a little more downside, but we should see this bad boy turn around back up to the 0.06 zone.
Be on the look out pirates.
Happy sailing the high seas.
f.society, f.police, f.govt, f.politicians.
Snake Plissken signing out!
Peace.
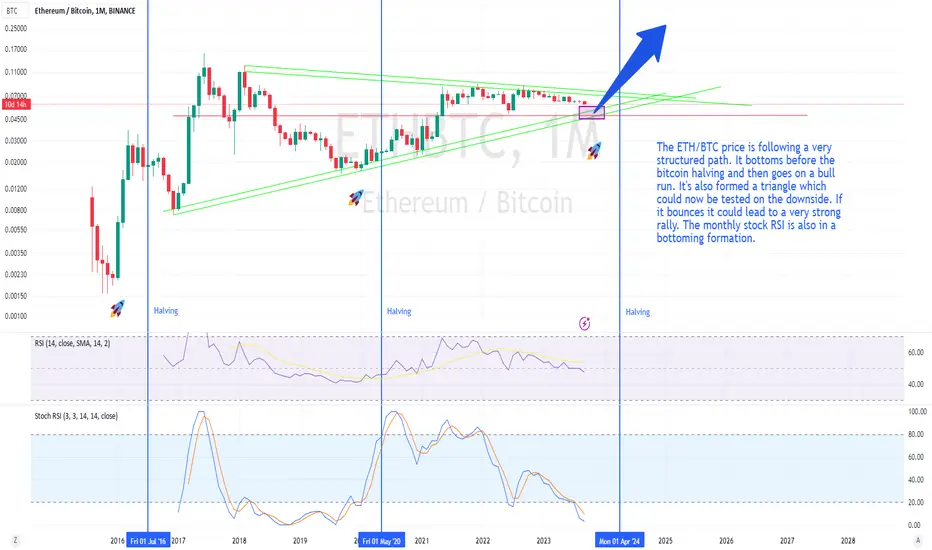
ETH/BTC could be bottoming out and setting up for a huge runThe ETH/BTC price is following a very structured path. It bottoms before the bitcoin halving and then goes on a bull run. It's also formed a triangle which could now be tested on the downside. If it bounces it could lead to a very strong rally. The monthly stoch RSI is also in a bottoming formation.
GOOD LUCK ON ALTSWe'll have altbtc bottom here.
altusd will maybe drop 10-20% while btc stays still.
or
altusd stays still while btc gains 10%
Will Ethereum dominate?I've been talking about possible macro bullishness of ETHBTC for some time. My confidence has increased since then. I think this chart is about to prove its bullishness.
So here is the idea with better graphics now.
How is this going to interact with ETHUSD?
Honestly, I can't provide a great theory since the dollar pair is just "number go up" atm. Is a blow-off top possible? Will the ATH be a macro resistance? I don't know. Never underestimate the craziness of crypto.
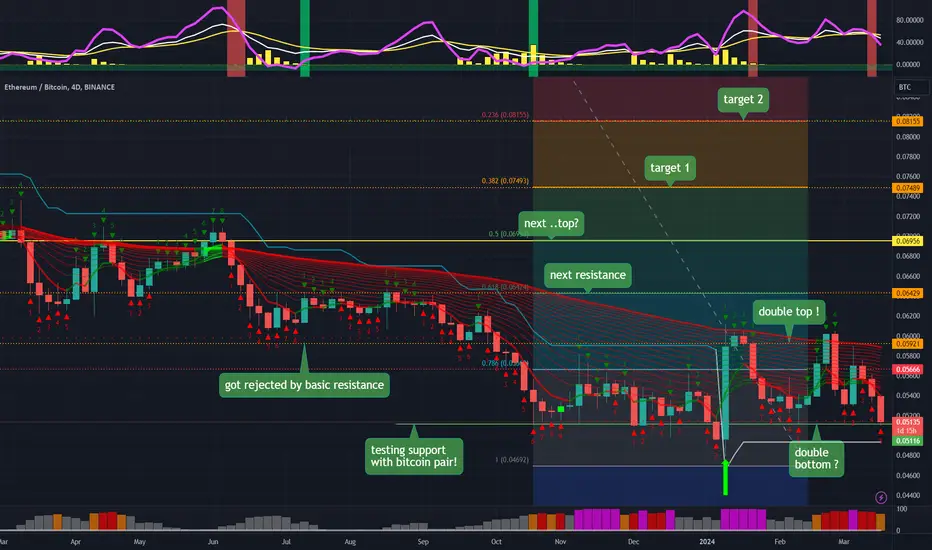
Ethereum / Bitcoin: what is the best short term choice?A local uptrend is replacing a long downward trend for the Ethereum/ Bitcoin chart.
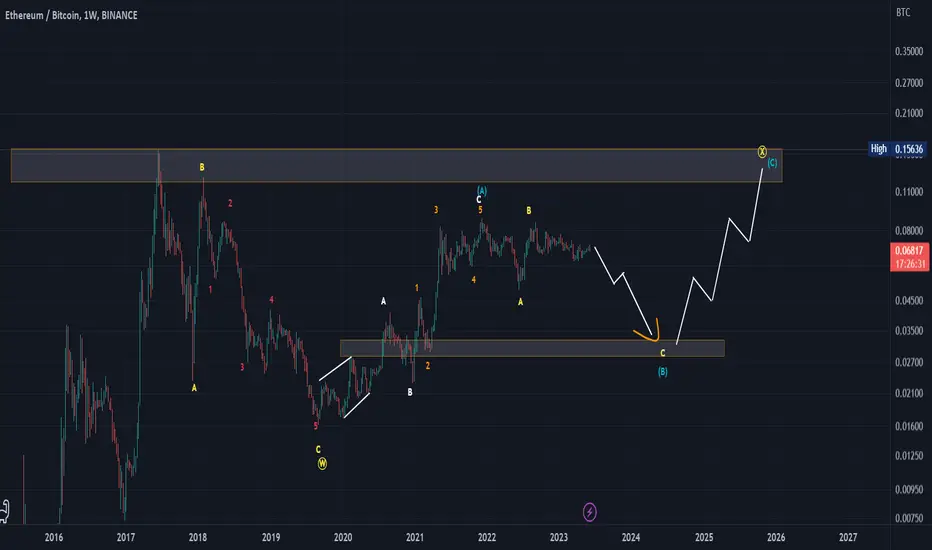
#ETHBTC elliot waveThere are two possibilities for the direction of Ethereum against Bitcoin. The first is that it is an ascending five-point wave from a larger ascending five-point wave, or that it is a fourth ascending corrective wave from a larger bearish wave.
BINANCE:ETHBTC

Ethereum can strengthen against BitcoinThere are many new developments in the Ethereum ecosystem, but to summarize, EIP-4337, EIP-4844, L2 layers are expanding and increasing in number, leading many L1 networks to pivot to L2 Ethereum chains.
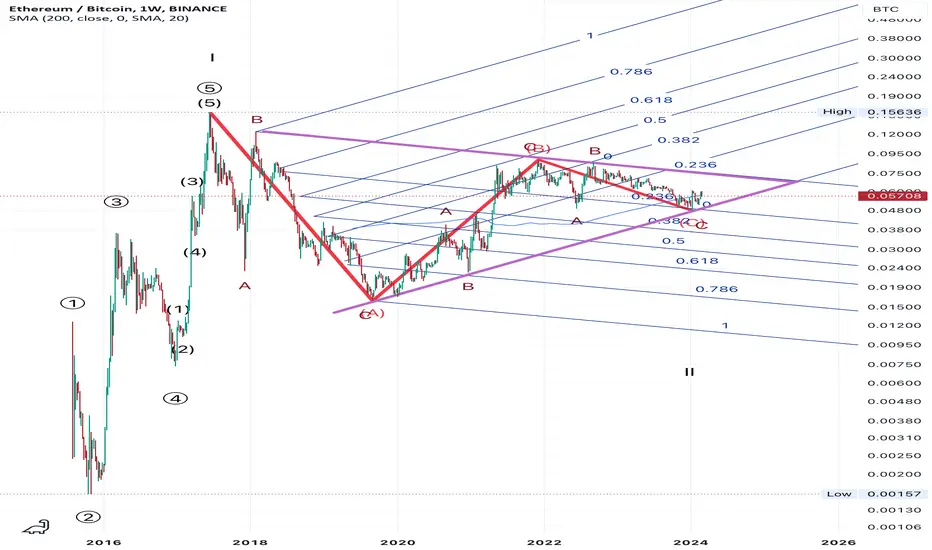
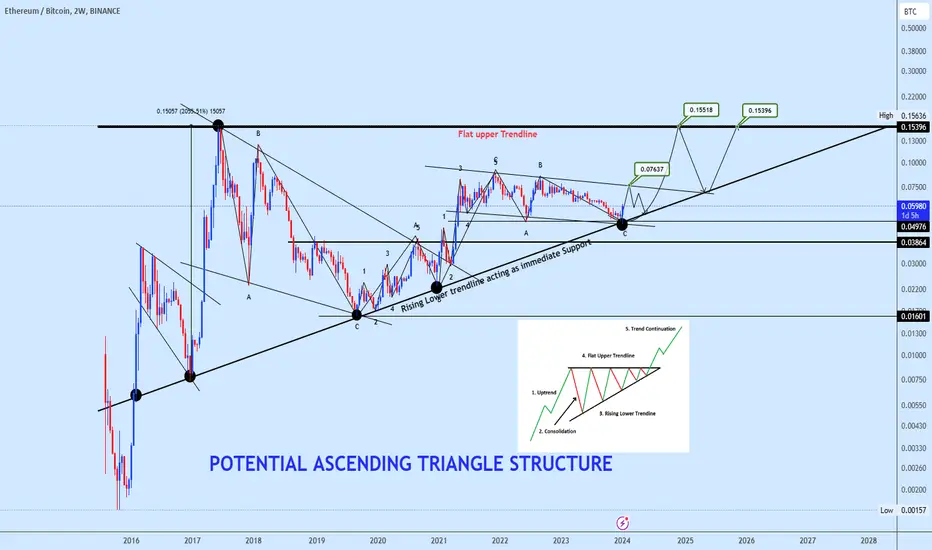
ETH-BTC Ethereum Elliott and Fibonacci structureThis study shows the Ethereum market against Bitcoin in terms of Elliott waves on a grid of Fibonacci trend lines generated from major price points of the market.
This highlights the distinctive triangular structure of trading for several years after the initial impulse of Ether to a Cycle high price.
Ever since printing the initial Cycle wave I, it has traded in a corrective pattern of a running flat with consistent internal 3-3-3 composition (ABC).
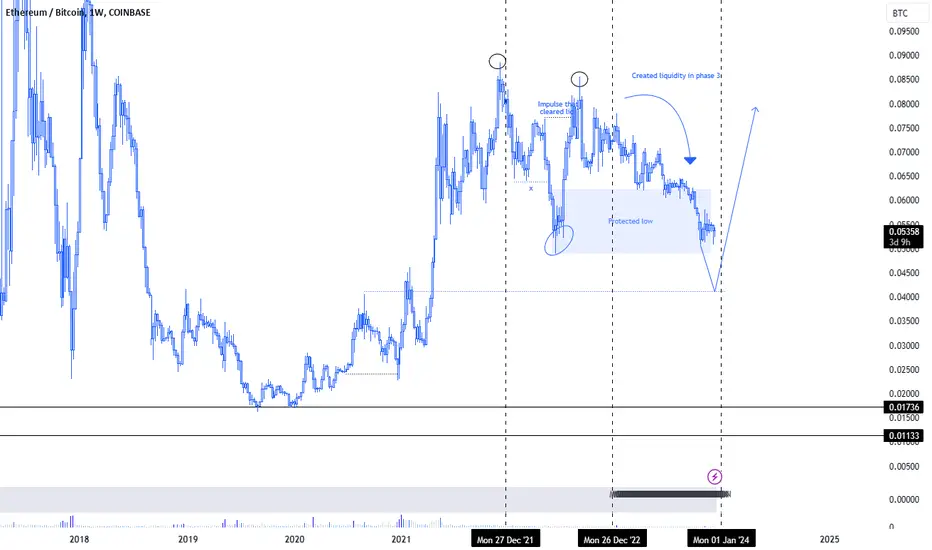
ETHBTC updateIt looks like the body of candles broke and closed the last level. Also, it looks like the next entry point for a buy for both ETHBTC would be where the impulse cleared liq. which lines up perfectly with the beginning of 2024. We'll see if its a bullish year for crypto. BUT it could also buy up hard and then dump hard to continue the bearish cycle.
ETH TO PUSH FOR TOP OF RANGE? Note the RSI breakout and retest.
Will this give Eth a shot at the upper range of the channel? Real question is will it break up or fail at the upper range? We’ll let the fans decide.
Good luck to all
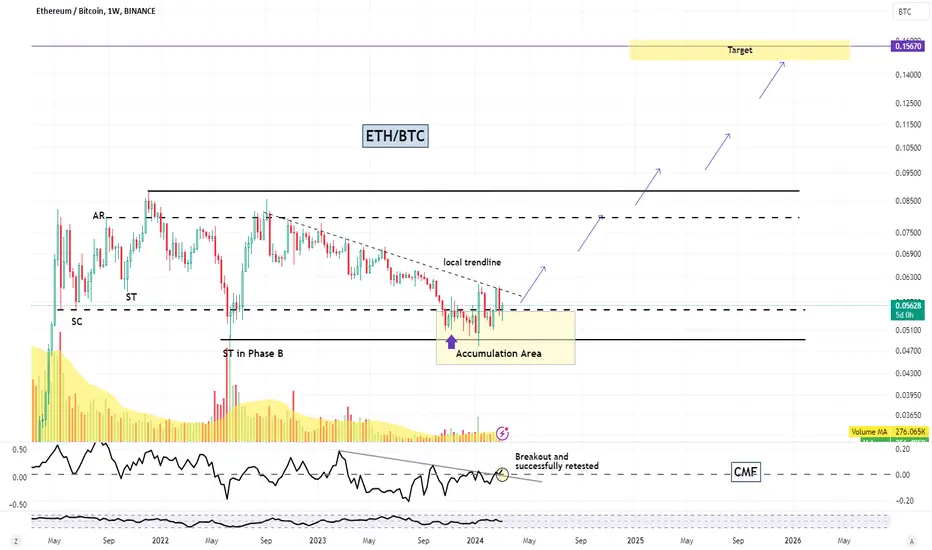
ETH will outperform BTC
ETH/BTC pair forms a typical Accumulation schematic, following Wyckoff method.
In my analysis, it seems that ETH/BTC has likely reached its lowest point as the Spring event in phase C nears completion, paving the way for phase D and a potential acceleration to the upside. The primary obstacle seems to be the local trendline, but this shouldn't pose a significant challenge.
From a long-term perspective, I believe investing in ETH holds greater profit potential compared to BTC. However, this doesn't imply that an all-in approach on ETH is advisable. Diversification remains crucial in any investment strategy.
Disclaimer:
This analysis is based on my personnal views and is not a financial advice. Risk is under your control.
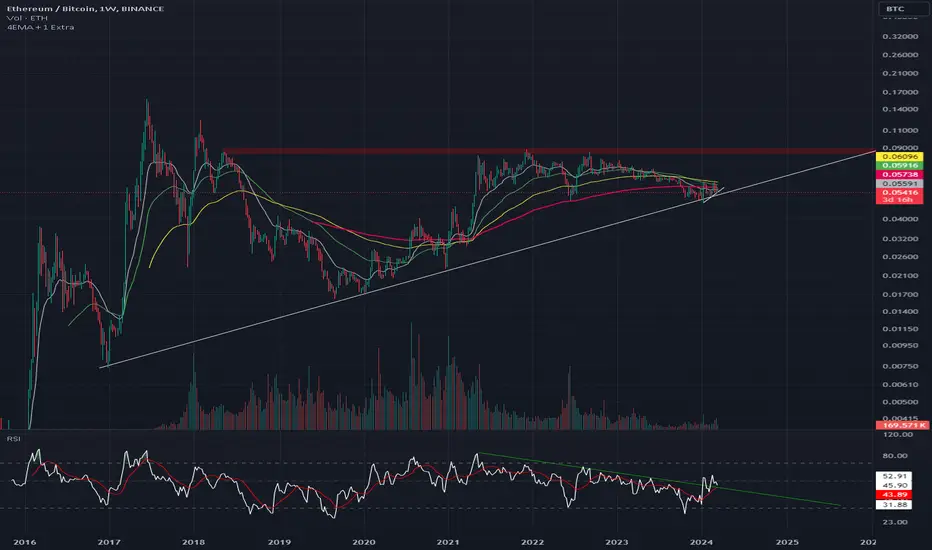
IS IT TIME FOR ETHBTC BREAKOUTLooks like ETH is finally ready to breakout against BITCOIN.
A 4 year long ascending triangle breakout is gonna melt faces when the breakout finally happens.
With a lot of factors helping the ETH narrative for the next coming months, a breakout is inevitable and it is gonna be a huge move. Highly bullish on ETH and all the L2'S of ETH.
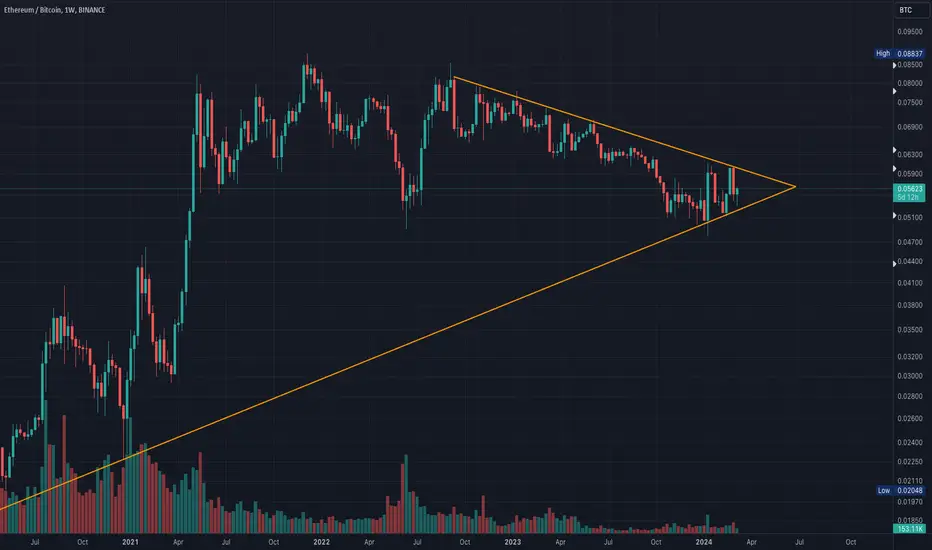
Ethbtc trading opportunityETHBTC appears to be forming an ascending triangle pattern, traditionally seen as a bullish signal. We anticipate the price will ascend from the rising lower trendline, which has been providing robust support, towards the flat upper trendline, maintaining the rhythm of the pattern.
We've marked several key levels to monitor on the chart. Our current assessment is that the Neckline will hold, keeping the price movement contained within the triangle's boundaries.
We welcome you to share your perspectives with us, and if you find our analysis valuable, a like would be greatly appreciated.
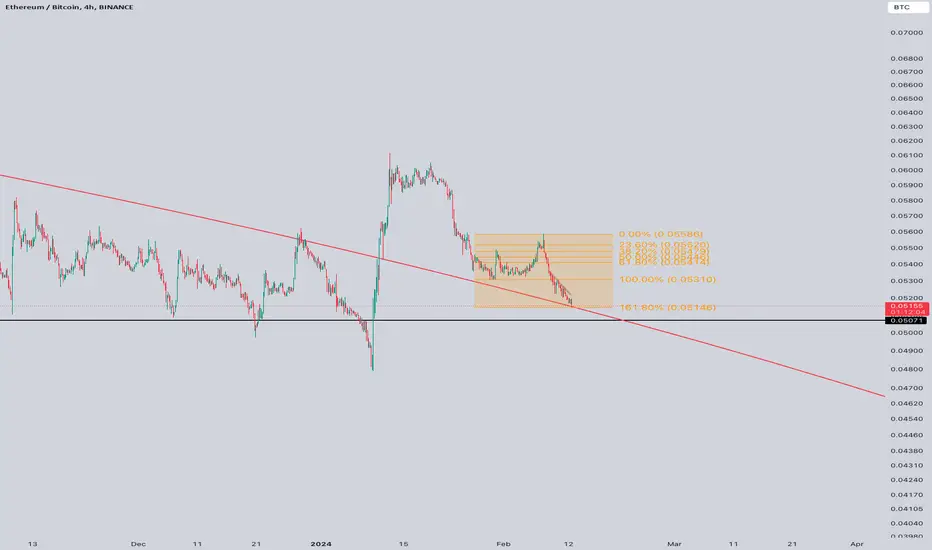
ETH/BTC Levels to Pay AttentionThese are levels to pay attention in case ETH/BTC decides to make a move
BTCETH - We wait for what is to come!Dear my friends,
With the data I have from 2021. Only once did BTC price outperform ETH by 20 times. Then ETH regained its dominance. And BTC is only 11 times more than ETH.
Now, we again see BTC being 20x more than ETH. Indicators and resistance also indicate that history will repeat itself again.
I expect this, and we will have a mini altcoin in Q1. Then BTC will regain its dominance for a period that could last until the end of Q2 or 2024. And from there we There will be a real Altcoin season when ETH officially regains control and the real Altcoin season will begin.
Some sharing about predictions that I saw after looking at the BTCETH chart. Its similarity to the BTC.D chart makes me even more confident that this scenario will happen.
Best Regards,
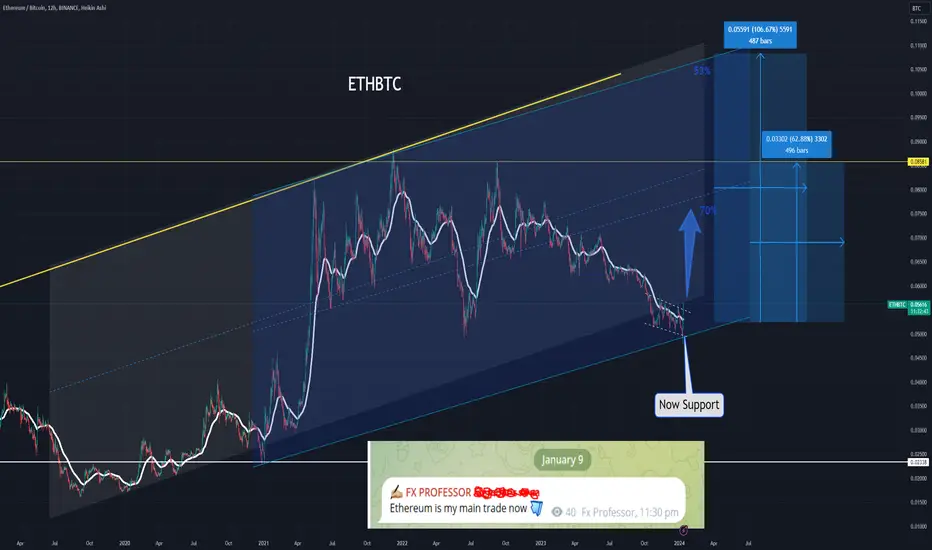
ETHBTC- Can Rise Significantly Ethereum has been outshining Bitcoin recently, just as we anticipated. A significant breakout is looming on the Ethereum-Bitcoin chart, heralding what might be the beginning of Ethereum's rapid ascent, outpacing Bitcoin in the days, weeks, and even months ahead.
Following the Bitcoin ETF approval, analysts like James Safart from Bloomberg are now evaluating the potential for an Ethereum ETF. This speculation over an impending Ethereum ETF approval in May has sparked conversations about a potential parabolic rally for Ethereum and other altcoins.
Interestingly, Bloomberg Intelligence hints at a 70% likelihood of a spot Ethereum ETF's approval. The SEC's first verdict on the spot Ethereum ETF application is expected by May 23. This situation presents a classic "buy the rumor, ignore the news, and buy the next rumor" event.
Our track record on Ethereum speaks for itself. We accurately predicted short positions on Ethereum just before it hit $5,000 and again at $3,580. Moreover, in June 2022, we shared a perfect re-entry long on Ethereum at $960. Since then, we've provided three more solid entry points for Ethereum trades in the last 48 hours.
Looking at the Ethereum-BTC chart, our prediction was spot-on about Ethereum's rise preceding the Bitcoin ETF's approval. Currently, Ethereum shows support at $2,543, with initial targets at $2,921 and $3,269. Eventually, I foresee Ethereum reaching new all-time highs within the next 18 months.
For today, watch for the key levels: $538 support and $2,918 resistance. As always, we'll approach this step by step, so stay tuned for more insights.
One Love,
The FXPROFESSOR 💙
Links: www.theblock.co...her-price-surge?utm_source...
finbold.com/expert-o...r-spot-etf-approval/